RDP 9802: Systematic Risk Characteristics of Corporate Equity 4. The Stylised Facts
February 1998
- Download the Paper 266KB
The next analytical stage is intended to estimate the relationships between equity return behaviour and both previous equity return behaviour and observed firm characteristics. This section presents non-parametric representations of these relationships. Bivariate and conditional densities are estimated, relating equity betas both to their own lagged values and to observed characteristics of the firms. These densities are estimated by pooling across both firms and time. A key benefit of using estimated densities is that many of the econometric difficulties encountered in trying to model the ‘representative’ firm or portfolio can be avoided. Banz (1981) describes and addresses many of these difficulties within a linear regression structure.
4.1 Computing the Law of Motion for Beta
The law of motion for equity betas is characterised as a first-order Markov process with the current equity beta defining the current state. This law of motion describes the density from which the next period's equity beta is drawn, conditioning on the value of the equity beta today. The entire law of motion is then just the full set of conditional densities, one for each possible value of the current equity beta.
The conditional densities are obtained by using the standard kernel density estimation techniques described in Silverman (1986). First, the bivariate density of (βit,βit+k) is estimated where k is the number of months taken for a single transition from one value of beta to another. The marginal density of βit can then be obtained by integrating out βit+k from the joint density. Next, the densities of βit+k conditional on a particular value of βit can be computed by dividing the joint density at (βit,βit+k) by the value of the marginal density at the chosen value of βit. Obtaining this conditional density of the next period's equity beta, for each possible value of the current equity beta, yields the desired law of motion.[5]
A substantial complication arises in estimating the bivariate densities for the current and future equity betas because of the possibility that firms get delisted. Before presenting the estimated laws of motion, the method for handling firms that get delisted must be understood. This complication is discussed below.
4.2 Delisting: The Absorbing State
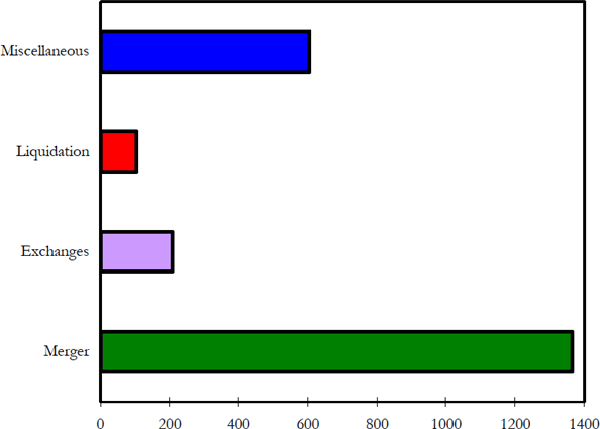
Firms are delisted for a variety of reasons. These reasons include:
- merger with another company;
- share issue exchanged for share issue trading elsewhere;
- liquidation of the firm; and
- being dropped from the exchange for a variety of reasons, generally with a high probability of management upheaval.
Figure 8 shows the number of observed delisting in each category.
In all cases, the delisting marks the end of equity return observations from which betas can be estimated. This means that, given the current beta, the firm can either have an equity beta in the next period or be delisted. The possibility of being delisted adds an extra element to the distribution of possible outcomes for the firm in the next period. Because this extra element is discrete, special care must be taken in estimating the laws of motion for equity betas because the kernel density estimation techniques are only useful for distributions with continuous support.
The potential that firms get delisted means that the bivariate density must be constructed from two components. First, the joint density is estimated using all of the observations for which firms are not delisted. Second, the density of current equity betas is estimated for all firms that are delisted in the next period. The mass in each these two densities is then scaled by the number of observations used in their construction relative to the total number of observations available to ensure that full joint density, taking into account the possibility of being delisted, integrates to unity.
4.3 The Laws of Motion
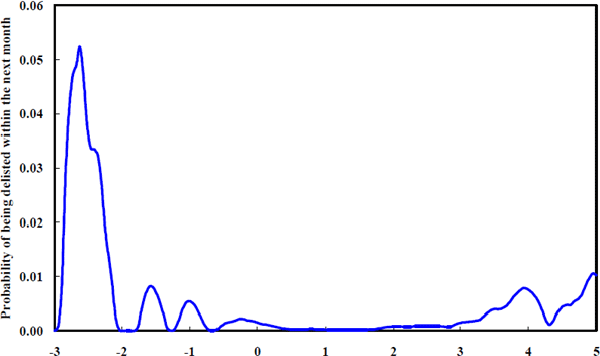
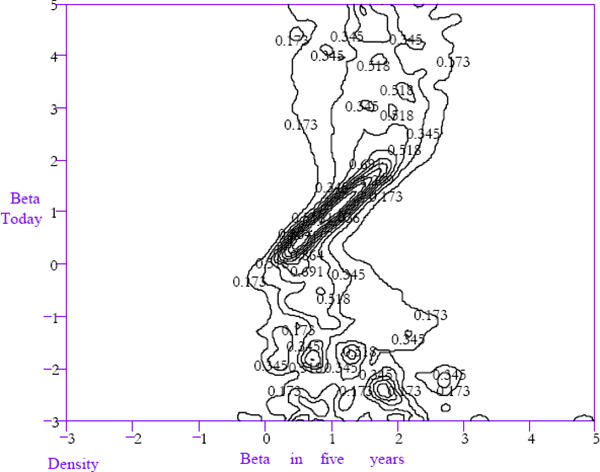
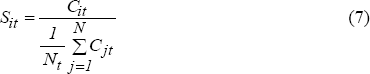
The one-month-ahead law of motion, for firms that are not delisted, is shown in Figure 9. It is represented using a contour plot where the contours are numbered to indicate their height (three dimensional surfaces fail to represent these functions informatively because of their extreme slope in some regions). In most figures, the shape of the function will be a diagonal peak running from lower left to upper right. The one-month-ahead law of motion, for firms that are delisted in the next period has been graphed separately in Figure 10. Figures 9 and 10 together describe the full law of motion.
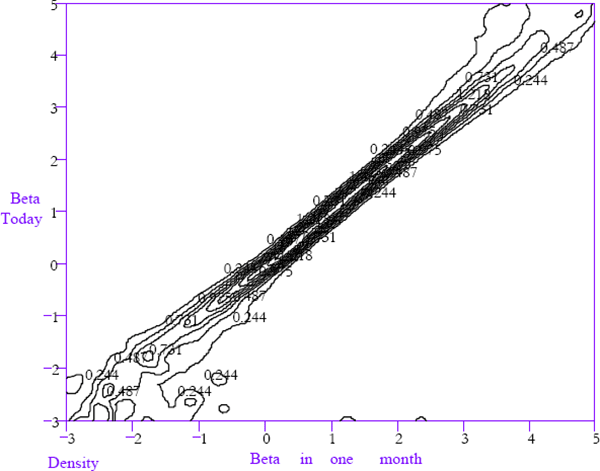
If the evolution of equity betas is not dependent upon the current beta then any horizontal cross-section taken through Figure 9 for a given current value of beta would look identical to each other. A vertical ridge running down Figure 9 with a peak on unity would be an extreme example of convergence, with the beta in one month's time being unrelated to the beta today. A ridge along the 45° line from lower left to the upper right would indicate no convergence.
The law of motion depicted in Figure 9 is much closer to the latter characterisation with the main feature being a ridge along the 45° line. However, the contour lines do exhibit some skewness in the conditional densities of equity betas next month for firms with extreme equity betas today.
For example, consider a firm with a beta of 3 today. Then, reading horizontally across the contour plot from 3 on the vertical axis suggests that the probability density for that firm's beta next month is negatively skewed, toward unity. This can be inferred from the fact that the contour lines are wider apart on the left of the ridge running diagonally across Figure 9 in the vicinity of the beta equals 3 horizontal cross-section. This evidence is consistent with beta convergence toward unity. This is because extreme betas today imply a greater probability of less extreme betas next month compared to the probability that the beta next month will be more extreme.
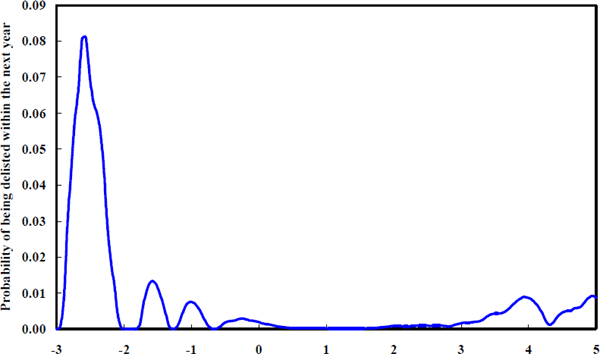
Figure 10, showing the probability of being delisted within the next month conditioned on today's equity beta, underpins the claim that firms with more extreme betas have a higher probability of being delisted in the near future. Although the risk associated with betas below unity is greater, the U-shape of this component of the law of motion is clear even within the more typical beta range, 0–2.
Assuming that delistings are detrimental to management because of the potential loss of incumbency, Blume's (1975, p. 794) conclusion that ‘part of this observed regression tendency represented real nonstationarities in the betas of individual securities’ may well have a substantive underpinning. Managers may be driving the beta of their firm toward unity in an effort to reduce the probability of delisting. The evidence in this paper goes further than Blume who was unable to identify potential driving forces behind the convergence of systematic risk characteristics. Figure 10 embodies a motive for this observed convergence behaviour.
Note also that, even though the risk of delisting is small, this is the risk of being delisted over a very short time horizon. The U-shaped relationship between betas and the risk of delisting is made more remarkable by recognising that most firms rapidly shift their beta back towards unity. By reacting to the risk of being delisted, firms increase the expected time to delisting, conditional upon the current beta. If firms did not react endogenously to their betas, the fraction of firms being delisted from the extreme beta states would be considerably greater.
The skewness of next period's conditional equity beta density for extreme current equity betas manifests itself as a pair of kinks in the ridge running along the 45° line in the laws of motion. The more sharply kinked the ridge becomes for extreme current betas, the more powerful the tendency toward convergence.
The kinks indicating convergence tendencies are much more prominent in the one and five-year-ahead laws of motion shown in Figures 11 and 13. These components of the laws of motion have been estimated directly from the data rather than by iterating forward the one-month law of motion to determine the conditional densities of future betas after undergoing the transitions implied by the one-month law of motion. This has been done because of a bias in the estimation of the laws of motion for betas currently in the vicinity of unity. The mobility of betas near unity is very low, as indicated by the fact that the ridge in the law of motion is nearly degenerate between 0.5 and 1.5. The bias arises from the fact that a fixed window width is used when estimating the bivariate density functions for current and future equity betas. There is a trade-off between using a window width wide enough to give an informative characterisation of the relatively diffuse densities for extreme betas and using a window width narrow enough to accurately represent the near degenerate density for betas near to unity. A consequence of this bias is that iteratively applying the laws of motion gives a misleadingly rapid adjustment rate.
Conditioning on firms that are not delisted in the next period
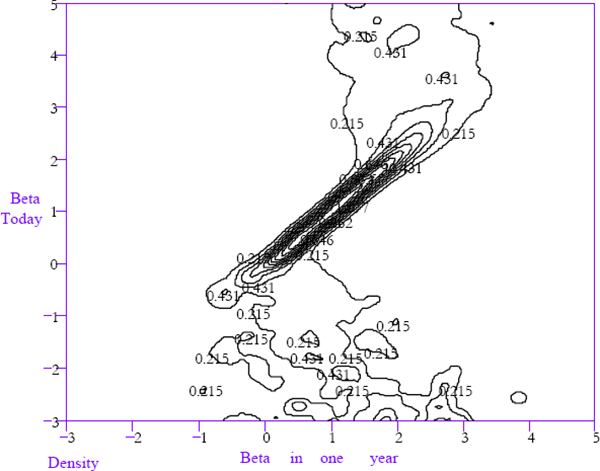
In both of these laws of motion, there continues to be high persistence for betas near unity and very low persistence for more extreme betas. Outside the 0–2 range for beta today, there is almost no persistence evident over a 5-year time horizon. This is powerful evidence of beta convergence, despite the lack of a formal statistical test against the null hypothesis that the conditional beta densities of extreme betas are not skewed toward unity.
Finally, note that Figures 12 and 14 confirm the U-shaped relationship between equity betas and the probability of being delisted in the next period.
4.4 The Ergodic Beta Density
As a secondary check on the density dynamics described above, it is possible to estimate the ergodic density of equity betas across firms from the law of motion. The ergodic density can be interpreted as the long-run cross-sectional density of betas that would obtain if the estimated law of motion were the true law of motion. It is constructed by iteratively applying the one-step-ahead law of motion to obtain the infinite step ahead law of motion. Under certain regularity conditions on the estimated law of motion, this iterative process converges such that the conditional density of the infinite step ahead equity beta is independent of the current equity beta. This conditional density is the ergodic density. If this ergodic density is similar to the sample density of betas, then the ergodic density provides corollary evidence that the density dynamics, described in the previous subsection, are a reasonable characterisation of publicly listed firms' equity returns.
To generate the ergodic density, assumptions must be made regarding the betas of newly listed firms because the laws of motion include a probability that firms get delisted. According to the estimated law of motion, some mass of firms becomes delisted in each period. Without introducing new firms to offset those that are delisted, the probability mass of listed firms would dwindle to zero and the ergodic density would just indicate that all firms end up being delisted which is uninformative. To replace the mass of firms that get delisted with every iteration of the law of motion several assumptions need to be made. Specifically, it is assumed that:
- new firms exactly replace old firms so that the total number of firms is unaltered; and
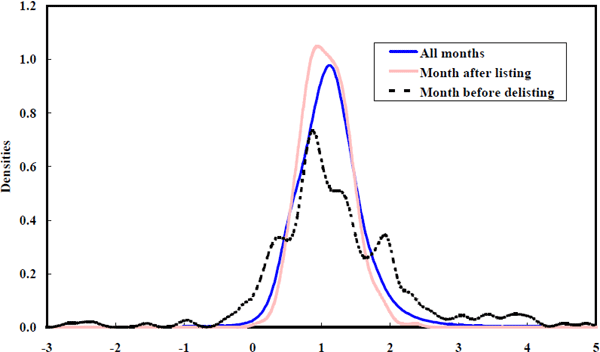
- the betas of new firms are drawn from the empirical density of equity betas for newly listed firms shown below.
Note that the probability density is slightly tighter around unity for newly listed firms (Figure 15). This is an artefact of the tight prior around unity imposed on the beta state vector at time zero in the estimation process. This result is reversed if a diffuse prior is used. Imposing the artificially tight prior strengthens the empirical evidence for beta convergence, given that betas are held artificially close to unity at the beginning of the sample. Without beta convergence being a feature of the data, this mild bias imposed on the initial betas would generate a finding of beta divergence. Also note that the density of betas for firms just prior to delisting (also shown in Figure 15) is more diffuse than the equity beta density estimated using all available data. This is the feature in the data driving the U-shaped probabilities of delisting conditioned on beta, shown in the laws of motion.
Thus, the ergodic density is estimated by iterative application of the one-month-ahead law of motion, augmented by the equity beta density of newly listed firms. This procedure yields the estimated ergodic beta density in Figure 16.
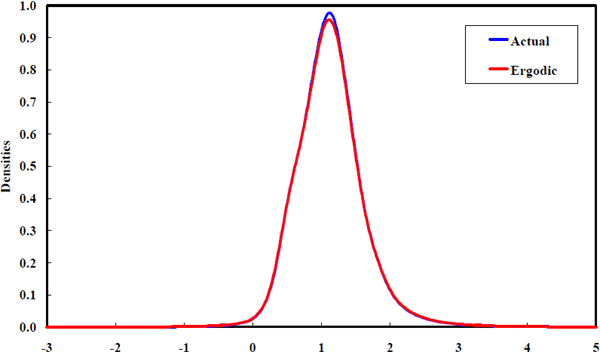
This estimated steady-state suggests that the density of betas is unimodal and highly concentrated around unity. This pattern is very similar to the prior density suggested by Vasicek (1973) and it closely matches the empirical density of equity betas obtained by Fama and French (1992) using quite different estimation techniques. These similarities represent corollary evidence that the equity beta estimation methods used in this paper are not capturing a substantially different aspect of equity return behaviour to that captured in the previous literature. It is also confirmatory to observe that the limiting density predicted by the estimated laws of motion is almost exactly the same as the observed cross-section density. It is clear that the forces for convergence do not collapse the cross-section density to a mass point at unity. Instead, the convergence tendency is offset by shocks to existing firms and by the listing of new firms.
What can be inferred from the estimated laws of motion for equity return betas? Clearly, the equity beta convergence found by Blume (1975) is strongly supported. The laws of motion also suggest a quite robust relationship between betas and the risk of being delisted in the near future. The remainder of this section explores some more obvious relationships between equity betas and characteristics of firms that further emphasise that equity beta convergence is not a statistical artefact caused by measurement error.
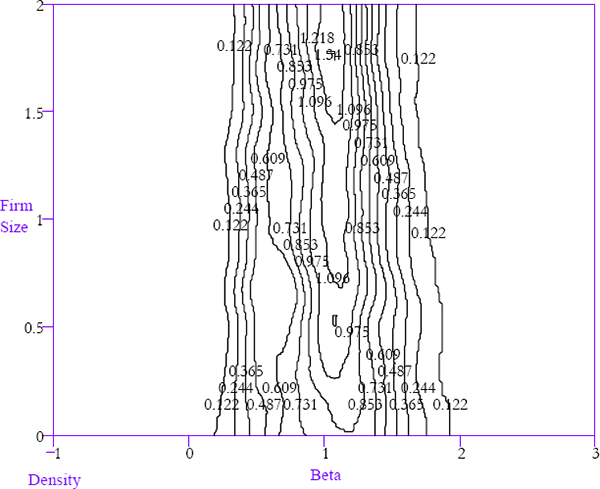
4.5 Firm Size and Betas
In the same way that the density of next period's beta can be computed, conditional on the current beta, densities of current betas can be estimated, conditioning on firm size. As in Banz (1981), firm size is measured as the market capitalisation of a firm in period t relative to the average market capitalisation of all NYSE listed firms in period t.
where Sit is firm i's size in period t and Cit is the firm's market capitalisation and Nt is the total number of firms in existence in period t. This normalisation of market capitalisation means that firm sizes are directly comparable across the time dimension, unlike the logarithmic transformation to market capitalisation applied in Chan and Chen (1988) and Fama and French (1992).
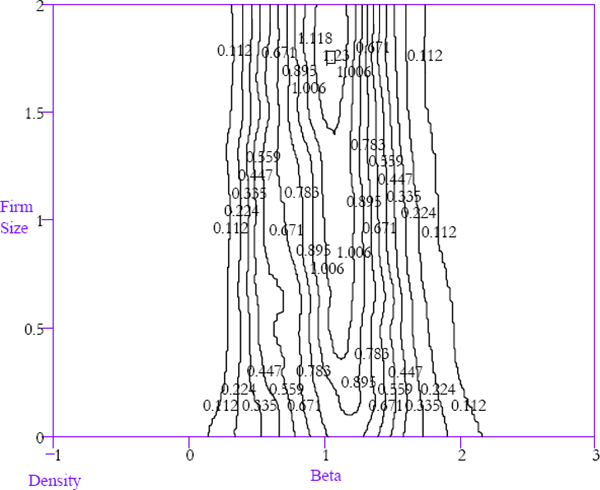
Figure 17 shows that larger firms have a tighter density of equity betas around unity. The key feature in Figure 17 is the contrast between the conditional equity beta density for large firms and the conditional equity beta density for small firms. This contrast is very clear in the comparison of the conditional densities for firms that are 25 per cent of average firm size and 175 per cent of average firm size (Figure 18).
The window width is 0.05 for firm size
The relationship between equity betas and firm size will be partly driven by the process of extreme beta firms self-selecting themselves out of the sample by being delisted with a higher probability. Indeed, the relationship appears to be driven largely by the adjustment of newly listed firms. Figure 19 is constructed in the same way as Figure 17 using just observations occurring five or more years after the initial listing of a corporation. Therefore, it only captures the beta/firm size relationship for relatively mature firms. While there is still some tendency for the beta density to be more concentrated for larger firms, the differences are smaller than in the case where data on immature firms is included.
(Mature Firms Sub-sample)
The window width is 0.05 for firm size
The regularity between systematic risk and firm size appears, at first glance, to be contrary to the evidence in Banz (1981), Chan and Chen (1988), Fama and French (1992), and others, all of whom find that firm size and systematic risk are strongly negatively correlated. Chan and Chen (Table I, p. 316 and Table II, p. 317) report a correlation between beta and firm size in excess of −0.9. Fama and French (Table I, Panel B, p. 435) document a similarly strong negative relationship. In Figure 17, however, the dominant regularity is that firm size is negatively related to the dispersion of equity betas around unity. A negative relationship seems, at first glance, quite dissimilar to a collapsing density of equity betas around unity.
How do the findings reconcile? The observed negative correlation can be explained by considering Figure 18. The cross-section equity beta density of the smaller firms has a slightly higher modal value than that for the larger firms. More importantly, however, the density for the small firms has a thick upper tail. This positive skew is substantially reduced for the larger firms. In combination, the modal shift and reduced skew explain the negative correlation. The strength of the negative correlation arises from the portfolio formation techniques used in the previous studies which disguise variation across betas. Consequently, these studies downplay the dominant feature of the data which is the reduction in the spread of the equity beta density for larger firms.
To what extent is this relationship between the concentration of the beta density and the size of firms driven by adjustment of firms as they age? The next subsection explores this issue by conditioning beta densities on the time since firms first listed on the NYSE.
4.6 Firm Age and Betas
This paper uses the number of months between the initial listing of a firm and the current return observation as a measure of age. Firms that were already listed before the first period of the sample are omitted in this section of the analysis. Having established that larger firms tend to have betas near unity, it is reassuring to observe in Figure 20 that more established firms (ones that have been listed for longer) exhibit the same patterns. This is evidenced by the higher peak (reduced dispersion) in the horizontal cross-sections for older firms. To the extent that older firms are generally also larger firms, this evidence matches that of the previous subsection.
The window width is 20 for firm age (measured in months)
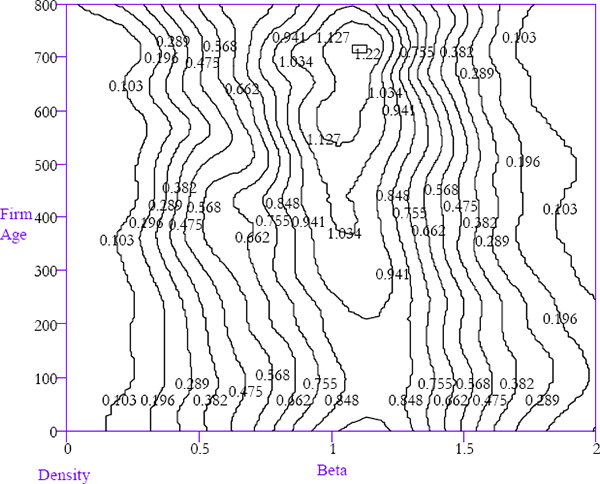
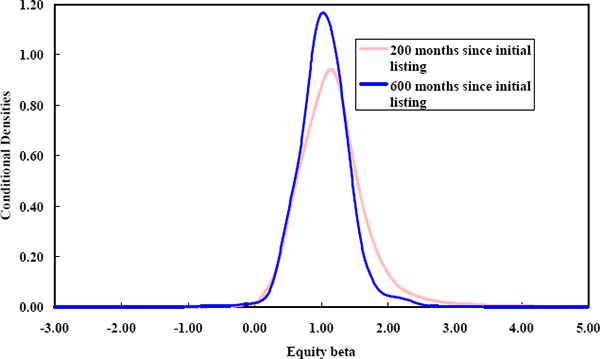
The horizontal axis, representing equity betas, has been restricted to the range 0–2 to increase the informativeness of the contours. As with the relationship between equity betas and firm size, the conditional density spreads fall as the age of firms rises. This is clearly seen in the comparison of two conditional densities in Figure 21.
The approximation involved in the measurement of firm age since listing ignores the fact that many firms have a long and successful existence prior to listing. Without this measurement error less firms would be measured as being young when in fact they are mature. By wrongly classifying such firms, the density of equity betas for ‘young’ firms will be made more concentrated than it actually is. Thus, the measurement error reduces the extent to which the relationship between the dispersions of betas and the age of firms is apparent in the data.
The evidence in Figure 21 is not as convincing as that relating equity betas to firm size because a greater fraction of observations on older firms occur in the latter part of the sample. This is also the part of the sample that has the lowest measurement errors in betas, based on the standard error density functions shown in Figure 7. This, reduces the variance of cross-sectional densities of betas for older firms compared to beta densities for younger firms. However, because the differences in measurement error across time periods are quite small, it is unlikely that the fairly pronounced relationship in Figure 21 is entirely spurious.
For the youngest firms, the cross-section beta density is more concentrated than for slightly older firms. This is a reflection of the artificially tight priors imposed on betas in the estimation procedure. The fact that the data works against this artificially tight prior for young firms supports the view that the relationship between beta dispersion and firm age is not driven by measurement error issues.
Footnote
As in the univariate case, the window width needs to be selected when estimating the bivariate density. In the most general case for bivariate densities, the window width is defined by a 2×2 smoothing matrix. For most applications, only the diagonal elements of this smoothing matrix need be non-zero. Following standard practice, the smoothing matrix is diagonal for the density estimates presented below. The diagonal elements of the smoothing matrix determine the amount of smoothing across the two dimensions of the data. Again, the window widths have been chosen subjectively following the recommendations of Silverman when estimating densities for purposes of visual inspection. [5]