RDP 9513: Asset-price Bubbles and Monetary Policy 2. Financial Market Volatility – Some Facts
December 1995
- Download the Paper 171KB
2.1 The Bond Market
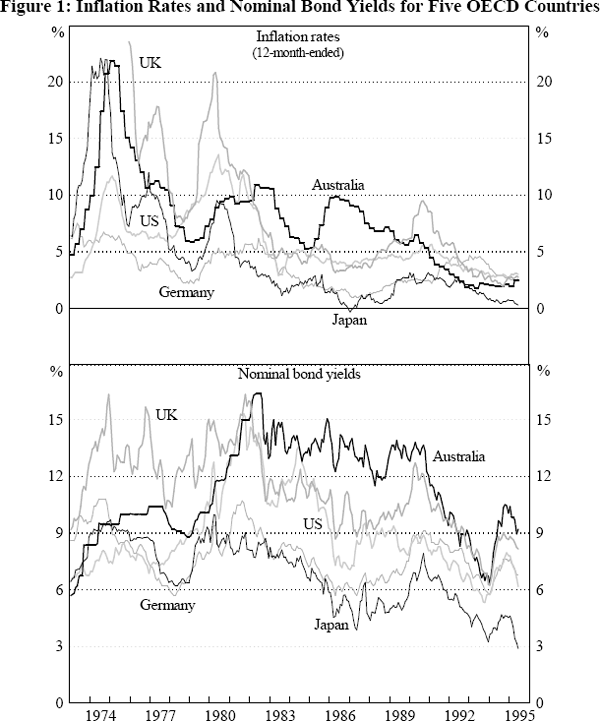
We set the scene for a discussion of volatility by examining the relationship between the level of inflation and the level of nominal bond yields. The upper panel of Figure 1 shows 12-month-ended inflation rates for five OECD countries since the early 1970s. After the inflationary boom of the 1970s, inflation in all these countries declined in the 1980s and fell further into the 1990s. The lower panel of Figure 1 shows nominal long bond yields for these five countries over the same time period. Although the relationship between inflation and nominal bond yields is not always close, the figure suggests that nominal bond yields fell along with inflation over the course of the 1980s and into the 1990s.
As well as relying on visual evidence, we can also formalise the relationship between
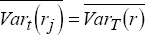
bond yields and inflation. For country j, we decompose the nominal bond yield, nj, into
the expected real yield, rj, and expected
inflation,
 :
[1]
:
[1]

It follows that the average nominal bond yield over a period of time,
 ,
is given by:
,
is given by:

and the change in average nominal bond yields between two periods,
 ,
is given by:
,
is given by:

We now make two assumptions to enable equations (2) and (3) to be estimated. Firstly,
we assume that capital mobility between countries is sufficiently high that
average real interest rates are approximately equalised across countries. Then,
 is the average world real interest
rate in the period and
is the average world real interest
rate in the period and
 is the change in the average world
real interest rate between two periods. Secondly, we assume that average past
inflation is a good proxy for expected future
inflation.[2]
These two assumptions lead to the following regression equations:
is the change in the average world
real interest rate between two periods. Secondly, we assume that average past
inflation is a good proxy for expected future
inflation.[2]
These two assumptions lead to the following regression equations:
where
 and
and
 are the average inflation rate in a
period and the change in the average inflation rate between two periods.
are the average inflation rate in a
period and the change in the average inflation rate between two periods.
We now divide our time period into three sub-periods of roughly equal length, 1973–80, 1981–87 and 1988–95, and expand our sample to fourteen OECD countries. Table 1 shows the result of estimating equation (4) for these fourteen countries, both in levels form for the three time periods, and in difference form, between the first and second periods, and the second and third periods.
Levels |
Differences |
|||||
|---|---|---|---|---|---|---|
| α | β | R2 | α | β | R2 | |
| 1973–80 | 5.85** (1.91) |
0.41** (0.17) |
0.33 |
– |
– |
– |
| 1981–87 | 6.89** (0.91) |
0.74** (0.12) |
0.77 |
3.91** (1.01) |
0.54** (0.23) |
0.31 |
| 1988–95 | 4.26** (1.24) |
1.40** (0.35) |
0.57 |
−1.69** (0.46) |
0.39** (0.10) |
0.55 |
| Notes: (a) Standard errors are presented in parentheses below the coefficient
estimates. (b) **,* indicate that coefficients are significantly different from zero at 5 per cent and 10 per cent, respectively. (c) The regressions are over 14 countries: Australia, Belgium, Canada, Denmark, Finland, France, Germany, Ireland, Italy, Japan, New Zealand, Norway, UK, US. (d) Data for the UK starts in January 1976. |
||||||
Over each seven year period, the average inflation rate explains a sizeable part of the cross-country variation in average nominal bond yields, and the change in average inflation from one period to the next explains much of the variation in the change in average bond yields. Furthermore, each estimate of β, the coefficient on average inflation or the change in average inflation, is of the expected positive sign and highly significant.
It also seems that nominal bonds yields have become more sensitive over time to the average level of inflation.[3] Be that as it may, the results overall are strongly supportive of the simple economic idea that the level of inflation is a key explanator of the level of nominal bond yields.
As a simple test of the robustness of these results, we repeat the regression analysis excluding from the sample two countries (Italy and New Zealand) with high inflation over much of the period. The results when these countries are excluded are reported in Table 2. There is minimal difference between the two tables suggesting that the original results do not simply arise from the anomalous behaviour of a couple of high-inflation countries. Of course, none of this should come as a surprise. It is very much part of received economic wisdom that inflation is a key determinant of nominal bond yields.
| Levels |
Differences |
|||||
|---|---|---|---|---|---|---|
| α | β | R2 | α | β | R2 | |
| 1973–80 | 4.68* (2.13) |
0.55** (0.21) |
0.43 |
– |
– |
– |
| 1981–87 | 5.77** (0.98) |
0.94** (0.15) |
0.81 |
3.47** (1.04) |
0.53* (0.24) |
0.33 |
| 1988–95 | 4.88** (1.31) |
1.16** (0.38) |
0.48 |
−1.32** (0.48) |
0.56** (0.13) |
0.65 |
| Notes: (a) Standard errors are presented in parentheses below the coefficient
estimates. (b) **,* indicate that coefficients are significantly different from zero at 5 per cent and 10 per cent, respectively. (c) The regressions are over 12 countries: Australia, Belgium, Canada, Denmark, Finland, France, Germany, Ireland, Japan, Norway, UK, US. (d) Data for the UK start in January 1976. |
||||||
We now turn to the issue of central interest. Does the simple and strong crosscountry relationship between levels of inflation and nominal bond yields translate into a similar relationship between the variability, or volatility, of inflation and the volatility of bond yields?
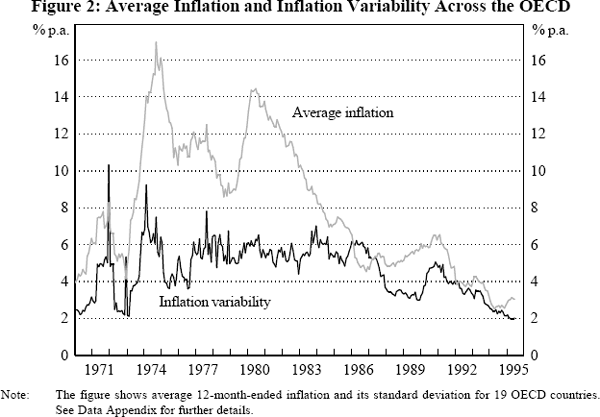
Figure 2 shows average inflation in 19 OECD countries as well as the standard deviation of inflation rates across these countries. Inflation in the 1990s is not only lower than in the previous two decades, it is also less variable, with the standard deviation of inflation across the 19 countries lower in 1995 than at any time in the past quarter of a century.
Importantly, this lower variability of inflation in the 1990s is evident not only across countries at a point in time, as shown in Figure 2, but also within individual countries over time. Table 3A shows inflation volatility (measured by an average of the standard deviation of 12-month-ended inflation rates) in fourteen OECD countries over the periods, 1973–87 and 1988–95. In all fourteen countries, inflation volatility is lower in the latter period than in the former.
| Inflation volatility | Percentage change | ||
|---|---|---|---|
| 1974–87 | 1988–95 | ||
| Germany | 0.39 | 0.28 | −28.6 |
| US | 0.80 | 0.22 | −73.0 |
| Australia | 1.23 | 0.62 | −49.6 |
| Japan | 1.19 | 0.33 | −72.8 |
| UK | 1.50 | 0.58 | −61.3 |
| Italy | 2.66 | 1.19 | −55.2 |
| France | 1.09 | 0.30 | −72.7 |
| Canada | 0.72 | 0.61 | −15.5 |
| Belgium | 1.55 | 0.68 | −56.0 |
| Denmark | 1.84 | 0.62 | −66.5 |
| Finland | 1.07 | 0.60 | −44.1 |
| Ireland | 2.08 | 0.45 | −78.4 |
| New Zealand | 1.67 | 1.11 | −33.5 |
| Norway | 0.96 | 0.56 | −41.9 |
| Note: Inflation volatility is the average, over each period, of 12-month-ended standard deviations of the 12-month-ended percentage change in consumer prices. In the first period, 12-month-ended standard deviations start in January 1974, except for the UK which starts in November 1976. | |||
Has this lower inflation volatility translated into less volatility of bond yields? Table 3B shows bond yield volatility (measured by an average of the standard deviation of monthly bond yields) for the same countries. For most countries, though not all, bond yield volatility has also declined over time. Somewhat disappointingly, the proportionate fall in bond yield volatility is usually much smaller than the fall in inflation volatility. In only a single country, Canada, was the percentage decline in bond yield volatility between the two periods larger than the decline in inflation volatility, while in three countries (Australia, Finland, and Norway) bond yield volatility was higher in the second period than in the first, despite falls in the volatility of inflation rates in each case greater than 40 per cent.
| Inflation volatility | Percentage change | ||
|---|---|---|---|
| 1974–87 | 1988–95 | ||
| Germany | 0.44 | 0.37 | −17.7 |
| US | 0.63 | 0.41 | −35.5 |
| Australia | 0.55 | 0.67 | 21.4 |
| Japan | 0.44 | 0.44 | −0.4 |
| UK | 0.86 | 0.53 | −38.1 |
| Italy | 0.81 | 0.70 | −14.1 |
| France | 0.59 | 0.45 | −23.3 |
| Canada | 0.60 | 0.45 | −25.1 |
| Belgium | 0.40 | 0.37 | −7.1 |
| Denmark | 1.03 | 0.58 | −43.4 |
| Finland | 0.43 | 0.76 | 75.3 |
| Ireland | 0.96 | 0.54 | −43.7 |
| New Zealand | 0.70 | 0.65 | −7.6 |
| Norway | 0.31 | 0.52 | 70.4 |
| Note: Bond yield volatility is the average, over each period, of 12-month-ended standard deviations of monthly bond yields. In the first period, 12-month-ended standard deviations start in January 1974, except for the UK which starts in November 1976. | |||
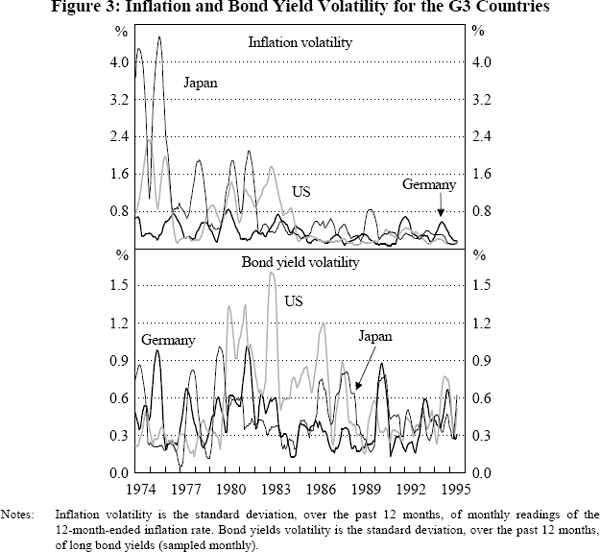
Visual evidence is also provided by Figure 3 which shows a two-panel figure for the G3 countries, with inflation volatility in the upper panel and bond yield volatility in the lower panel. Again, the fall in inflation volatility appears much more pronounced than the fall in the volatility of bond yields.
As before, we need not rely solely on visual evidence. We can also use the decomposition of the nominal bond yield into the expected real yield and expected inflation introduced earlier (equation (1)), to derive the relationship between the variance of nominal bond yields and the variances and covariance of the expected real yield and expected inflation:

where the notation VarT () means the variance evaluated over the past T months. As before, we take an average over time of equation (5) to give:

We make similar assumptions to those above, that
 and that
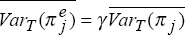 and also assume that the covariance
term is
constant.[4]
This again leads to an equation we can estimate:
and also assume that the covariance
term is
constant.[4]
This again leads to an equation we can estimate:

Equation (7) has a very simple interpretation. The average variance, over time, of nominal bond yields should be positively related to the average variance of inflation rates. We divide the time-period into three sub-periods, 1973–80, 1981–87 and 1988–95, and estimate equation (7) for the sample of fourteen OECD countries, both in levels for the three time periods, and in difference form between the first and second periods, and the second and third periods. Using two values for T, T = 12 months and T = 84 months (7 years), we report the results in Table 4.[5]
Levels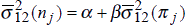 |
Differences |
|||||
|---|---|---|---|---|---|---|
| α | β | R2 | α | β | R2 | |
| 1973–80 | 0.24* (0.11) |
0.052** (0.018) |
0.41 |
– |
– |
– |
| 1981–87 | 0.35** (0.15) |
0.22** (0.067) |
0.48 |
0.37** (0.12) |
0.045* (0.025) |
0.22 |
| 1988–95 | 0.29** (0.057) |
0.13** (0.058) |
0.31 |
−0.070 (0.16) |
0.26** (0.11) |
0.34 |
Levels |
Differences |
|||||
| α | β | R2 | α | β | R2 | |
| 1973–80 | 1.88** (0.74) |
0.026 (0.038) |
0.04 |
– |
– |
– |
| 1981–87 | 3.40* (1.69) |
0.17 (0.098) |
0.20 |
3.13** (1.08) |
−0.04 (0.088) |
0.02 |
| 1988–95 | 0.83 (0.61) |
0.51** (0.17) |
0.43 |
−1.37 (1.72) |
0.19 (0.11) |
0.20 |
| Notes: (a) Standard errors are presented in parentheses below the coefficient
estimates. (b) The 12-month-ended variances are averages for the three sub-periods. For the first sub-period, the 12-month-ended variance starts in January 1974 with the exception of the UK which starts in November 1976. (c) 84 month variances are calculated over the periods: January 1974 to December 1980, July 1981 to June 1988, and July 1988 to June 1995. UK data starts in January 1976. (d) **,* indicate that coefficients are significantly different from zero at 5 per cent and 10 per cent, respectively. (e) The regressions are over 14 countries: Australia, Belgium, Canada, Denmark, Finland, France, Germany, Ireland, Italy, Japan, New Zealand, Norway, UK, US. |
||||||
With only a single exception, the parameter β is estimated to be positive, as expected. That is, higher inflation volatility is correlated with higher volatility of bond yields. Furthermore, β is statistically significant in many cases. Judged by the regression R2's of the equations, however, the explanatory power of equation (7) is usually much lower than the comparable cross-country relationship between the level of inflation and the level of nominal bond yields (equation (4)).
We again test the robustness of the results by eliminating Italy and New Zealand from the sample and repeating the regressions. The results are reported in Table 5. In contrast to the earlier case, leaving out these two countries does make a substantial difference to the results. Although the estimates of β continue to be positive in most cases, they are much less statistically significant. Furthermore, in many cases, the regressions have little explanatory power. This is suggestive of a threshold effect. When volatility is relatively low, there is little apparent relationship between the volatility of inflation and bond yields, while with higher volatility, the relationship appears stronger.
Levels |
Differences |
|||||
|---|---|---|---|---|---|---|
| α | β | R2 | α | β | R2 | |
| 1973–80 | 0.017 (0.12) |
0.12** (0.028) |
0.66 |
– |
– |
– |
| 1981–87 | 0.39* (0.19) |
0.18 (0.13) |
0.17 |
0.26* (0.12) |
0.046 (0.039) |
0.12 |
| 1988–95 | 0.21* (0.11) |
0.38 (0.29) |
0.14 |
−0.10 (0.18) |
0.20 (0.14) |
0.16 |
Levels |
Levels |
|||||
| α | β | R2 | α | β | R2 | |
| 1973–80 | 1.76** (0.50) |
−0.007 (0.032) |
0.004 |
– |
– |
– |
| 1981–87 | 3.49* (1.61) |
0.11 (0.10) |
0.11 |
3.18** (1.05) |
0.088 (0.098) |
0.07 |
| 1988–95 | 0.62 (0.48) |
0.58** (0.16) |
0.57 |
−1.29 (1.66) |
0.17 (0.11) |
0.19 |
| Notes: (a) Standard errors are presented in parentheses below the coefficient
estimates. (b) The 12-month-ended variances are averages for the three sub-periods. For the first sub-period, the 12-month-ended variance starts in January 1974 with the exception of the UK which starts in November 1976. (c) 84 month variances are calculated over the periods: January 1974 to December 1980, July 1981 to June 1988, and July 1988 to June 1995. UK data starts in January 1976. (d) **,* indicate that coefficients are significantly different from zero at 5 per cent and 10 per cent, respectively. (e) The regressions are over 12 countries: Australia, Belgium, Canada, Denmark, Finland, France, Germany, Ireland, Japan, Norway, UK, US. |
||||||
It is worth examining the empirical implications of these regression results. For
the 12 country regressions in
Table 5, there is only a single regression that generates a significant
estimate of β (namely the regression
 estimated over 1988–95). Using
this regression, a 50 per cent fall in the variance of inflation is estimated
to lead to a 34 per cent fall in the variance of bond
yields.[6]
This is, however, the largest predicted fall in the variance of bond yields
in the table. All the other estimates imply that halving the variance of inflation
leads to a much smaller fall in the variance of bond yields.
estimated over 1988–95). Using
this regression, a 50 per cent fall in the variance of inflation is estimated
to lead to a 34 per cent fall in the variance of bond
yields.[6]
This is, however, the largest predicted fall in the variance of bond yields
in the table. All the other estimates imply that halving the variance of inflation
leads to a much smaller fall in the variance of bond yields.
There is a theoretically-compelling reason to expect the elasticity of the variance of bond yields with respect to the variance of the inflation rate, εnπ, to be less than one. Any variation in expected real yields over time acts to reduce this elasticity.[7]
Nevertheless, the small apparent response of bond yield volatility to changes in inflation volatility should be disappointing to those who argue that volatile asset prices are primarily a consequence of volatile economic fundamentals. Furthermore, rationalising the small apparent response in terms of time-varying real yields is simply an admission of ignorance, since the time variation of expected real yields is unobservable.
To summarise, the evidence that countries with more volatile inflation rates also have more volatile bond yields is strongest when countries with very volatile inflation rates are included in the sample. When they are excluded, there is still some evidence that more volatile inflation rates generate more volatile bond yields. Consistent with this evidence, the fall in inflation volatility in most countries in the OECD has occurred at the same time as a (proportionately smaller) fall in bond yield volatility. However, it is also clear that the empirical relationship between the volatility of inflation and the volatility of nominal bond yields is much weaker than the relationship between the level of inflation and the level of bond yields.
2.2 The Foreign Exchange Market
We turn now to the foreign exchange market. Again, to set the scene for the discussion of volatility to follow, we begin with the relationship between the level of the exchange rate and the relative domestic and foreign price levels.
The theory of purchasing power parity (PPP) asserts that nominal exchange rates move to offset inflation differentials between countries. As is well known, for countries with moderate inflation rates, PPP provides almost no guidance for exchange rate movements over short periods: a month, a quarter or even a year. Over longer periods of time, however, it does provide some guide for exchange rate movements. We test PPP over the three sub-periods, 1973–80, 1981–87 and 1988–95, and over the time period as a whole, 1973–95. To do so, we run the regression:

where Δ%Ej is the percentage change in the j-th exchange rate from the beginning of the period to its end, Ej is the foreign currency price of a unit of domestic currency, and Δ%(Pf / Pd)j is the percentage change in the ratio of foreign to domestic consumer prices. The results of estimating equation (8) for five exchange rates are shown in Table 6.[8]
 |
|||
|---|---|---|---|
| α | β | R2 | |
| 1973–80 | −10.91 (16.21) |
0.03 (0.79) |
0.001 |
| 1981–87 | −8.9 (5.12) |
1.70** (0.40) |
0.86 |
| 1988–95 | 0.23 (7.03) |
1.96 (0.88) |
0.62 |
| 1973–95 | 18.08 (22.73) |
2.01* (0.76) |
0.70 |
| Note: The variables in the regression are calculated from the first to last month in each period. **,* indicate that coefficients are significantly different from zero at 5 per cent and 10 per cent, respectively. The regressions use 5 exchange rates and their corresponding price differentials: AUD/USD, USD/YEN, USD/DEM, GBP/USD, USD/CAD. Exchange rates and inflation differentials which include the UK start in December 1974. | |||
The equation has almost no explanatory power in the period immediately following OPEC I, 1973–80. It performs quite well, however, over the second and third time periods, 1981–87 and 1988–95. Over these sub-periods and over the period as a whole, 1973–95, β is insignificantly different from unity and the regressions explain a substantial part of the variation in exchange rate changes.
We turn now to exchange rate volatility. From the perspective of economic theory, it is the volatility of the inflation differential between two countries, rather than the volatility of inflation in either country on its own, that should be relevant to the volatility of the exchange rate between them. All exchange rate models predict that nominal shocks that have an effect on the inflation differential between two countries will also affect their bilateral exchange rate. We should also expect the link between the volatility of inflation differentials and exchange rate volatility to be a strong one. With sticky goods prices in each country, nominal shocks should have a disproportionate effect on exchange rate volatility, because asset market equilibrium requires the exchange rate to adjust more in the short run than in the long run (Dornbusch 1976). This effect is also strengthened because, given the inertia of the inflation process, a positive inflation shock implies not only a higher price level, but also a higher rate of inflation for some time into the future. With a forward-looking foreign exchange market, this again implies a disproportionate exchange rate response to inflation shocks (Lyons 1990).
As we have seen earlier in Figure 2, the variability of inflation rates across the OECD fell steadily in the 1990s, and by 1995 was lower than at any time in the past quarter of a century. Not surprisingly, this generalised decline in inflation variability is also manifest in a decline in the volatility of inflation differentials between many pairs of countries. Table 7 shows the volatility of inflation differentials for six country pairs. As the table shows, the volatility of the inflation differential for these six country pairs declines by between 40 and 70 per cent from 1973–87 to 1988–95. Table 7 also shows the volatility of the exchange rates for the same six country pairs. As is clear from the table, the pattern of exchange rate volatilities is markedly different from the pattern of inflation differential volatilities. By contrast with inflation differential volatilities, there is little systematic change in exchange rate volatilities from 1973–87 to 1988–95, with three exchange rates exhibiting a decline in average volatility and three experiencing a rise.
| Inflation differential volatilities | Percentage change | |||||
|---|---|---|---|---|---|---|
| 1973–80 | 1981–87 | 1988–95 | 1973–87 to 1988–95 | |||
| Australia/US | 1.2 | 1.2 | 0.7 | −44.4 | ||
| Australia/Japan | 2.0 | 1.0 | 0.7 | −52.4 | ||
| Australia/Germany | 1.5 | 0.9 | 0.7 | −42.3 | ||
| US/Japan | 1.6 | 0.7 | 0.4 | −69.3 | ||
| Germany/Japan | 1.7 | 0.7 | 0.4 | −63.1 | ||
| US/Germany | 0.9 | 0.7 | 0.4 | −54.2 | ||
| Exchange rate volatilities | Percentage change | |||||
| 1973–80 | 1981–87 | 1988–95 | 1973–87 to 1988–95 | |||
| AUD/USD | 2.3 | 2.9 | 2.5 | −1.8 | ||
| AUD/YEN | 3.4 | 3.7 | 3.9 | 9.6 | ||
| AUD/DEM | 3.5 | 3.6 | 4.3 | 21.0 | ||
| USD/YEN | 3.0 | 3.2 | 3.1 | −1.2 | ||
| DEM/YEN | 3.3 | 2.9 | 2.6 | −15.5 | ||
| USD/DEM | 3.3 | 3.2 | 3.3 | 2.2 | ||
| Note: Inflation differential volatility is the average, over each period, of 12-month-ended standard deviations of the difference between the respective countries' 12-month-ended percentage change in consumer prices. Exchange rate volatility is the average, over each period, of 12-month-ended standard deviations of monthly percentage changes in the exchange rate. In the first period, 12-month-ended standard deviations start in January 1974. | ||||||
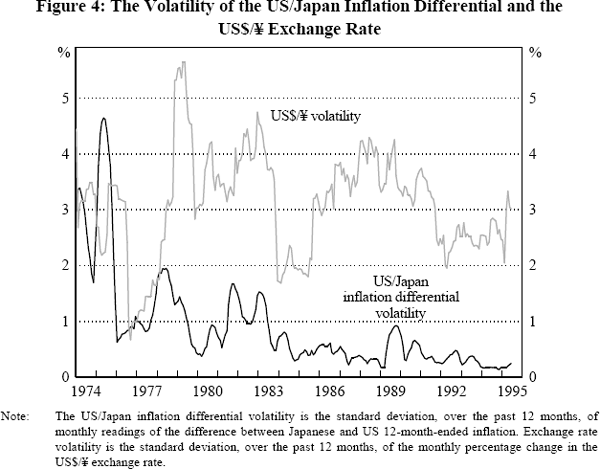
Figure 4 shows an equally striking example of the apparent lack of relationship between the volatility of the inflation differential and exchange rate volatility. Despite a huge fall in the volatility of the US/Japan inflation differential between the mid 1970s and the 1990s, there is no apparent change in the volatility of the US$/ ¥ exchange rate.
We can also test this conclusion with regression analysis. In Tables 8 and 9 we report the results of a range of regressions similar to those presented above for the bond market. In each regression a measure of exchange rate volatility is regressed on a measure of the volatility of the inflation differential between the relevant two countries. Using period averages over the same three time periods as before, we perform cross-exchange rate regressions over thirteen exchange rates.[9]
Levels |
Differences |
|||||
|---|---|---|---|---|---|---|
| α | β | R2 | α | β | R2 | |
| 1973–80 | 10.21** (1.67) |
0.42 (0.45) |
0.07 |
– |
– |
– |
| 1981–87 | 11.21** (1.71) |
0.08 (1.43) |
0.000 |
−0.10 (1.22) |
0.11 (0.44) |
0.005 |
| 1988–95 | 9.13** (2.62) |
6.12 (4.38) |
0.15 |
3.24* (1.53) |
3.74 (2.29) |
0.20 |
| 1973–95 | 9.53** (2.39) |
1.35 (1.36) |
0.08 |
– |
– |
– |
Levels |
Differences |
|||||
| α | β | R2 | α | β | R2 | |
| 1973–80 | 2.73** (0.41) |
0.26 (0.25) |
0.09 |
– |
– |
– |
| 1981–87 | 3.18** (0.41) |
0.01 (0.45) |
0.000 |
0.15 (0.17) |
0.16 (0.22) |
0.05 |
| 1988–95 | 2.66** (0.68) |
1.11 (1.06) |
0.09 |
−0.33** (0.07) |
−0.07 (0.09) |
0.06 |
| 1973–95 | 2.74** (0.66) |
0.51 (0.66) |
0.05 |
– |
– |
– |
| Notes: (a) Standard errors are presented in parentheses below the coefficient
estimates. **,* indicate that coefficients are significantly different
from zero at 5 per cent and 10 per cent, respectively. (b) In the upper panel, the average, over each period, of 12-month-ended variances of monthly exchange rate percentage changes is regressed on the average, over each period, of 12-month-ended variances of 12-month-ended inflation differentials, while in the lower panel, the average, over each period, of 12-month-ended standard deviations of monthly exchange rate percentage changes is regressed on the average, over each period, of 12-month-ended standard deviations of 12-month-ended inflation differentials. (c) The regressions use 13 exchange rates and their corresponding inflation differentials: AUD/USD, AUD/YEN, AUD/DEM, AUD/CAD, AUD/GBP, DEM/YEN, USD/YEN, CAD/YEN, GBP/YEN, USD/DEM, GBP/USD, CAD/DEM, GBP/CAD. (d) 12-month-ended variances (standard deviations) start in January 1974 with the exception of the UK which starts in November 1976. |
||||||
Levels |
Differences |
|||||
|---|---|---|---|---|---|---|
| α | β | R2 | α | β | R2 | |
| 1973–80 | 9.58** (1.15) |
0.10 (0.07) |
0.15 |
– |
– |
– |
| 1981–87 | 12.33** (1.56) |
0.06 (0.34) |
0.003 |
2.35* (1.31) |
0.07 (0.09) |
0.05 |
| 1988–95 | 8.57** (1.59) |
0.82** (0.34) |
0.34 |
−0.83 (0.70) |
0.33 (0.23) |
0.17 |
| 1973–95 | 9.37** (2.35) |
0.20 (0.20) |
0.09 |
– | – | – |
Levels |
Differences |
|||||
| α | β | R2 | α | β | R2 | |
| 1973–80 | 2.93** (0.30) |
0.10 (0.08) |
0.13 |
– |
– |
– |
| 1981–87 | 3.34** (0.37) |
0.10 (0.19) |
0.02 |
0.37* (0.20) |
0.08 (0.09) |
0.07 |
| 1988–95 | 2.67** (0.41) |
0.38* (0.21) |
0.24 |
−0.13 (0.10) |
0.25 (0.15) |
0.20 |
| 1973–95 | 2.77** (0.64) |
0.18 (0.19) |
0.08 |
– |
– |
– |
| Notes: (a) Standard errors are presented in parentheses below the coefficient
estimates. **,* indicate that coefficients are significantly different
from zero at 5 per cent and 10 per cent, respectively. (b) In the upper panel, the average variance, over the 84 months in each period, of monthly exchange rate percentage changes is regressed on the average variance, over the 84 months in each period, of 12-month-ended inflation differentials, while in the lower panel, the average standard deviation, over the 84 months in each period, of monthly exchange rate percentage changes is regressed on the average standard deviation, over the 84 months in each period, of 12-month-ended inflation differentials. (c) The regressions use 13 exchange rates and their corresponding inflation differentials: AUD/USD, AUD/YEN, AUD/DEM, AUD/CAD, AUD/GBP, DEM/YEN, USD/YEN, CAD/YEN, GBP/YEN, USD/DEM, GBP/USD, CAD/DEM, GBP/CAD. (d) The 84 month variances (standard deviations) are calculated over the periods: January 1974 to December 1980, July 1981 to June 1988, and July 1988 to June 1995. Exchange rates including the UK start in January 1976. |
||||||
Two things stand out from the results in the tables. Firstly, although the coefficient β is almost always of the expected positive sign – implying that higher exchange rate volatility is correlated with higher volatility of inflation differentials – it is almost always statistically insignificant. Secondly, since most of the regression R2's in the two tables are less than 0.1, very little of the cross-exchange rate variation in volatility is explained by variation in the volatility of the corresponding inflation differential.
As we did for bond market volatility, we can also examine the empirical implications
of these regression results. Of the regressions in the two tables, the regression
 estimated over 1988–95 generates
the most significant estimate of β. Using this regression, a 50 per cent
fall in the variance of the inflation differential between two countries is
estimated to lead to a 14 per cent fall in the variance of their bilateral
exchange
rate.[10]
Note however, both that this is quite a small estimated fall in exchange rate
variance, and that it is the largest predicted fall in the variance of the
exchange rate in the table. All the other estimates imply that halving the
variance of the inflation differential leads to a much smaller fall in the
variance of the corresponding exchange rate.
estimated over 1988–95 generates
the most significant estimate of β. Using this regression, a 50 per cent
fall in the variance of the inflation differential between two countries is
estimated to lead to a 14 per cent fall in the variance of their bilateral
exchange
rate.[10]
Note however, both that this is quite a small estimated fall in exchange rate
variance, and that it is the largest predicted fall in the variance of the
exchange rate in the table. All the other estimates imply that halving the
variance of the inflation differential leads to a much smaller fall in the
variance of the corresponding exchange rate.
We may summarise our results for the foreign exchange market as follows. Other things equal, economic theory predicts that a decline in the volatility of the inflation differential between countries should reduce the volatility of their bilateral exchange rates. With sticky goods prices in each country, this link between the volatilities of inflation differentials and exchange rates should be particularly strong. Empirically, however, for OECD countries with moderate inflation rates, there is little evidence that the volatility of inflation differentials helps explain exchange rate volatility. While inflation differences between countries that persist for several years make an important difference to the level of their bilateral exchange rates, differences in the volatility of inflation differentials for the same group of countries make little, if any, difference to their bilateral exchange rate volatilities. Similarly, the big fall in the volatility of the inflation differential between many pairs of countries in the late 1980s and 1990s has been associated with little, if any, systematic fall in the volatility of their bilateral exchange rates.
Footnotes
The equation can alternatively be thought of as defining the expected real interest
rate, rj, as rj ≡ nj
−
 .
[1]
.
[1]
This is quite a strong assumption, since at each point in time, the relevant measure of expected inflation is expected inflation over the future life of the bond, which we proxy by actual inflation over the past 12 months. Clearly, the longer the period of time over which averaging is performed, the better this assumption should be. [2]
The market for government long bonds in many countries was subject to substantial regulation in the 1970s and early 1980s which may help to explain the weaker relationship between bond yields and inflation in the earlier periods. See Bröker (1993) for further details. [3]
The assumption that
 can be justified in the simple
case when inflation in each country follows a stationary AR(1) process, πt
= ρπt−1 +
can be justified in the simple
case when inflation in each country follows a stationary AR(1) process, πt
= ρπt−1 +
 , ρ < 1, where
is the shock at time t
specific to country j. For N-period bonds, assuming inflationary
expectations over the life of the bond are rational,
at time-t is given by
= Et (πt+1+…+πt+N)
/ N. It is straightforward to show that Etπt+k
= ρk πt, and hence that
= (ρ + ρ2+…+ρN)π
t / N = δπt
where δ
< 1. Taking unconditional variances of both sides gives Var(
) = γ Var(πj)
where γ =
δ2 < 1 and Var(πj)
is the unconditional variance of actual inflation in country j.
[4]
, ρ < 1, where
is the shock at time t
specific to country j. For N-period bonds, assuming inflationary
expectations over the life of the bond are rational,
at time-t is given by
= Et (πt+1+…+πt+N)
/ N. It is straightforward to show that Etπt+k
= ρk πt, and hence that
= (ρ + ρ2+…+ρN)π
t / N = δπt
where δ
< 1. Taking unconditional variances of both sides gives Var(
) = γ Var(πj)
where γ =
δ2 < 1 and Var(πj)
is the unconditional variance of actual inflation in country j.
[4]
Using T = 12 months generates an average over the sample of the variance
within a year,
while T = 84
months generates the average variance over the sample. Both approaches generate a
consistent estimate of the population variance for a stationary stochastic
variable with no autocorrelation. T = 12 months implies
that, each month, we calculate the 12-month-ended variances of nj,
the nominal bond rate (sampled monthly) and of πj,
which is itself the 12-month-ended inflation rate. These 12-month-ended variances
are then averaged over the seven-year sample to generate
 and
and
 . Alternatively, using
T = 84 months (7
years) implies that the 84 month variances of nominal interest rates (sampled monthly),
Var84(nj), and of the 12-month-ended
inflation rate, Var84(πj), are
calculated directly for each sample. The reason for calculating the variance
of 12-month-ended inflation rates, rather than, for example, the variance
of monthly inflation rates, is to deal with the possibility of seasonality
in the inflation rate of some countries, which will raise the variance of
monthly inflation rates even when underlying inflation is no more variable.
Calculating the variance of 12-month-ended inflation rates eliminates this
problem.
[5]
. Alternatively, using
T = 84 months (7
years) implies that the 84 month variances of nominal interest rates (sampled monthly),
Var84(nj), and of the 12-month-ended
inflation rate, Var84(πj), are
calculated directly for each sample. The reason for calculating the variance
of 12-month-ended inflation rates, rather than, for example, the variance
of monthly inflation rates, is to deal with the possibility of seasonality
in the inflation rate of some countries, which will raise the variance of
monthly inflation rates even when underlying inflation is no more variable.
Calculating the variance of 12-month-ended inflation rates eliminates this
problem.
[5]
This estimate is evaluated at the average, over the 12 countries, of the variance of inflation. [6]
From equation (6), it follows that
 , with obvious notation. Provided
 , which seems likely, the elasticity
must be less than one, and falls as
, which seems likely, the elasticity
must be less than one, and falls as
 (rj) rises.
[7]
(rj) rises.
[7]
We restrict the sample to five independent exchange rates, because adding cross-rates to the regression does not add any new information. Thus, for example, for countries A, B, and C, the monthly percentage change in exchange rate AC is (approximately) equal to the sum of the monthly percentage changes in exchange rates AB and BC. The majority of exchange rates used for the regressions floated throughout the period 1973–95. The Australian dollar, however, although fairly flexible, was not floated until 1983. Thus, when the Bretton-Woods system broke down in 1973, Australia maintained its peg to the US$. By 1974, the peg was changed to one with a basket of currencies. This system again changed in 1976, and from then until 1983, the Australian dollar was on a crawling peg (adjusted daily) against the US$. [8]
The thirteen exchange rates include the independent exchange rates used for Table 6 (with the exception of the USD/CAD – excluded because, in terms of volatility, it appears to be a special case, perhaps because of the overwhelming role of the US in Canadian trade) plus several cross-rates. Cross-rates may be included in the regression for the following reason. While the monthly percentage change in exchange rate AC is (approximately) equal to the sum of the monthly percentage changes in exchange rates AB and BC, the same statement is not true for the variance of monthly percentage changes, because there is also a covariance term. As a consequence, including cross-rates in the regression adds new information. [9]
This estimate is evaluated at the average, across the 13 country pairs, of the variance of inflation differentials. As before, given the form of the regression equation, the estimated elasticity of the variance of monthly exchange rate changes with respect to the variance of the inflation differential should be less than unity. Recall that using a similar methodology in the bond market, a 50 per cent fall in the variance of inflation is estimated to lead to a 34 per cent decline in the variance of bond yields. [10]