RDP 9213: The Impact of Financial Intermediaries on Resource Allocation and Economic Growth 4. The Australian Experience
December 1992
- Download the Paper 700KB
Australia's financial system has undergone a significant transformation over the last decade. It has moved from being from a system dominated by directed lending, quantity controls and interest rate ceilings to a freely functioning market system. This section explores some of the implications of these changes. It begins with a brief review of the nature and rationale of the previously existing regulations and summarises the changes that have taken place over recent years.
4.1 History of Regulation
The system of regulation that governed the operation of Australian financial intermediaries grew out of the need for the government to control the allocation of financial resources during World War II. In the years following the end of the war, this rationale no longer remained, yet the regulation continued. While this reflected a number of factors (see Grenville (1991)), the principal reason was that regulation of financial intermediaries was seen as an effective method of controlling the business cycle[6]. It was thought that control of the growth rate of nominal demand could best be achieved through direct control over the growth rate of bank advances.
The regulations took a variety of forms. There were both qualitative and quantitative lending directives. During certain periods, limits were imposed on the overall rate of growth of bank balance sheets. Banks were also directed to lend primarily for trade finance and not for long term business investment. There were ceilings on bank deposit and loan interest rates and there were limits on the maturity of interest-bearing deposits that banks could offer their customers. Control was also exercised over bank entry and there were restrictions on the portfolio allocation of banks' balance sheets. These portfolio restrictions, together with directives concerning lending growth, were the principal tools of monetary policy. Finally, the exchange rate was “managed” and there were extensive foreign exchange controls.
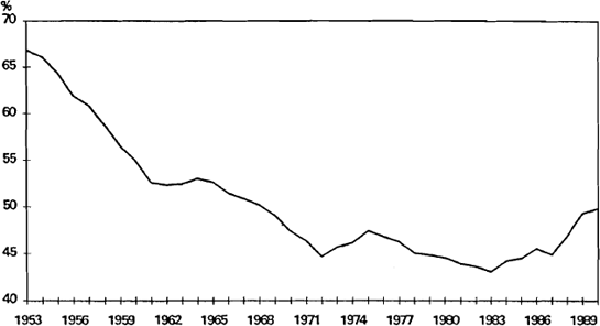
The evolution of these regulations and their implications for the effectiveness of monetary policy are discussed in considerable detail in Grenville (1991), Valentine (1991) and Harper (1991). These papers highlight the fact that the controls on the banking sector led to the establishment of non-bank financial institutions. These institutions were subject to fewer regulations than banks and their balance sheets grew much faster than those of the banks. Graph 1 shows that over the period of regulation there was a gradual downward trend in the banks' share of the total assets of financial intermediaries. The growth of non-bank financial intermediaries meant that the monetary policy based on controlling the balance sheets of only the banks became increasingly ineffective. This led to a gradual movement in the first half of the 1970s away from direct controls towards a more market based monetary policy.
The move to a market based system was, however, not without its problems. With an essentially fixed exchange rate and the economy becoming increasingly integrated into world capital markets, the scope for independent market based monetary policy was restricted. As Grenville (1991) notes, attempts to tighten policy by selling bonds were frustrated by the inflow of foreign capital. While various schemes were implemented to slow the inflow of capital, they only provided temporary breathing space. The problems continued to grow as Australia became more integrated into world markets. These difficulties prompted a partial return to direct controls in the second half of the 1970s. Perhaps predictably, this policy met with only limited success and had a relatively short life. In the first half of the 1980s, the exchange rate was floated, all interest rate controls were removed and credit directives ceased.
The seriousness with which Australian governments have viewed the importance of financial markets is reflected in the three commissioned studies into the operation of the financial system over the last one and a half decades. In 1979, with concern growing over the effectiveness of the existing regulations with regard to both resource allocation and monetary policy, the government commissioned a wide ranging study of the financial system. This report (Australian Financial System Inquiry (1981)), became known as the “Campbell Report”. It was followed in 1984 by a second study (Australian Financial System Review Group (1984)). Finally, a third report (Parliament of the Commonwealth of Australia (1991)), commonly referred to as the “Martin Inquiry”, was commissioned in 1990. Unlike the first two reports, which were concerned with the effects of regulation, this third report assessed the effects of deregulation and the extent of bank competition.
4.2 Impact of Regulation on Financial Intermediation
It is widely accepted that the control on interest rates paid and received by Australian banks meant that they had to ration credit. The discussion in Section 3.1 suggested that those investors who had the safest projects and those with the most collateral would be first in line to receive rationed funds from the banks. This certainly seems to have been the case in Australia[7]. Nowhere was this more obvious than in the market for housing loans. Successive governments had controlled the housing loan rate in an attempt to improve the access of lower income groups to housing finance. However, the interest rate controls meant that the banks had to ration the housing credit they extended. The Campbell Committee concluded that this rationing meant that the regulations had been “counter-productive in achieving their welfare objectives, while hurting the community at large by impairing the efficiency of the financial system” (page 647). That is, banks preferred to lend to their safest customers; those with a large amount of collateral. The interest rate controls had the effect of subsidising housing loans for high income earners while excluding low income earners from the market.
While the effect of interest rate ceilings on the business sector received less attention than their effect on the housing sector, the same problems were at work. Again, the Campbell Committee concluded that “the interest rate ceiling on overdrafts ... has had the effect of limiting the potential access of small business to bank finance. Once the concessional limit has disappeared ... banks should have greater incentive to make loans to small business” (page 683). In the regulated environment banks demanded that small business loans be covered by significant collateral and that collateral was generally valued conservatively[8]. Rationing[9] also meant that competition between banks was subdued. With deposit rates often below equilibrium rates, banks could not compete for funds. There was also little incentive to develop innovative financial products. In addition, as part of the rationing mechanism, banks typically required that borrowers have a long and stable deposit history with the bank before a loan would be extended. This limited the mobility of bank customers and made competition less attractive.
As discussed above, the controls on banks led to the growth of non-bank financial institutions. Many of these institutions were in fact established by the banks themselves. The existence of these non-bank intermediaries partially nullified the adverse resource allocation effects of the controls on banks. They could not, however, completely offset the effects of regulation. This can be seen in the ratio of total assets of financial institutions[10] to GDP, which is shown in Graph 2.
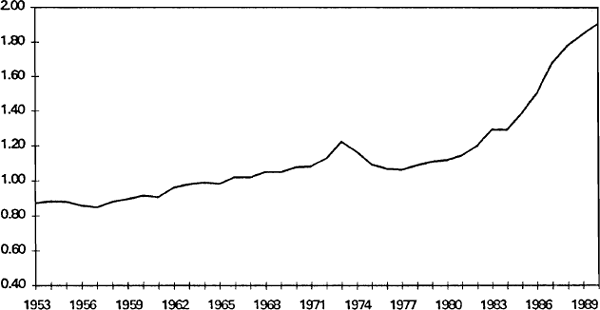
Numerous authors[11] have found there is, in general, a positive relationship between income per-capita and the ratio of financial assets to GDP. In line with this finding, Graph 2 shows that there has been an upward trend in the ratio of the total assets of financial institutions to GDP in Australia over the last 40 years. However, this upward trend was interrupted in 1973, with the ratio actually falling over the following 4 years. The 1973 level was only reached again in 1982. In part, the decline in the ratio after 1973 reflects the high level of the ratio in that year. The early 1970s were characterised by favourable movements in the terms of trade that caused a strong increase in activity and increased demand for finance. However, the fact that it took ten years for the ratio of financial institutions' assets to GDP to again reach its 1973 level also reflects the financial repression induced by the controls on the banking sector. The removal of these controls has caused the ratio to increase at a much faster rate than previously was the case. Between 1983 and 1990 the ratio increased from 1.3 to 1.9. This suggests that while institutions were able to develop under the regulations to partially nullify the effects of the regulations on the extent of financial intermediation, these institutions did not provide a complete substitute.
While the ceilings on both housing loans and business loans had undesirable effects, the business loan restrictions are likely to have been considerably more harmful in terms of slowing the rate of economic growth. Small businesses have little ability to access external finance other than through intermediated credit. Because of the costs involved and the information asymmetries, it is difficult for small firms to raise funds on equity markets[12]. For many small firms the only alternative to intermediated external finance is retained earnings. While the level of desired investment is a function of many factors, the rationing of credit to small business must have limited actual investment by small businesses.
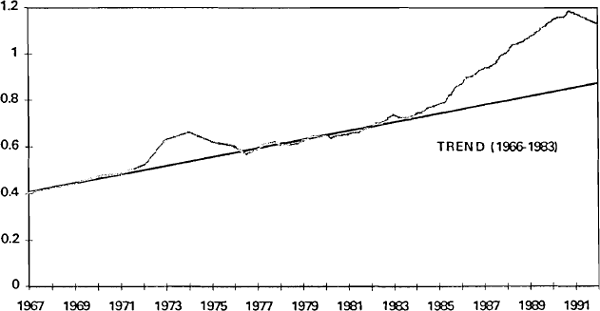
According to the discussion in Section 3.1, the lifting of interest rate ceilings should have had two effects. First, it should have increased the volume of intermediated lending. Second, it should have changed the structure of lending so that a greater proportion of riskier projects gets financed.
Graph 3 shows the ratio of credit to nominal private final demand between 1967 and 1992. The graph shows that in 1966 this ratio stood at 0.4 but by 1992 it had increased to over 1.1. The increase in the ratio has, however, not been at a steady rate. Prior to 1984 the ratio had been increasing by slightly less than 0.02 per year. The only major exception to this was in the early 1970s when, as the result of a mining investment boom, the ratio was significantly above trend. From 1983 the growth in the ratio of credit to private final demand accelerated, averaging approximately 0.06 per year over the next 8 years. Much of this increase can be attributed to the effects of liberalisation. It also suggests that while the growth of non-bank financial institutions in the 1970s may have been able to supply funds to some of the banks' credit rationed customers, the regulations still limited the amount of intermediated credit.
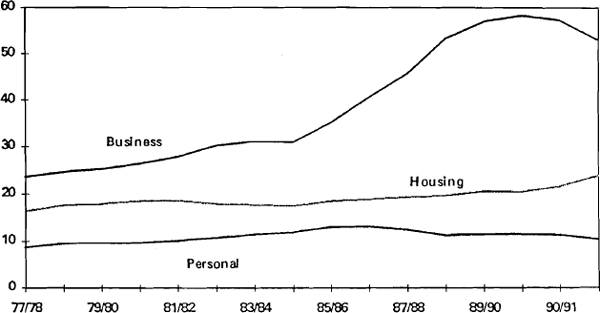
Given that financial liberalisation allowed a significant increase in the growth rate of credit, what do we know about the allocation of that increased credit amongst different sectors of the economy? Graph 4 provides some information on this point. It shows the credit extended to various borrower classes as a share of GDP from 1977/78 to 1991/92. The graph shows prior to 1983/84 the rates of growth in the ratios of personal lending, housing lending and business lending to GDP were all similar and did not vary greatly through time. In 1984/85 this pattern began to change. The ratio of housing credit to GDP increases at a slightly faster rate than previously was the case while the ratio of business credit to GDP increases at a much faster rate. In 1983/84 the ratio of business credit to GDP equalled 0.31 but by 1990/91 it had increased to 0.57 per cent. In contrast, the ratio of personal credit to GDP declined after deregulation. This in part reflects classification error. Due to rationing induced by the regulations, small businesses may have substituted “personal credit” for “business credit”. In the deregulated environment the need to do this was removed. The graph suggests that the regulation of financial intermediaries placed considerable constraints on the ability of business to borrow.
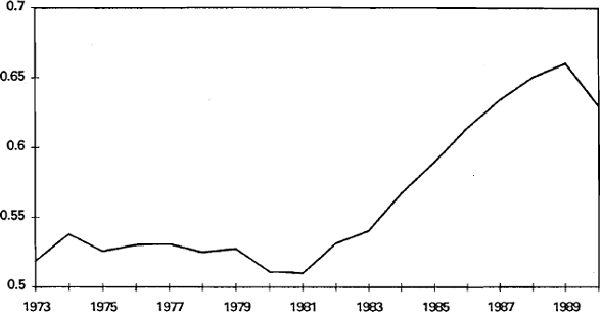
The increased willingness and ability of the banks to lend to business can also be seen in company balance sheets. Graph 5 shows the weighted average ratio of debt to the book value of assets for a stable sample of 110 large Australian companies over the period from 1973 to 1990[13]. The share of debt in company balance sheets remained relatively constant at a little over 50 per cent until the early 1980s. In 1980 the ratio stood at 0.52 but by 1989 it had increased to 0.66. The increase in corporate borrowing facilitated much faster growth in company balance sheets in the 1980s than had occurred in the 1970s. Over the 7 years to 1990 the average real growth rate in the aggregate size of the balance sheets of the 110 companies was nine per cent per annum. This compares with the an average real growth rate of 1.7 per cent per annum over the 10 years to 1983.
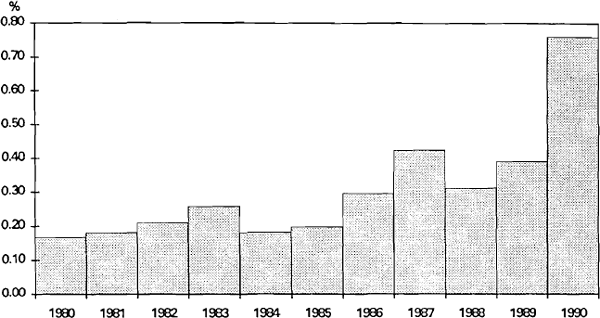
The second implication of deregulation is an increase in the proportion of risky loans made by banks. Provided that a bank is able to satisfactorily screen its customers, it is able to charge an interest rate sufficiently high on risky loans to earn a risk-adjusted rate of return commensurate with the rate of return on less risky lending. While data on the ex-ante risk characteristics of new bank loans is unavailable, some data on the ex-post bad debts expenses incurred by banks is available since 1980. Graph 6 shows the bad debt expenses of major banks as a percentage of their total assets[14]. Two points are made by this graph. First, the banks' bad debt expenses as a share of their total assets is counter-cyclical; the recessions in 1983 and 1990 both caused an increase in the bad debts ratio. This is hardly unexpected, as economic contractions cause an increase in business failures and loan defaults. The second point is that, abstracting from the business cycle, there has been, over the second half of the 1980s, an increase in the share of bad loans. In the six years to 1985, the bad debts expense as a share of total assets averaged less than 0.2 per cent. Over the five years to 1990 this average was over 0.4 per cent. This suggests that indeed, deregulation has led to banks financing more risky projects than was previously the case.
Another implication of financial liberalisation is an increase in competition[15]. This should be reflected in lower spreads between deposit and lending rates and an increase in the range of financial products available from intermediaries. Both of these outcomes appear to have occurred in Australia. Harper (1991) argues that following deregulation “banks developed a veritable cornucopia of new financial products and services” (page 69). These included a wider range of borrowing options and repayment plans, an increased availability of risk-management tools and a technology driven increase in the range of retail services. With respect to bank margins, the Reserve Bank of Australia (1992(a)) argues that the spread between the average lending rate and the average deposit rate has narrowed over the 1980s. The relaxation of the controls on entry also served to increase competition. The number of banking groups operating in Australia increased from 15 in 1983 to 34 in 1988 while the number of merchant banks increased from 48 to 111 over the same period (see Macfarlane (1991)).
The theory discussed earlier suggested that lower spreads, an increased variety of products, an increased capacity to lend, and the setting of loan rates on the basis of risk should lead to a substantial improvement in the allocation of resources. However, the theory also suggested that the ability of the banks to screen projects effectively is a crucial element in capturing the gains from a more developed financial sector. If banks under-invest in their screening and monitoring technologies some of the gains from liberalisation may be wasted. Such under-investment probably took place in Australia in the 1980s. This is reflected in the Reserve Bank of Australia's 1992 Annual Report (1992(b)) that states “Recent experience underlines the importance of the banks' possessing systems to review and grade the quality of all assets on their books,.... The banks themselves have recognised the value of such systems and are improving their practices in this area” (page 28).
Similar sentiments have been expressed by private bankers[16]. Financial deregulation, coupled with the entry of new banks, led to competition for new business. Banks devoted considerable energy to building their balance sheets and increasing their market share. Often this was on the basis of compromised lending standards and inadequate monitoring of existing loans[17].
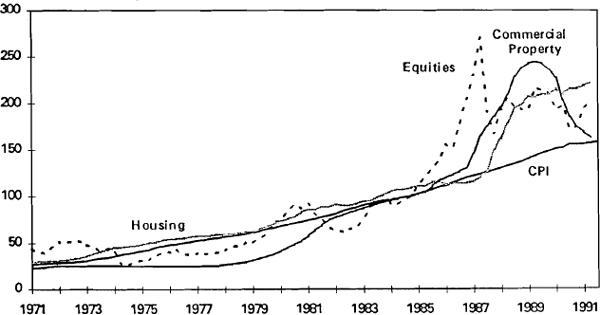
In Australia, as in a number of other countries, the second half of the 1980s was characterised by a rapid increase in real asset prices. Graph 7 shows the Consumer Price Index (CPI), an index of commercial property prices, an index of housing prices and the share price index. In the second half of the 1980s each of the asset price indices increased faster than the CPI. This increase in real asset prices reflected a number of factors including financial liberalisation. If financial liberalisation does lead to real productivity improvements in the economy then it should be reflected in higher real asset prices. Problems, however, arise when both financial intermediaries and borrowers extrapolate past asset price increases into continuing asset price increases. Lending and borrowing decisions become based on expected capital gains which at some point cannot be realised. The boom and bust cycle in the commercial property market is an example of this process. Poor screening by some financial intermediaries led to the funding of projects that were based on unrealistic continuing increases in property prices. The result of such activity is substantial investment in low yielding assets. When this occurs on a wide enough scale, it harms not only the borrowers and the banks' shareholders, but it reduces the growth rate in the level of national income.
It is widely recognised that the combination of financial liberalisation, a drive for market share, real asset price increases and poor screening and monitoring by financial intermediaries wasted some of the gains of financial liberalisation. Intermediaries have recently tightened credit standards and have developed a greater appreciation of the need to devote significant resources to credit assessment and monitoring of loans. These improvements in the screening technology should leave Australia well placed to reap further rewards from the previous liberalisation of its financial markets.
While the focus of the above discussion has been on resource allocation, no discussion of the effects of financial liberalisation is complete without some consideration of its implications for monetary policy. In a deregulated environment, monetary policy no longer operates through direct quantity controls. Instead, it works by inducing wealth and intertemporal substitution effects. There is much ongoing research on how monetary policy can best be formed in such an environment[18]. To address the full range of issues is beyond the scope of this paper. Instead, to conclude this section, I touch briefly on just one issue. In the spirit of the above discussion of the implications of information asymmetries, I examine some of the implications for monetary policy of the interaction between agency costs and the business cycle.
The liberalisation of Australian financial markets made possible the large increase in business debt discussed above. This increase in debt is likely to have altered the dynamics of the business cycle and the impact of monetary policy on the economy. In the 1982–83 recession corporate debt-asset ratios were relatively low. As the economy began to recover, the liberalisation of financial markets meant that firms were both willing and able to expand their balance sheets through loans from financial intermediaries.
As the economy entered the current recession, debt-asset ratios were at historical highs and interest cover ratios were at historical lows. The interaction of the recession and the highly-leveraged balance sheets meant that firm net worth was relatively low and bankruptcy risk was relatively high. In Section 3.5 it was suggested that the outcome of such a situation would be a reduced incentive for management to undertake risky investment and a higher cost of funds to those firms wishing to borrow. An implication of this is that a setting of monetary policy that previously could have engineered a recovery in activity may now be unable to do so. A period of balance sheet “reconstruction” may be required before a strongly based recovery is possible.
The increased riskiness of loans to business in an economic downturn is reflected in a widening of the spread between loan rates and the banks' cost of funds. This introduces a difficult problem for monetary policy particularly during recessions that are the result of previously tight monetary policy. As nominal money market interest rates are eased through monetary policy, banks' loan rates may not fall to the same extent, due to the increased risk premium associated with the recession. To reduce bank loan rates to a particular level requires an easier monetary policy that would be the case if there were no risk premium. As the economy recovers, the risk premium narrows and with no change in monetary policy loan rates fall. This adds further stimulus to the recovery.
The basic problem is that the risk premium is counter-cyclical[19]. When the economy is in recession the risk premium is high and when the economy is growing strongly the premium is low. Thus, even if monetary policy is unchanged the loan rate will vary and it will vary in a way that will amplify the cycle. This amplification is likely to be greater the more highly geared are corporate balance sheets and the lower is the capital base of the banks. The counter-cyclical risk premium is also likely to increase the persistence of shocks to the economy. A positive shock that improves corporate and bank balance sheets reduces agency costs and this sustains the boom through lower loan rates. This increased persistence and amplification of the business cycle caused by counter-cyclical agency costs complicates the setting of monetary policy,
Footnotes
Grenville (1991) also notes that the motives for regulation included the desire to sell government securities, the maintenance of prudential standards and the need to allocate credit to priority areas. Harper (1991) argues that the continued regulation reflected the then current state of “intellectual opinion ... that governments should exercise control over the banking system as part of their responsibility to manage the macro-economy”. [6]
See Harper (1991). [7]
A brief discussion of bank lending practices both before and after regulation is given by Barton (1989) (Chief Credit Controller, ANZ Bank). [8]
Econometric evidence that banks were required to ration credit before deregulation is presented in Blundell-Wignall and Gizycki (1992). They estimate a disequilibrium model of the supply and demand for business credit and show that, at the then prevailing interest rates, the demand for credit considerably exceeded the available supply; that is, there was disequilibrium credit rationing. They find little evidence of equilibrium credit rationing in the period since deregulation. [9]
Financial assets include the assets of banks (with the exception of the Reserve Bank of Australia), non-bank financial corporations, life offices and superannuation funds and other financial institutions such as cash management trusts and friendly societies. [10]
For a comprehensive review see Goldsmith (1985). [11]
When a firm attempts to issue equity, outside investors are not sure whether the firm is attempting to raise funds for legitimate and profitable investment or attempting to pass-off overvalued assets. This uncertainty implies that equity must be issued at a discount. The information problems may be so severe that they prohibit equity raisings. These problems are likely to be greater for small firms that have no reputation to help overcome the information problems. [12]
For further details on changes in the financial structure of Australian firms see Lowe and Shuetrim (1992) [13]
This graph is from Twrdy (1992). [14]
Fahrer and Rohling (1992) formally test propositions concerning the degree of competition in the market for housing finance in the deregulated period. They find that it is possible to reject the hypothesis of perfect competition and perfect collusion. They cannot reject the hypothesis that the industry behaves as a Cournot oligopoly. They also construct a Herfendahl index which suggests that concentration in the housing loan market declined following deregulation. [15]
See Barton (1989) and Ferdinands (1989). [16]
The relaxation of credit standards is generally seen as a mistake by the banks. An alternative view is that the relaxation of credit standards represented optimal behaviour by each bank in its race for market share. By relaxing credit standards, a bank was able to attract new customers. The existence of switching costs means that in future periods, it would have some market power over these new customers. Thus, while in some cases static considerations made certain loans unprofitable, ex-ante dynamic considerations made the establishment of a relationship with a borrower profitable. The willingness of the banks to undertake these risky loans may have been encouraged by a perceived implicit deposit guarantee from the central bank. Even if this interpretation is correct, the lower credit standards had a social cost in that they allowed investment projects to be undertaken which had low social returns. [17]
See Macfarlane (1991) and the papers in Blundell-Wignall (1992). [18]
Blundell-Wignall and Gizycki (1992) discuss the evidence on this issue for Australia. [19]