RDP 9212: Changes in the Characteristics of the Australian Business Cycle: Some Lessons for Monetary Policy from the 1980s and Early 1990s 3. The Exchange Rate and the International Cycle
December 1992
- Download the Paper 759KB
(a) Transmission of the International Business Cycle
As a small country which relies heavily on commodities for its export income, Australia is particularly vulnerable to external disturbances. In 1991/92, around 65 per cent of Australia's export earnings were from rural or resource-based exports (see Table 3.1). Furthermore, a very large proportion of Australian imports are manufactured goods or services.[8] Being determined in auction markets, prices for primary commodities fluctuate widely with cycles in world economic activity (see Figure 3.1), much more so than prices of manufactured imports. The Australian economy is therefore subject to substantial terms of trade shocks[9].
| Exports | Imports | |
|---|---|---|
| Commodity based | 64.5 | 15.1 |
| Manufactures | 15.0 | 60.5 |
| Services | 20.5 | 24.4 |
| * See Appendix for definitions of these categories. | ||
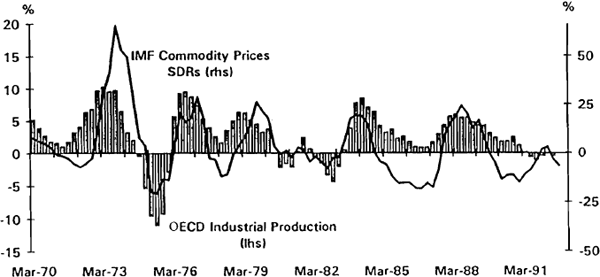
A boom in the rest of the world results in sharply higher prices for commodity exports, which increase the terms of trade. This impacts on the domestic economy primarily through income effects. At existing levels of production, prices and exchange rates, excess demand for non-traded goods emerges, putting upward pressure on domestic inflation.
Australia's terms of trade are highly volatile, both in absolute terms and relative to most other industrial countries. For example, there were particularly sharp changes in the terms of trade in 1972–1973 (a rise of about 45 per cent), 1985–1986 (a fall of around 13 per cent) and 1987–1988 (a rise of almost 30 per cent). Over the period 1949 to 1991, the average annual absolute percentage change in the terms of trade was 7.7 per cent; the only country with a higher level of volatility on this basis was New Zealand. Most European countries and the United States experienced around half this level of volatility (see Appendix).
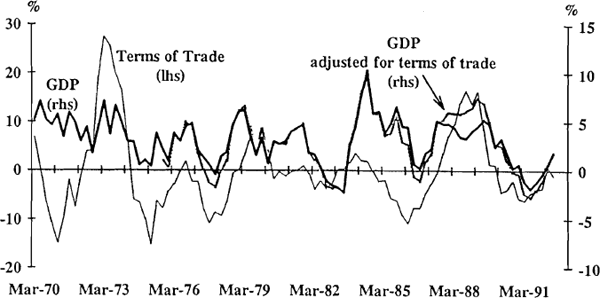
The effect of these swings in the terms of trade on domestic income can be quite substantial. Figure 3.2 shows four-quarter-ended changes in the terms of trade, GDP, and GDP adjusted for the terms of trade (GDP adj).[10] When the terms of trade falls, the adjusted GDP figure is lower than the standard GDP measure. For example, the terms of trade fell by around 13 per cent over 1985 and 1986. This is estimated to have reduced growth in GDP by around 1½ percentage points. Over 1987 and 1988, the terms of trade rose by 27 per cent, which was equivalent to a boost to GDP of a little over 2 per cent per annum; the subsequent decline in the terms of trade effectively reduced GDP by a bit under 1 per cent per annum.
For a small commodity-exporting country the equilibrium real exchange rate is strongly influenced by the terms of trade.[11] When excess demand for non-traded goods emerges, as the terms of trade rise, real exchange rate appreciation is the mechanism by which equilibrium is restored. The link between the terms of trade and the real exchange rate is shown in Figure 3.3. The decline in the terms of trade through 1985 and 1986, for example, was accompanied by a sharp fall in the real exchange rate (achieved by a depreciation of the nominal exchange rate). When the terms of trade subsequently boomed in 1987 and 1988, the real exchange rate appreciated. The link between the terms of trade and the real exchange rate is well established in empirical research on the Australian economy.[12]
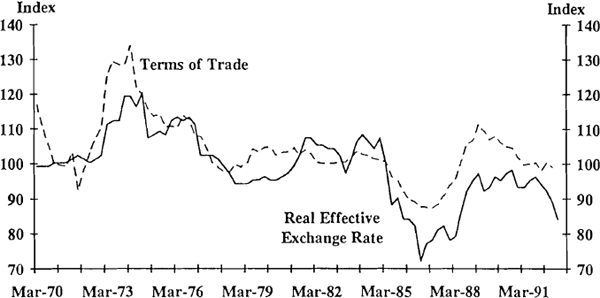
There have been periods, though, when the relationship between the exchange rate and commodity prices has seemed more tenuous. The real exchange rate appreciated through 1980, for example, despite a fairly flat terms of trade. More recently, the terms of trade declined through 1990 and 1991, with hardly any response from the real exchange rate, at least until 1992. This suggests the presence of other influences on the real exchange rate. The most important amongst these is changes in the stance of monetary policy, which might become necessary from time to time as a result of domestic real and monetary shocks.[13] If the terms of trade declined, but relatively tight monetary policy was required because of domestic inflation pressures, the exchange rate could remain at relatively high levels, reinforcing downward pressure on prices. Conversely, easy monetary policy in the face of a rising terms of trade might see the exchange rate fail to appreciate, reinforcing upward pressure on demand and, eventually, inflation.
The way in which the real exchange rate adjusts to terms of trade shocks depends crucially on the degree of flexibility of the nominal exchange rate. At one extreme, if the nominal exchange rate is fixed, a positive terms of trade shock will push up domestic demand and economic activity, resulting in increased domestic inflation. This gradually appreciates the real exchange rate, eventually restoring equilibrium. Conversely, a negative terms of trade shock under fixed exchange rates causes a downturn in economic activity and rising unemployment, until lower inflation than abroad causes the real exchange rate to depreciate. Since goods prices are relatively “sticky”, these adjustments can be long and relatively painful. On the other hand, if the nominal exchange rate is floating, the required adjustment in the real exchange rate can be achieved by appreciation or depreciation of the nominal exchange rate. This would offset to some degree the impact on economic activity and inflation of the terms of trade shock. Nominal exchange rate appreciation in response to a terms of trade boom, for example, will induce substitution in domestic demand towards imports and away from domestically produced goods. Furthermore, the decline in import prices will impact directly on the domestic price level, to the extent that final goods and services and inputs to the domestic production process are imported. This point will be picked up in a later section.
(b) Resource Allocation and the Performance of the Traded Sector
The discussion in the previous section suggests that the way in which the international business cycle impacts on the Australian economy should have changed with the floating of the exchange rate. A floating exchange rate helps to insulate the domestic economy from the world commodity price cycle, facilitating the task of monetary policy in achieving low and stable inflation. However, this might be achieved at the cost of greater instability in the traded-goods sector. In particular, it has often been argued that the swings in international competitiveness stemming from terms of trade fluctuations distort resource allocation decisions and adversely impact on the performance of the import-competing and non-commodity exporting sectors.[14]
Exchange rate appreciation in the face of a terms of trade rise has relatively less impact on commodity exporters, who tend to be buffered by the high foreign currency prices for their exports. Manufacturers, on the other hand, will be less competitive, as the exchange rate has appreciated but the foreign price of their goods has not risen as much (given the “sticky” nature of manufactured goods prices). Furthermore, import-competing industries will lose market share as consumers switch to purchasing relatively cheaper imports. If the movement in the real exchange rate is large enough and prolonged, many of the firms in these sectors may reduce investment, or go out of business, leaving them positioned very poorly to take advantage of a lower exchange rate once the commodity price cycle turns down again. Any assessment of Australia's experience with the conduct of monetary policy since the floating of the exchange rate needs to review just how important these “costs” have been.
Econometric evidence shows that relative prices are an important determinant of import demand, and hence will impact on the import-competing sector of the economy. Wilkinson (1992) uses cointegration techniques to estimate the demand for imports, and finds the long-run price elasticity of demand to be 0.5; a 1 per cent rise in the relative price of imports results in a 0.5 per cent fall in imports over the long-run. While this elasticity may not seem large, a substantial swing in relative prices may, nevertheless, imply a large impact on import demand.
Swings in relative prices should also impact on the non-commodity export sector. But despite some substantial movements in the real exchange rate over the 1980s, there has been consistently strong growth in manufactured exports in recent years. Figure 3.4 shows the volume of Australian exports broken down into three categories: rural, resource-based and manufactures.[15] Manufactured exports have shown the strongest growth over the 1980s, picking up substantially from the middle of the decade, albeit from a relatively low base. In the early 1980s, manufactured products represented around 12 per cent of merchandise export volumes; in 1991/92 the proportion was 19 per cent. Furthermore, if we include simply-transformed manufactures, such as iron, steel and aluminium, manufactured exports are now as large as rural exports.
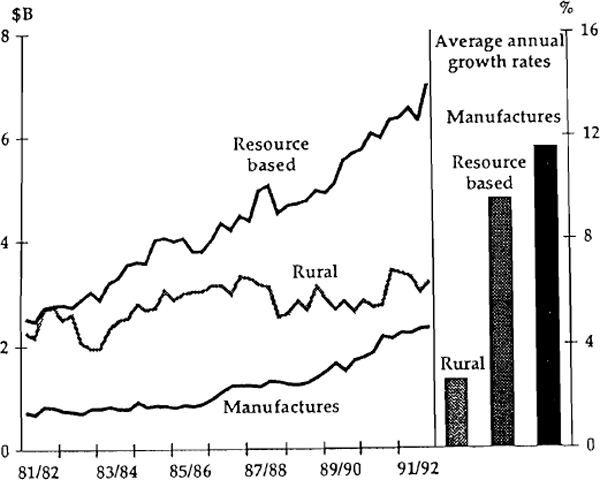
In order to explore the implications of this observation for monetary policy, it is necessary to identify the reasons why the manufactured-export sector has performed well, despite some sharp changes in competitiveness associated with the floating exchange rate. If other factors can be identified which ameliorate the impact of exchange rate swings on the traded goods sector, while also promoting its longer-run growth, monetary policy can focus on low inflation without incurring serious resource allocation costs. The remainder of this section attempts to identify these factors.
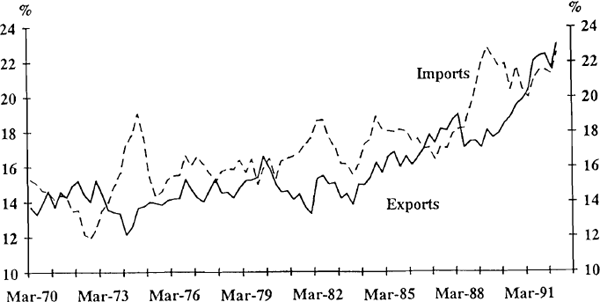
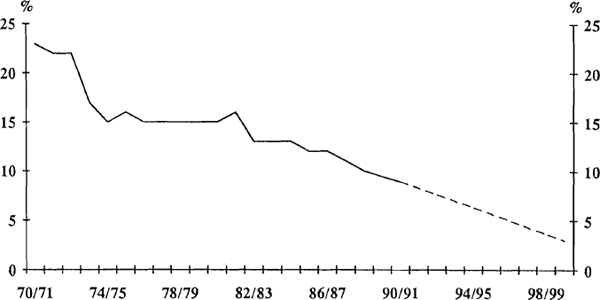
At a very broad level, the growth in manufactured exports is part of a more general trend towards increasing international integration of the Australian economy. Exports and imports of goods and services have risen as a proportion of domestic production over the 1980s (see Figure 3.5). This partly reflects benefits of the focus of micro-economic policy in Australia over the past decade. Tariffs were reduced over the 1970s and 1980s, and there is a timetable for further reductions over the 1990s (see Figure 3.6). As would be expected, imports have risen as a proportion of domestic spending, but the strong export performance requires further explanation.
One important reason for the good performance of Australian manufactured exports is geography. In particular, strong growth and rising real incomes in the Asian region[16] have presented plenty of opportunities for exporting. Table 3.2 shows growth in various regions since 1986.
| United States | 1.9 |
|---|---|
| OECD Europe | 2.8 |
| Japan | 5.0 |
| Asia (excl. Brunei) | 7.5 |
The result for Australia has been a geographical shift in our exports towards the Asian region (see Table 3.3).
| Total | Manufactures | |||
|---|---|---|---|---|
| 1985/86 | 1991/92 | 1985/86 | 1991/92 | |
| North America | 11.3 | 11.0 | 13.6 | 16.0 |
| EEC | 14.2 | 12.5 | 14.0 | 14.2 |
| Japan | 28.4 | 26.5 | 4.2 | 7.9 |
| New Zealand | 4.6 | 5.2 | 21.1 | 18.8 |
| Asia | 20.6 | 30.4 | 19.5 | 27.5 |
| Other | 21.0 | 14.4 | 27.5 | 15.7 |
But the growth in manufactured exports is not simply the result of strong demand from Asian markets; there is also evidence of increasing market penetration. Table 3.4 shows growth in Australian manufactured exports to various regions, and growth in manufactured imports by those regions, over the period 1986 to 1990.[17] Although exports to Asia have largely been driven by the strong growth in this region, there are some indications of a rise in market share. Moreover, this is an improvement on the 1970s and early 1980s, when market share in this region was falling.
| Country/region |
Australian manufactured exports | Manufactured imports | Percentage of Australian manufactured exports (1990) |
|---|---|---|---|
| Hong Kong | 20.5 | 25.3 | 3.4 |
| Singapore | 29.3 | 27.9 | 3.5 |
| Korea | 36.5 | 21.6 | 1.7 |
| Thailand | 39.7 | 42.5 | 1.7 |
| Indonesia | 45.1 | 21.0 | 2.8 |
| Philippines | 33.5 | 29,7 | 0.7 |
| Malaysia | 27.7 | 26.6 | 1.6 |
| Total Asia* | 30.8 | 26.4 | 15.3 |
| Japan | 29.6 | 26.3 | 5.0 |
| North America | 30.0 | 7.5 | 11.0 |
| New Zealand | 22.5 | 12.8 | 14.1 |
| OECD Europe | 27.5 | 16.1 | 10.6 |
| * This definition of Asia is slightly different from that in Tables 3.2 and 3.3. In particular, this definition excludes Taiwan, China and Brunei as data on their manufactured imports is not available on a basis comparable to the other countries. | |||
Even more striking is the fact that there have been substantial gains in market share in Australia's more traditional markets. Most notable here is North America, where Australian manufactured exports have grown four times faster than imports into that region. There were also substantial gains in market share in New Zealand and Europe. Increasing market penetration cannot be explained by Australia's geographical good fortune. It also contradicts the view that substantial swings in the real exchange rate are highly damaging for non-commodity exports.
Increased market share was probably helped by a general improvement in competitiveness over the 1980s. Figure 3.7 shows the real effective exchange rate over the 1980s and early 1990s; the horizontal lines show the averages for the first half of the 1980s and the second half. In the middle of the 1980s the exchange rate depreciated sharply, in response to the declining terms of trade and an external debt crisis, reaching a low point in December 1986. This depreciation, of around one third from its previous peak, certainly benefited the competitiveness of the non-commodity exporting sector. Nor did the subsequent appreciation, as the terms of trade rose, eliminate all of these gains. On average, the real exchange rate was lower in the second half of the 1980s than it was in the previous five years.
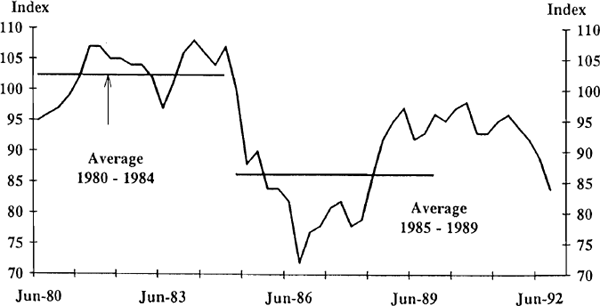
Although the extreme low level of the real exchange rate during 1986 was not maintained for long, the improvement in competitiveness was sufficiently large to encourage some investment in the export sector and to facilitate entry into foreign markets. Once a “beachhead” is established in a foreign market, it is unlikely to be easily surrendered, even at a higher exchange rate, given the sunk costs of entering those markets. Here it is worth noting that local knowledge, the development of distribution and service systems, personal contacts, and the like are known to be important factors for entering and maintaining a presence in many world markets. Under these circumstances, the real exchange rate would have to move by a substantial amount to reverse previous gains.
Aside from improved relative prices and “beachhead” phenomena, it is also likely that microeconomic reform and reduced protection of the domestic market through tariff cuts, together with some export-assistance measures, have stimulated a more outward-looking export orientation. Tariff cuts remove incentives for rent seeking behaviour on the part of businessmen, facilitating an export “culture”. New industries are finding “niches” in external markets, where research and development, quality, marketing and reliability of supply are important considerations which affect competitiveness, but do not depend on relative prices. Furthermore, reducing tariffs on imported goods that are inputs to the domestic production process eliminates what is essentially a tax on exports. In contrast, export assistance measures are a subsidy. While they should not be continued in the long run, they can be useful in breaking down barriers to entry.
Generally speaking, it is difficult to isolate the contribution of various export assistance measures. [18] Some categories which receive assistance have grown strongly over the past six years or so, but others which receive no assistance have also expanded rapidly, while a number of assisted exports have grown more slowly. Some evidence on this is presented in Table A2 in the Appendix. It shows average annual growth in manufactured export volumes by SITC division, and contributions to growth of these categories over the period 1986/87 to 1991/92.
These data confirm that the assisted categories have made a relatively large contribution to the recent growth in manufactured exports (see column 5). Assisted exports contributed 52 per cent of the growth in manufactured export volumes over the period 1986/87 to 1991/92. This is because most of the assisted categories are fairly large; the eleven assisted categories identified in Table A2 (out of a total of 33 categories) accounted for almost 50 per cent of manufactured export volumes in 1986/87.
On the other hand, there is not an overwhelming tendency for assisted exports to have grown more quickly than unassisted exports over the period (see column 4). Of the top ten fastest growing categories, six were unassisted. In total, assisted exports grew on average by 15.7 per cent per annum, while unassisted exports grew by 13.6 per cent per annum. This does not appear to be a significant difference when taking into account the dispersion of the growth rates. So although a large part of the total growth is due to assisted exports, the strong growth in a broad range of small categories suggests that there is something more fundamental driving growth as well.
Whatever the explanations, the rising importance of manufactured (and for that matter services) exports, has helped Australia to begin the process of diversifying away from its traditional reliance on commodity exports.
(c) Implications for Monetary Policy
It has been argued so far that the floating of the $A in December 1983 changed the nature of the transmission of the international business cycle to the Australian economy. Sustained movements in commodity prices impact relatively more on the nominal exchange rate, for a given stance of monetary policy, and less on domestic production and prices. This facilitates the task of monetary policy in achieving a low-inflation outcome, insofar as pressures on activity (and hence inflation) result from movements in the terms of trade. Furthermore, the evidence from section 3(b) suggests that nominal exchange rate swings have not had any obvious adverse consequences for the performance of the non-commodity export sector, which is important for longer-term productivity and growth.
But the exchange rate also impacts directly on the domestic price level through its effect on import prices. For example, a depreciation in the nominal exchange rate will, for given foreign prices, raise the domestic price of imported goods and services. If these are final goods and services then, other things equal, the price faced by the final purchaser will also rise. If the goods and services are inputs to the production process, then there may be a further impact, as domestic producers pass on their cost increase to domestic consumers. In general, the extent to which exchange rate changes affect the domestic price level will depend on the proportion of wholly or predominantly imported goods and services in our consumption bundle, and the extent to which imported inputs are used in the domestic production process.[19]
These direct effects are also an important consideration for monetary policy. If the exchange rate adjusted only according to changes in its underlying equilibrium determined by the terms of trade, the above discussion suggests that it should have negligible consequences for domestic inflation. The inflationary impact of exchange rate depreciation would be considerably offset by the deflationary impact of the fall in the terms of trade. However, there are two other important influences on exchange rates, which are exactly analogous to those discussed earlier in the context of other asset prices. First, monetary policy directly influences the nominal exchange rate in a world of highly mobile capital. Excessive easing or tightening of monetary policy will be transmitted into domestic inflation outcomes through movements in the exchange rate. Secondly, exchange markets are also affected by the speculative dynamics, including positive feedback, described by Cutler, Poterba and Summers (1990). For example, the very sharp fall in the $A during the mid 1980s is widely believed to have overshot as a consequence of such speculation. As the experience of this time showed, such overshooting can have significant effects on domestic prices. Such inflation pressure may become in-grained, if wage-price interactions result.
It is therefore of some interest to consider whether some of the structural developments considered earlier might have caused the direct impact of the exchange rate on inflation to change over time. Increased competition resulting from tariff reductions, for example, might reduce the importance of direct exchange rate effects because:
- it becomes more difficult to pass on increases in the price of intermediate inputs; or
- firms may be less willing to accede to wage demands in response to higher prices.
Furthermore, a reduction in the tariff rate reduces the magnifying effect which an ad-valorem tariff has on changes in import prices.
Working against these effects, the increasing international integration of the economy (partly as a result of tariff reductions) means that an increasing proportion of goods consumed and used as inputs to production are imported. This implies that import prices may have become more important for domestic prices over time.
With the underlying economic structure changing over time, estimating a structural model with constant coefficients is inappropriate. But temporal ordering tests, such as those carried out in Blundell-Wignall, Lowe and Tarditi (1992), can give an indication of the information content of variables without constructing a full structural model. Given the changed role of the traded-goods sector discussed above, it is of interest to see if the informational content of import prices for domestic inflation has also changed over time.
To approach this question, the Blundell-Wignall/Lowe/Tarditi equation is estimated over the period 1967Q4 to 1984Q1, and then a series of rolling regressions are performed by adding successive observations to the sample period. The final regression of the series is run over the period 1967Q4 to 1992Q2. Specifically, the following equation is estimated:
where P is the consumption deflator, TOT is the terms of trade and MP is import prices. The objective here is to examine whether the informational content of import prices for domestic inflation has changed since the beginning of 1984, the first quarter of the floating exchange regime. Blundell-Wignall et. al. found evidence of a structural break in the relationship between domestic inflation, the terms of trade and import prices at this time, so it seems a logical point to begin the regressions.
The results of these rolling regressions are shown in Figure 3.8. The dashed line shows the sum of the coefficients on the terms of trade as progressively more observations are added to the estimation period. The sum of the coefficients on the terms of trade is fairly stable. Over the period to 1984Q1, it is 0.19 and significantly different from zero at the 1 per cent level. Successive estimates vary at most by about one fifth of a standard error from the initial sum, and by the end of the period its value is 0.2, also significantly different from zero at the 1 per cent level.
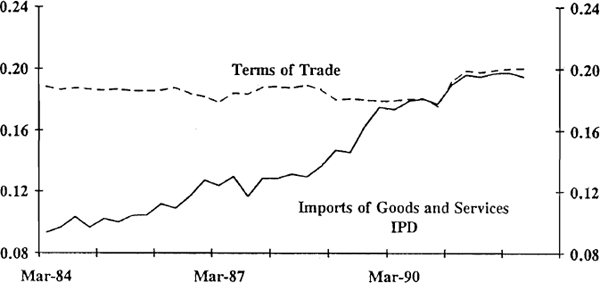
The solid line shows the sum of the coefficients on import prices as progressively more observations are added. Unlike the terms of trade, these estimates do not appear to be stable; the information content of import prices for domestic inflation appears to change between the beginning and the end of the period. When the equation is estimated up to the March quarter 1984, the sum of coefficients is not significantly different from zero even at the 10 per cent level. That is, import price changes provide no information on domestic inflation which is not already contained in either past inflation or terms of trade changes. As progressively more observations are added to the estimation period, the sum of the coefficients trends upwards. By the end of the period, the sum of coefficients is 0.2, and this estimate is significantly different from zero at the 1 per cent level.
This finding suggests that import prices have become a more important indicator of domestic inflation in recent years. This result would be expected as the Australian economy becomes more integrated with the world. The significance of this result is that the exchange rate will have relatively more weight in domestic monetary policy considerations.
Footnotes
The split between commodity-based exports/imports and manufactures is done at a very broad level. For example, many of the commodity-based imports are processed food products which could arguably be included in manufactures; if anything, Table 3.1 overstates the importance of commodities in Australian imports. [8]
Australia's terms of trade is very highly positively correlated with commodity prices. The correlation coefficient between the quarterly change in the terms of trade and quarterly changes in the RBA commodity price index in SDRs over the period June 1983 to June 1992 is 0.71. [9]
This adjustment is made to try to capture the effect of terms of trade changes on domestic purchasing power. It is calculated by revaluing exports of goods and services by the implicit price deflator (IPD) for imports of goods and services to provide an estimate of the purchasing power of exports over imports. This value is then substituted for the actual constant price value of exports of goods and services and GDP calculated in the usual way by summing expenditures. For more details see Australian Bureau of Statistics Cat. No. 5206.0, December 1990 issue. [10]
This is shown more formally in Blundell-Wignall and Gregory (1990). [11]
Blundell-Wignall and Thomas (1987) found that the Australian real exchange rate deviated from purchasing power parity, but that this deviation could be explained by movements in the terms of trade. Blundell-Wignall and Gregory (1990) showed that a long-run relationship could be established between the real exchange rate and the terms of trade. Furthermore, they showed that this relationship is significant in an error correction framework explaining changes in the real exchange rate. A recent updating of this work shows that the real exchange rate and the terms of trade are cointegrated. [12]
Gruen and Wilkinson (1991) found some evidence of a stable relationship between the Australian real exchange rate and the terms of trade. But they also found evidence of a stable relationship between the real exchange rate and the real long-run interest differential over the post-float period. Performing out of sample forecasts for the period October 1990 to March 1991, Gruen and Wilkinson found that the model which included both the terms of trade and the real long-run interest differential forecast the actual real exchange rate better than models with single explanators. In particular, a model of the real exchange rate including only the terms of trade over predicted the fall in the real exchange rate through 1991. [13]
As discussed in the previous section, swings in the terms of trade will result in swings in the real exchange rate even if the nominal exchange rate is fixed, since there will be an impact on domestic prices. The objection to the floating exchange rate in this context is an objection to the speed of adjustment and the possibility that the nominal (hence the real) exchange rate will overshoot. [14]
The categories in this figure essentially correspond to those in Table 3.1. Manufactures in this case is as close as we can get to elaborately transformed manufactures. Simply transformed manufactures such as iron and steel and aluminium (which have also expanded very rapidly in recent years) are included in resource based exports. See Appendix for details. [15]
The definition of Asia used is ASEAN (Brunei, Indonesia, Malaysia, The Philippines, Singapore and Thailand), Korea, Taiwan, Hong Kong and China. Where data problems necessitate a departure from this definition, it is noted in the text. Japan always is separately identified. [16]
These regions together represent around 85 per cent of our manufactured exports; see Table 3.3. Due to data limitations, the growth rates in Table 3.4 are calculated using values rather than volumes. To overcome problems due to different inflation rates, the data are all in US dollars. [17]
For a listing of the various types of export assistance measures see Industry Commission (1992). [18]
Estimates of the total impact of exchange rate changes on the domestic price level are difficult to calculate. Richards and Stevens (1987) used a “mark-up” model of domestic price determination to calculate the impact of the exchange rate depreciation through 1985 and 1986 on the domestic price level. They estimated that the elasticity of domestic prices with respect to the exchange rate was 0.35. That is, a 10 per cent depreciation in the exchange rate is estimated to add 3.5 per cent to the domestic price level, as measured by the consumer price index (CPI). Stevens (1992) modelled changes in the CPI as a function of lagged changes in the CPI, the output gap, changes in import prices and a “wage shock”. He found the sum of the lagged coefficients on import prices to be between 0.05 and 0.1 (depending on the sample period). This is significantly less than Richards and Stevens estimates. Blundell-Wignall, Lowe and Tarditi (1992) find lagged changes in import prices sum to around 0.2, in an equation explaining the consumption deflator. Both studies may, however, underestimate the second round effects of rising import prices on the prices of domestically produced goods. [19]
