RDP 9206: Loan Rate Stickiness: Theory and Evidence 3. Tests of Loan Rate Stickiness
June 1992
- Download the Paper 820KB
The empirical literature on price stickiness in banking has typically focused on a single deposit or lending rate. Yet, casual observation suggests considerable variation in the degree of interest rate stickiness across different products. The interest rate charged on credit cards remains constant for long periods of time while the rate charged on overdrafts changes regularly. In this section we formally examine interest rates on a number of different types of bank loans and, by examining differences in the degree of loan rate stickiness, draw some tentative inferences concerning the cause of the stickiness.
3.1 Data and Estimation Procedure
Prior to the mid 1980s most bank lending rates were the subject of regulation. For most types of lending these regulations were lifted in April 1985. In the case of overdrafts the maximum rate on all overdrafts was set by the Reserve Bank prior to February 1972[10]. At that time interest rates on overdrafts drawn on limits over $50,000 became a matter for negotiation between the banks and their customers while those drawn under limits less than $50,000 remained regulated. In February 1976 the threshold level was increased to $100,000 and in April 1985 all regulations were lifted.
From 1966, when personal loans were introduced, the maximum rate that banks could charge was set by the Reserve Bank. Once again, in April 1985, the controls were removed. At the same time, the maximum interest rate that could be charged on credit cards was deregulated. Prior to this time the maximum rate had been set at 18 per cent per annum.
The period of housing loan rate regulation extended beyond that for the other lending rates. Until 1973, the maximum rate that could be charged on housing loans was the same as that on overdrafts although banks typically charged a lower rate. In October 1973 banks agreed to a “consultative maximum” on housing loans which was below the overdraft rate. This was formalised in December 1980 when the maximum rate that could be charged on owner-occupied housing was set one percent below the maximum overdraft rate. The ceiling on new owner-occupied housing loans was finally removed in April 1986.
In the deregulated period, data on certain actual lending rates is readily available. For example, the actual rate charged on credit card loans is directly observable and is the same for all classes of borrowers. In contrast, banks generally do not publish data on rates actually charged on overdrafts. Instead, they typically quote some base or reference rate to which a margin is added to obtain the actual loan rate. These margins are determined on a case by case basis and are a function of the perceived credit worthiness of the borrower.
The quoting of reference rates for an increasing variety of lending products makes it difficult to determine the degree of stickiness of certain actual loan rates. Conclusions regarding the stickiness of the reference rate do not necessarily translate into conclusions regarding the stickiness of the actual rate charged. With this caveat in mind we examine three overdraft rates. Two of these rates are the advertised overdraft reference rates of one large Australian bank. The first of these two is the reference rate for large corporate overdrafts while the second is for small business overdrafts. The third rate used is the rate most commonly charged on small business overdrafts by another Australian bank. This rate includes the margin but it is only available for a subset of our sample period. We refer to this rate as the “standard rate”. In addition to the above overdraft rates we examine the degree of stickiness in the housing loan rate, the credit card rate and a variety of personal loan rates.
As detailed above, most lending rate ceilings were lifted in April 1985. Where data permits, we begin our sample period in January 1986. This allows a period of adjustment to the deregulated environment. For the housing loan rate series, the sample period begins in July 1986, while the four personal loan rate series are only available after September 1987. The following table summarises details of the rates used for the deregulated period.
| Loan Type | Rate Description | Deregulated Sample Period |
|---|---|---|
| Personal Loans | Minimum Rate on Secured Loans Maximum Rate on Secured Loans Minimum Rate on Unsecured Loans Maximum Rate on Unsecured Loans Maximum Rate on Unsecured Loans Rate on unsecured loans published by OECD |
Sept. 87 – August 91 Sept. 87– August 91 Sept. 87 – August 91 Sept. 87 – August 91 Jan 86 – August 91 |
| Housing Loans | Owner Occupied Loans | July 86 – August 91 |
| Credit Card Loans | Rate on cards with 55 day free credit |
Jan 86 – August 91 |
| Business Loans | Reference rate for large borrowers Reference rate for small borrowers Most common rate for small borrowers |
Jan 86 – August 91 Jan 86 – August 91 Jan 86 – April 90 |
For the period prior to deregulation we examine the unsecured personal loan series published by the OECD, the housing loan rate, the credit card rate, the minirnum rate charged on overdrafts greater than $100,000 (the prime rate) and the rate most commonly charged on small business overdrafts (the standard rate). Further details of all interest rates used are presented in Appendix 1.
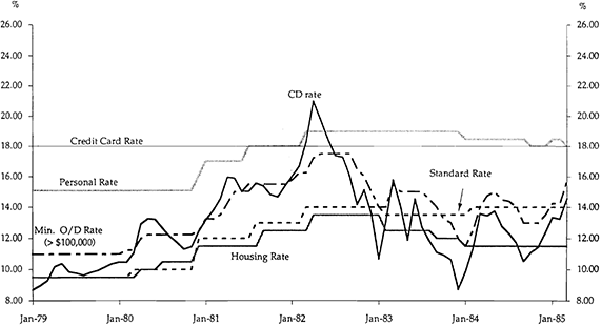
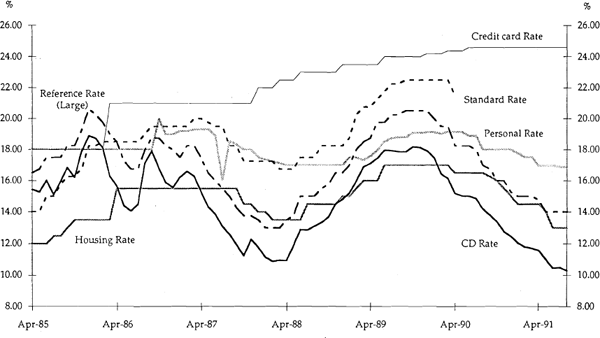
A comparison of the movements of selected rates can be seen in Figure 1 for the period 1979:1 to 1985:3 and in Figure 2 for the period 1985:4 to 1991:8.
International comparisons of lending rate behaviour are made difficult by the fact that lending practices differ across countries. In particular, for a number of countries, the bulk of personal and housing lending is done by way of fixed interest loans. The response of interest rates on new loans of this type to changes in the cost of funds, will be different to that of the response of interest rates on variables rate loans. Given that in this study we use variable rate loans for Australia, the international rates that we examine are restricted to those on variable rate loans. We examine five such rates: the prime lending rates in the United States, Canada and the United Kingdom, the mortgage lending rate in the United Kingdom and the United States credit card rate. Further details of these rates, together with details of the relevant marginal cost of funds, are available in Appendix 1.
The standard price stickiness tests involve regressing the loan rate on a measure of the banks' marginal cost of funds. If price equals marginal cost, changes in the marginal cost of funds should be transmitted one for one into changes in the lending rate. It is a difficult task to measure the exact marginal cost of funds for a bank given the range of funding sources and deposit products that are available. Nevertheless, there are observable interest rates which provide satisfactory proxies. These are the bank bill rate and the certificate of deposit rate (CD rate). We also construct a third measure of the marginal cost of funds. This measure is a weighted average of the interest rates paid on fixed deposits over $50,000, the CD rate and the bank bill rate. The weights used are the shares of the different liability classes in total liabilities (for further details see Appendix 1). The problem with this third measure is that using existing liability shares may not capture the true marginal cost of funds. Its advantage is that it uses a wider range of interest rates than any single interest rate measures. Our three measures of the marginal cost of funds all show very similar time profiles and our empirical tests revealed similar results for all three measures[11].
For brevity, we only report the results using the CD rate. We also report initial results using two other measures of the costs of funds. Both are weighted average interest rates that banks pay on various classes of deposits. The first rate, which is labelled AVERAGE, is the average interest rate that banks pay over all deposits. The second rate, labelled RETAIL, is a weighted average rate that banks pay on their retail deposits. A more complete description of these two rates is given in Appendix 1. Neither of these rates are likely to represent the banks' marginal cost of funds but are included for completeness and as a basis for comparison. The discussion focuses on the results obtained using the CD rate.
All estimation is carried out using ordinary least squares. All hypothesis tests are conducted with a covariance matrix which is robust to conditional heteroskedasticity and serial correlation. The covariance matrices are calculated using the Newey-West procedure with 6 lags.
There is some debate over whether nominal interest rates are characterised by a stationary or by an integrated process. Unfortunately, the tests which discriminate between these two alternatives are of low power and of questionable use over sample periods as short as those used in this paper. We take the view that interest rates are stationary and thus classical inference is valid. For completeness, however, we also report in Appendix 2 selected results for regressions where the interest rates have been first differenced.
3.2 Results
We begin by exaniining the deregulated period. Table 1 presents the results of regressing the lending rates on the contemporaneous cost of funds variables. When the CD rate is used, the estimates of the coefficients on the CD rate are in all cases less than one. In almost every case the estimates are significantly less than one. All the personal loan rates, the housing loan rate, the credit card rate, the most commonly charged small business rate and the base rate for small business loans all show some degree of stickiness. For the large corporate base rate it is possible to reject the hypothesis that the coefficient equals one at the 7 per cent level of significance.
| MEASURE OF COST OF FUNDS | ||||||||||
|---|---|---|---|---|---|---|---|---|---|---|
| LENDING RATES | SAMPLE PERIOD | AVERAGE COST | RETAIL COST | CD RATE | ||||||
| α | β |  |
α | β | |
α | β | |
||
| PERSONAL RATES | ||||||||||
| Secured (min.) | 87:9–91:8 |
11.41 (1.39) |
0.59 (0.11) |
0.46 |
10.66 (1.64) |
0.82 (0.16) |
0.45 |
12.80 (1.66) |
0.35 (0.11) |
0.27 |
| Secured (max.) | 87:9–91:8 |
16.52 (0.95) |
0.48 (0.08) |
0.42 | 15.73 (1.08) |
0.69 (0.11) |
0.45 |
17.78 (1.35) |
0.27 (0.10) |
0.23 |
| Unsecured (min.) | 87:9–91:8 |
11.74 (1.26) |
0.64 (0.10) |
0.50 | 10.82 (1.42) |
0.90 (0.14) |
0.51 |
12.98 (1.51) |
0.40 (0.10) |
0.33 |
| Unsecured (max.) | 87:9–91:8 | 17.19 (0.93) |
0.49 (0.08) |
0.46 | 16.31 (0.97) |
0.71 (0.10) |
0.50 |
18.21 (1.26) |
0.30 (0.09) |
0.29 |
| Personal (OECD) | 86:1–91:8 |
14.15 (0.58) |
0.36 (0.05) |
0.50 |
13.39 (0.57) |
0.53 (0.07) |
0.56 |
14.91 (0.60) |
0.22 (0.04) |
0.36 |
| OVERDRAFT RATES | ||||||||||
| Standard Overdraft | 86:1–90:4 |
8.78 (0.87) |
0.96 (0.09) |
0.83 |
6.62 (0.74) |
1.43 (0.09) |
0.83 |
10.21 (1.70) |
0.61 (0.13) |
0.60 |
| Base (Small) | 86:1–91:8 |
4.20 (0.59) |
1.20 (0.60) |
0.95 |
3.15 (0.91) |
1.62 (0.11) |
0.87 |
5.31 (0.85) |
0.82 (0.06) |
0.90 |
| Base (Large) | 86:1–91:8 |
3.03 (0.68) |
1.29 (0.07) |
0.95 |
2.09 (1.07) |
1.71 (0.12) |
0.84 | 3.88 (0.82) |
0.90 (0.05) |
0.94 |
| OTHER RATES | ||||||||||
| Credit Card | 86:1–91:8 |
22.87 (2.13) |
0.01 (0.20) |
−.01 |
23.65 (2.61) |
−0.07 (0.31) |
−.01 |
24.34 (2.13) |
−0.10 (0.15) |
0.01 |
| Housing Loans | 86:7–91:8 |
8.82 (0.58) |
0.60 (0.05) |
0.84 |
7.92 (0.60) |
0.85 (0.06) |
0.85 |
9.56 (0.77) |
0.40 (0.05) |
0.69 |
Notes: Standard errors appear in parentheses below the coefficient estimates. |
||||||||||
When the retail cost of funds and the average cost of funds are used, we find higher coefficient estimates overall; with the retail cost generally yielding the highest estimates. For these two cost of funds variables, the coefficient estimates are both above and below one.
In Table 2 we report marginal significance levels for tests of the hypotheses that coefficients on the cost of funds variables are equal for various pairs of lending rates. The personal loan rate, the housing loan rate and the credit card rate each exhibit significantly more stickiness than the base rates and the standard overdraft rate. We also find that there are significantly different degrees of stickiness between the three retail rates with the credit rate being the stickiest and the owner-occupied housing rate the least sticky. Although not reported, we find no statistically significant difference in the degree of price stickiness between any of the four personal loan lending rates.
| Personal Loan Rate (OECD) |
Standard Overdraft |
Base Rate (small) |
Base Rate (large) |
Credit Card |
|
|---|---|---|---|---|---|
| Standard Overdraft |
0.00 0.00 0.01 |
||||
| Base Rate (small) |
0.00 0.00 0.00 |
0.02 0.18 0.10 |
|||
| Base Rate (large) |
0.00 0.00 0.00 |
0.00 0.06 0.02 |
0.36 0.57 0.30 |
||
| Credit Card Rate |
0.10 0.06 0.06 |
0.00 0.00 0.00 |
0.00 0.00 0.00 |
0.00 0.00 0.00 |
|
| Housing Loan Rate |
0.00 0.00 0.01 |
0.00 0.00 0.01 |
0.00 0.00 0.00 |
0.00 0.00 0.00 |
0.00 0.00 0.00 |
|
Notes: 1. The entries in each cell are the marginal significance levels for the tests of the hypotheses that the coefficient on the cost of funds variable (β) in Table 1 are the same across the two relevant lending rates. The three entries in each cell relate to the three cost of funds variables. In order these three variables are:
|
|||||
Comparing the base rates for small and large business loans we are unable to reject the hypothesis that the two rates exhibit the same degree of stickiness. We are, however, able to reject the hypothesis that the standard overdraft rate is characterised by the same degree of stickiness as the base rate for large corporate loans.
In summary, the results in Tables 1 and 2 suggest the following ranking in terms of the degree of price stickiness. The credit card rate is the stickiest followed by the personal loan rate, the housing loan rate, the standard overdraft rate and finally the base rates.
The above regressions assume that adjustment of the lending rate occurs in the same period as changes in the cost of funds. Such speedy adjustment may not always take place. The transmission of the change in the cost of funds may be spread out over a number of months. Accordingly, we included a number of lags of the cost of funds in the estimated equations. Table 3 presents estimates of the sum of the coefficients on the contemporaneous and lagged variables for different lag lengths. It also reports the marginal significance levels for tests of the hypotheses that the sum of the coefficients on the lags equal one. The same number of observations have been used for all lag lengths so that the sum of the coefficients is directly comparable across different numbers of lags.
| Sum of Coefficients (marginal significance level for hypothesis test that Σβ=1) |
|||||
|---|---|---|---|---|---|
| LENDING RATE |
Number of Lags | ||||
| 0 | 1 | 3 | 6 | 9 | |
| Personal Loans | 0.26 (0.00) |
0.28 (0.00) |
0.31 (0.00) |
0.38 (0.00) |
0.43 (0.00) |
| Standard Overdraft |
0.75 (0.00) |
0.76 (0.00) |
0.81 (0.01) |
0.85 (0.04) |
0.83 (0.04) |
| Base (small) |
0.85 (0.01) |
0.87 (0.01) |
0.91 (0.06) |
0.94 (0.26) |
0.94 (0.35) |
| Base (large) |
0.92 (0.16) |
0.93 (0.20) |
0.96 (0.46) |
0.98 (0.69) |
0.97 (0.66) |
| Credit Card | 0.003 (0.00) |
−0.01 (0.00) |
0.005 (0.00) |
0.04 (0.00) |
0.04 (0.00) |
| Housing Loans |
0.45 (0.00) |
0.48 (0.00) |
0.52 (0.00) |
0.57 (0.00) |
0.63 (0.00) |
Notes: |
|||||
In all cases adding lags increases the sum of the coefficients, suggesting some delay in adjustment of lending rates. However, in general, the basic conclusions drawn from using only the contemporaneous rate remain unchanged. For the housing, credit cards and personal loan rates, the ranking in terms of the degree of stickiness is maintained. Even after nine lags are included the sum of the coefficients on all three of these rates remain significantly less than one. The same is true for the standard overdraft rate. In the case of the small business base rate it is possible to reject the hypothesis that the sum of the coefficients on the contemporaneous and lagged cost of funds equal one when only one lag is included, but it is not possible to do so when three or more lags are included. For the large loan base rate the sum of the coefficients generally increases with the addition of lags, however, it is not possible to reject the hypothesis that the sum of the coefficients equals one even when no lags are included.
If interest rates are sticky, declines in the banks' costs of funds will not be passed completely into lending rates. This incomplete pass-through during the interest rate reduction phase has sometimes led to the claim that banks are exploiting their customers by increasing their lending rates when the cost of funds increase, but not reducing their rates when the cost of funds declines[12]. One way to test such a claim is to estimate the stickiness equations with separate parameter estimates for the cases when the cost of funds decrease and increase. This is done by defining two dummy variables, one of which takes a value equal to one when the cost of funds declines, and the other takes a value equal to one when the cost of funds remains the same or increases. The cost of funds is then multiplied by each of the dummy variables to obtain two new variables which replace the original cost of funds variable in the estimated equation.
The results are reported in Table 4. For the majority of the interest rates examined it is possible to reject the hypothesis that interest rates respond symmetrically to cost of funds increases and decreases. However, in all cases the coefficient on the cost of funds is higher when the cost is decreasing. There is no evidence that banks are consistently slower to bring down their lending rates than they are to increase them. If anything, the reverse is true. For the personal lending rates, the reference rates and the home loan rate, the coefficient on the cost of funds variable is significantly greater when the cost of funds is falling than when it is increasing. However, the differences in the speed with which rates are adjusted up and down are quite small. For the credit card and the standard overdraft rate, there is no significant difference between the two coefficients.
| LENDING RATES | SAMPLE PERIOD |
α | β1 | β2 | |
SIG LEVEL H0:β1=β2 |
|---|---|---|---|---|---|---|
| Notes: 1. Standard errors appear in parentheses below the coefficient estimates. 2. UP is a dummy variable (1 when the CD rate increases) multiplied by the CD rate. DOWN is a dummy variable (1 when the CD rate decreases) multiplied by the CD rate. |
||||||
| PERSONAL RATES | ||||||
| Secured (min.) | 87:9–91:8 |
12.06 (0.96) |
0.30 (0.06) |
0.45 (0.06) |
0.65 |
0.00 |
| Secured (max.) | 87:9–91:8 |
17.11 (0.56) |
0.23 (0.05) |
0.37 (0.03) |
0.68 |
0.00 |
| Unsecured (min.) | 87:9–91:8 |
12.27 (0.86) |
0.35 (0.05) |
0.50 (0.05) |
0.67 |
0.00 |
| Unsecured (max.) | 87:9–91:8 |
17.61 (0.75) |
0.26 (0.05) |
0.39 (0.05) |
0.66 |
0.00 |
| Personal (OECD) | 86:1–91:8 |
14.68 (0.56) |
0.20 (0.04) |
0.25 (0.04) |
0.50 |
0.00 |
| OVERDRAFT RATES | ||||||
| Standard Overdraft | 86:1–90:4 |
10.20 (1.64) |
0.59 (0.12) |
0.63 (0.14) |
0.62 |
0.21 |
| Base (Small) | 86:1–91:8 |
4.99 (0.68) |
0.80 (0.04) |
0.87 (0.04) |
0.94 |
0.00 |
| Base (Large) | 86:1–91:8 |
3.67 (0.74) |
0.89 (0.05) |
0.93 (0.05) |
0.96 |
0.00 |
| OTHER RATES | ||||||
| Credit Card | 86:1–91:8 |
24.33 (2.12) |
−0.10 (0.15) |
−0.10 (0.15) |
−0.01 |
0.96 |
| Housing Loans | 86:7–91:8 |
9.15 (0.59) |
0.39 (0.04) |
0.45 (0.04) |
0.80 |
0.00 |
In Table 5 we report the results of the tests of interest rate stickiness for the pre-deregulation period commencing in January 1979 and ending in March 1985. Although there were ceilings on all lending rates (with the exception of the prime rate) before 1985, these ceilings moved to some extent with the cost of funds. Figure 2 shows the movement of the various lending rates.
| LENDING RATE |
No Lags | Sum of Coefficients {marginal
significance level for hypothesis test that  } }
|
||||
|---|---|---|---|---|---|---|
| α | β1 | Number of Lags | ||||
| 0 | 3 | 6 | 9 | |||
| Personal Loan (OECD) |
13.27 (1.62) |
0.31 (0.10) |
0.21 {0.00} |
0.29 {0.00} |
0.39 {0.00} |
0.44 {0.00} |
| Standard Overdraft |
7.63 (1.90) |
0.36 (0.12) |
0.23 {0.00} |
0.29 {0.00} |
0.39 {0.00} |
0.43 {0.00} |
| Overdrafts over $100,000 |
5.17 (0.87) |
0.66 (0.06) |
0.62 {0.00} |
0.71 {0.00} |
0.76 {0.00} |
0.78 {0.00} |
| Credit Card | 18.0 (0.00) |
0.00 (0.00) |
0.00 {0.00} |
0.00 {0.00} |
0.00 {0.00} |
0.00 {0.00} |
| Housing Loan | 7.01 (1.03) |
0.34 (0.07) |
0.28 {0.00} |
0.36 {0.00} |
0.45 {0.00} |
0.48 {0.00} |
Notes: |
||||||
As expected, the results in Table 5 show that the prime lending rate is again the most flexible interest rate. However, it is less flexible than in the deregulated period. Even when nine lags are included, the full effect of changes in the marginal cost of funds is not translated into the prime rate. The personal loan rate, the housing rate and the standard overdraft rate all show the same degree of stickiness. Again, when lags are included, the sum of the coefficients increases, but for all three interest rates the sum is always less than 0.5. The credit card rate is constant at 18 per cent through the entire sample. Comparing the pre- and post-deregulation periods, we find no change in the stickiness of the personal loan rate. We do, however, find that the housing rate and the standard overdraft rate are more flexible in the deregulated period. For the standard overdraft rate this difference is particularly pronounced. In summary, a comparison of the pre- and post-deregulation results suggests that deregulation has meant that rates on housing and business loans now move more closely with the cost of funds. In contrast, the rates on personal loans and credit cards do not appear to be more flexible in the deregulated period.
As one final exercise, we examine the behaviour of a number of lending rates in other countries. The results are reported in Table 6. The degree of loan rate stickiness in the other countries examined is similar to that for Australia. In all three cases, the coefficient on the prime rate exceeds 0.9. For the U.S. and the U.K., it is not possible to reject the hypothesis that the coefficient on the cost of funds is different from one. While the hypothesis can be statistically rejected for the Canadian prime rate regression, the coefficient is economically close to one. As is the case in Australia, the housing rate in the U.K. exhibits considerably more stickiness than the prime rate; the hypothesis that the coefficient equals one can be easily rejected. Similarly, the credit card rate in the U.S. exhibits extreme stickiness, bearing virtually no relationship to the marginal cost of funds; again a similar result to the Australian case.
| LENDING RATES | SAMPLE PERIOD | α | β | |
|---|---|---|---|---|
| UNITED STATES | ||||
| Prime | 85:1–91:8 |
2.41 (0.81) |
0.96 (0.10) |
0.86 |
| Credit Card | 85:2–91:8 |
17.97 (0.40) |
0.03 (0.07) |
−0.03 |
| UNITED KINGDOM | ||||
| Prime | 85:1–91:8 |
0.27 (0.27) |
0.99 (0.02) |
0.98 |
| Housing | 85:1–91:8 |
4.10 (0.72) |
0.73 (0.06) |
0.78 |
| CANADA | ||||
| Prime | 85:1–91:8 |
2.11 (0.25) |
0.91 (0.02) |
0.96 |
Notes: |
||||
3.3 Discussion
Clearly, there are different degrees of flexibility in the loans rates of various lending products. While our tests do not allow us to distinguish accurately between the different theories of loan rate stickiness discussed in Section 2, the results do suggest a number of conclusions.
First, the fact that the minimum and maximum secured and unsecured personal loan rates all exhibit the same degree of stickiness, suggests that the credit rationing argument is not solely responsible for the stickiness of personal loan rates. If the credit rationing argument were correct, then one would expect that the maximum rate on unsecured loans would exhibit greater stickiness than the minimum rate on secured loans. The maximum unsecured rate is charged to those customers whose “type” the bank is most unsure of. In contrast, the bank is more likely to be able to observe the type of customers who provide the bank with collateral and are charged the minimum rate. Thus, if any class of borrowers were to be credit rationed, it should be those customers paying the highest rate. There is no evidence that the interest rate charged to these customers responds any differently than that charged to other personal loan customers. While the possibility exists that all personal loan customers are credit rationed and thus all rates behave in the same manner, we view this as unlikely. Instead, we regard switching costs, especially search costs, as the likely explanation of the stickiness in personal loan rates.
We suggest a similar explanation for the stickiness in housing loan rates. Housing lending is considered to be amongst the safest forms of bank lending. Banks are able to inspect and value the collateral for these loans, and the actions of the borrower are unlikely to prejudice the value of the collateral or the “outcome of the project”. Neither are there significant problems in working out the type of the borrower, as most projects (i.e., houses) are of similar risk. Thus, we view the credit rationing explanation as being an unlikely source of the stickiness in the owner-occupied housing rate.
As discussed above, the switching costs of moving from one housing loan to another are high, especially when mortgage stamp duty is taken into account. Mortgages typically have had loan establishment fees which vary according to the size of the mortgage. For a $100,000 mortgage loan establishment fees have typically exceeded $1,000 although in recent times there appears to have been some reduction in these fees. In addition, to move a mortgage of $100,000 from one bank to another costs approximately $340 in stamp duty[13]. Furthermore, some banks charge an early repayment fee amounting to one months interest payment if the loan is paid out early. Finally, there are the standard search and information costs of applying for a new housing loan. All these various costs make it a costly exercise for the borrower to switch banks. The theory presented in Section 2 suggests that these costs cause stickiness in the housing rate.
The risk sharing argument may also play some role in explaining the stickiness of the housing rate. The household sector is, in all likelihood, more risk averse than shareholders of the banks. As discussed in Section 2, the stickiness of the loan rate on owner-occupied housing may be, in part, due to an implicit insurance contract between the bank and its customers. Conditional upon the CD rate being the appropriate marginal cost of funds for housing lending, the implicit ex post risk premium does not seem to have been very large. Over the period January 1987 to August 1991 the housing rate was, on average, 1.13 percentage points above the CD rate, while the prime rate was 2.03% above the CD rate[14].
In recent times, competition in the housing and business lending sector has seen reductions in switching costs. At least one bank has waived the usual establishment fee for business customers of another bank. It has also promised to pay the government stamp duty and financial institutions duty on opening a new account. Such developments, if they become more widespread, should ensure that interest rates follow the cost of funds more closely.
However, there is the possibility that these policies may only be an attempt to increase market share, with the special discounts being removed in the second period when the bank has “captured” its new customers. Second period prices can then be increased without fear of losing customers. If consumers anticipate this behaviour, then these first period cost reducing policies will be of limited success in gaining market share.
The credit card industry is another market where both search and switching costs are likely to be present. Consumers face some information costs when determining the lowest interest rate offered by banks on their credit cards. They also face the costs of time and effort of applying for a card, and the cost of the time lag between applying for a card and receiving one. These costs are, however, small compared to those incurred in switching a mortgage from one bank to another.
Ausubel (1991), using U.S. data, finds that switching costs are not large enough to be the sole explanation for the credit card rate stickiness. Instead, he argues consumer irrationality may exist, leading to the reverse adverse selection problem described in Section 2. Ausubel presents some evidence from a respected consumers survey report indicating that the majority of consumers say that they fully pay the outstanding balance on their credit card. However, bank data on credit card usage indicates that the number of accounts incurring credit card rate charges is in excess of 75 per cent. Consumers, in effect, say one thing but do another. Some prima facia evidence for reverse adverse selection can be found by looking at Figure 2. Over the period of study, credit card interest rates have monotonically increased, even though the cost of funds has both increased and decreased over the same period.
If reverse adverse selection characterises the credit card market, then in certain circumstances, there may exist a role for government to encourage lower rates of interest on cards. If a single bank attempts to lower its credit card rate unilaterally, it will primarily attract the interest sensitive customers. These customers represent high risk borrowers. Thus, when a single bank reduces its credit card rate, it worsens its pool of customers. In this case, declines in the marginal cost of funds may not be translated in changes in credit card rates as no bank wishes to move first. In such an environment, a co-ordinated reduction in interest rates may be desirable. This co-ordination could come through government initiatives.
The evidence on the base rates suggest that the small business rate may move slightly more slowly than the large rate, although the differences are statistically insignificant. They both appear to move in line with the CD rate. On the other hand, the standard rate is considerably more sticky. This apparent contradiction can be partially resolved by recalling that the base rate is the rate offered to the bank's best small business borrowers. The standard rate is the rate applicable to the bank's average small business borrowers. The fact that the average rate is sticky suggests that some of the rates across the spectrum of a banks small business customer base are sticky. One would expect the banks to be lending at or near the base rate to their best business customers. This implies the remaining, (higher risk) borrowers face stickier interest rates. This result is not inconsistent with credit rationing. Because of information and monitoring problems, the riskier small business borrowers are more likely to be credit rationed, causing their interest rates to be sticky.
The move to quote all business lending rates as a margin over a base rate may have caused lending rates to all business groups to move more closely in line with the marginal cost of funds; that is, there may have been a change in the pricing policy of banks. Given the lack of appropriate data we are unable to test this hypothesis.
Footnotes
Between 1956 and 1962 a maximum for the average overdraft rate charged was also set. [10]
 is the variance of the measurement error and
  is
the variance of the explanatory variable (in this case the measured marginal cost of
funds). It can be seen that the coefficient is asymptotically biased towards zero and
that the extent of the bias is a function of the ratio of the measurement error variance
to the variance in the cost of funds. To the extent that any measurement error exists in
our measure of the marginal cost of funds, its variance is likely to be small relative
to that of the variance of the measured cost of funds. Any asymptotic bias due to
measurement error is thus likely to be small.
[11]
is
the variance of the explanatory variable (in this case the measured marginal cost of
funds). It can be seen that the coefficient is asymptotically biased towards zero and
that the extent of the bias is a function of the ratio of the measurement error variance
to the variance in the cost of funds. To the extent that any measurement error exists in
our measure of the marginal cost of funds, its variance is likely to be small relative
to that of the variance of the measured cost of funds. Any asymptotic bias due to
measurement error is thus likely to be small.
[11]
For example, when monetary policy was eased in November 1991, some consumers complained banks were not passing on the interest rate cuts fully to mortgage rates. See Gittins (1991) for an account of the debate. [12]
The establishment fee on mortgages is based on the amount of the loan with the fee increasing with the loan size but at a decreasing rate. The stamp duty is calculated as $7.50 on the first $16,000 and $4.00 on each $1,000 thereafter. Some banks also charge a registration fee, a discharge fee, and a title search fee. These fees amount to approximately an additional $100.00. [13]
The National Australia Bank's submission to the “Martin Inquiry” (1991) into the banking industry, stated “we see housing lending as involving a long term relationship with customers and the household sector preferring a degree of stability in the interest rates which they face.” [14]