RDP 9104: Cross-Country Relationship Between Interest Rates and Inflation over Three Decades 2. Nominal Interest Rates and Inflation: 1961–1989
June 1991
- Download the Paper 929KB
(a) Data
As a first step in analysing the data, the 1961 to 1989 period is broken down into a number of sub-periods. Although partly arbitrary, it is an attempt to group years of similar economic experience:
| 1961–1969: | a period of low world inflation and high output growth; |
| 1970–1972: | pre-first oil shock; |
| 1973–1979: | a period characterised by high and variable inflation and lower output growth after the first oil shock. This is broken down into two shorter periods; 1973–1974 and 1975–1979. Monetary targeting commenced around 1975 for most countries in the sample; |
| 1980–1983: | after the second oil shock inflation increased again throughout the OECD and then fell later in the period; |
| 1984–1989: | a period of relatively low inflation for many countries and strong output growth. Many countries had either deregulated or were in the process of deregulating their financial systems by this time. |
For each period and each country, an average inflation rate and an average interest rate (both nominal and real) are calculated[1]. These points are then plotted on a graph with inflation on the horizontal scale and interest rates on the vertical scale. In addition, the line of best fit is estimated using OLS:
where i (r) is the average nominal (real) interest rate for a country in the relevant sub-period and π is the average inflation rate. The regression results are reported in tables in Appendix 2[2] and the slope coefficients from those regressions are also reported on the graphs (a * indicates that the coefficient is significantly different from zero at the 5 per cent level). No causation is implied by these regressions.
The number of countries included in each sample period varies, depending on the availability of a consistent time series for interest rates. For short-term interest rates, the sample for 1961–69 includes Belgium, Canada, France, Italy, Japan, the Netherlands, Sweden, Switzerland, the United Kingdom, the United States and West Germany. In the 1970–72 period, Australia, Austria and Ireland are added; Norway and Denmark are added from 1973. New Zealand and Spain are added from 1975 to bring the country total to 18. For long-term interest rates, all countries except Austria, Japan and Spain are in the sample from 1961; Austria and Japan are added in 1970 while Spain is added in 1980. Interest rates are market determined wherever possible. Details on the specific interest rates used, the measures of inflation and the sources are contained in Appendix 1.
(b) Short-Term Interest Rates and Inflation
(i) Nominal Short-Term Interest Rates
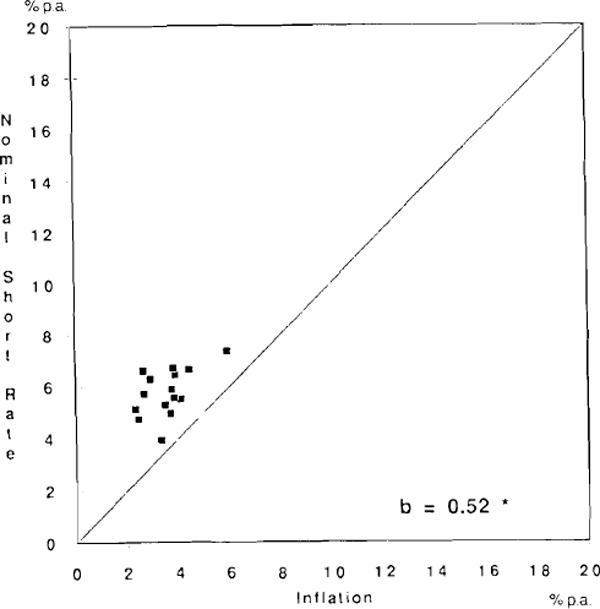
Graphs 1 to 6 show the relationship between average inflation rates and average nominal interest rates for each of the periods listed above.[3]

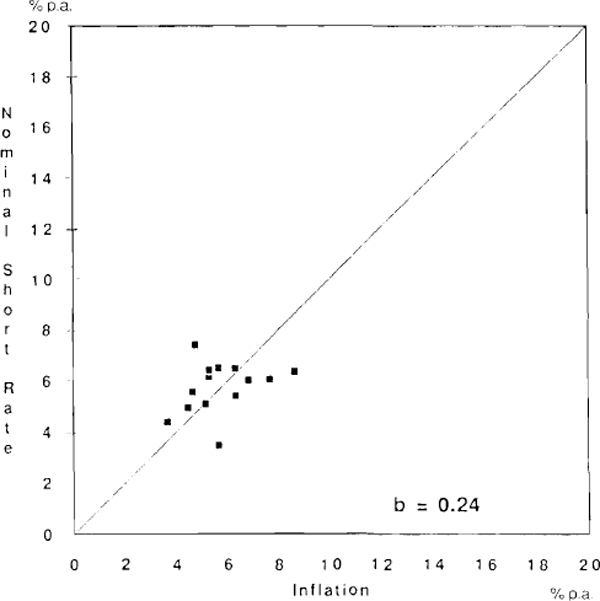
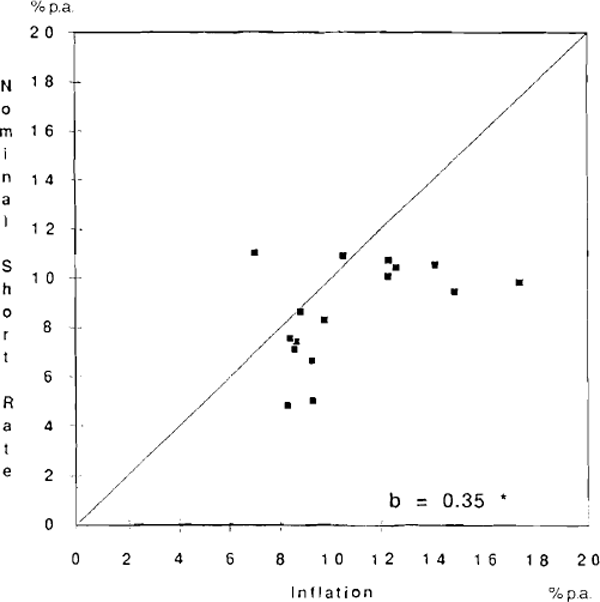
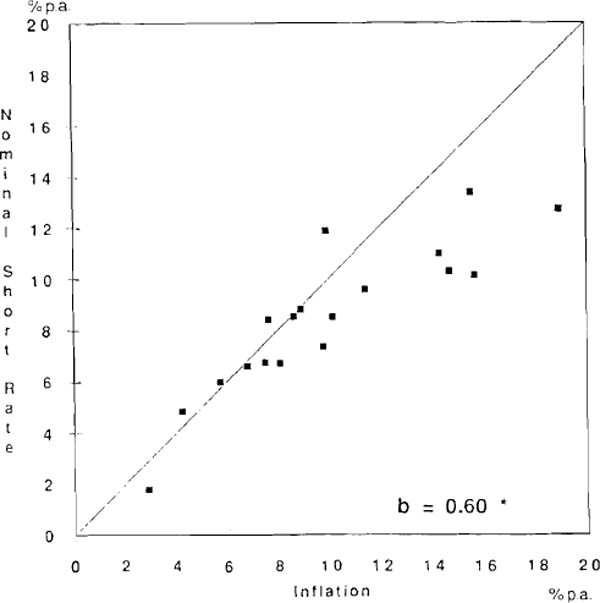
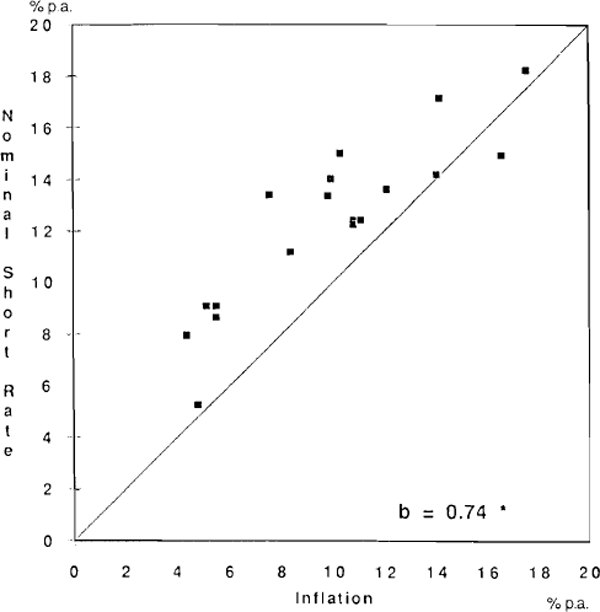
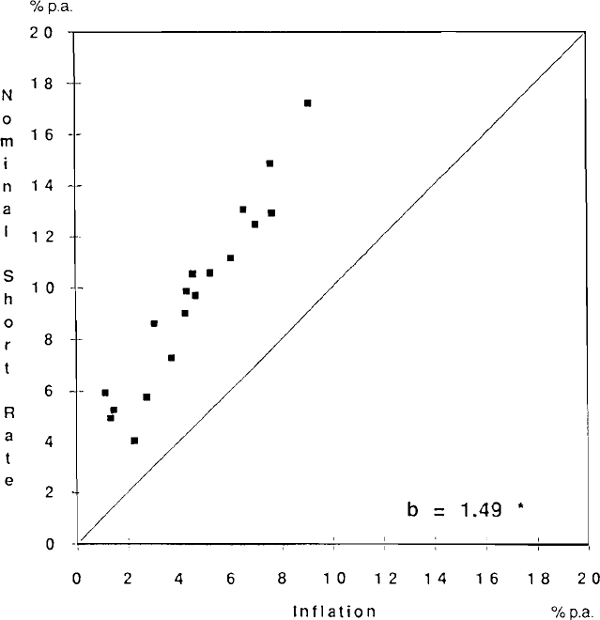
Graph 1 shows that over the 1960s, inflation rates and nominal short-term interest rates were both fairly low. The slope coefficient of 1.07 indicates that on average, the relationship was one-for-one; for every percentage point that inflation was higher, nominal interest rates were on average one percentage point higher.
By 1970–1972 inflation throughout the OECD had risen. As Graph 2 shows, the cluster of countries shifted up the 45 degree line as nominal interest rates rose. There is no obvious relationship; the slope coefficient of 0.24 suggests that on average there is a positive relationship but it is insignificantly different from zero.
In the 1973–1979 period inflation rose strongly in nearly all the major OECD economies. Graphs 3 and 4 show this in two sub-periods: 1973–74 and 1975–79. In the 1973–74 period the slope coefficient was positive and significantly different from zero. Over the 1975–79 period, the relationship between nominal interest rates and inflation strengthened. The slope coefficient rose but remained less than one.
In 1980–1983 the cluster of outcomes shifted to lie above the 45 degree line, but the points remained fairly dispersed. This suggests a tightening in monetary policies throughout the OECD during this period. By the 1984–1989 period, the cluster had shifted to lie even more significantly above the 45 degree line. More interesting though is that the slope coefficient in this period is significantly greater than unity. This observation is consistent with a couple of hypotheses which will be discussed below.
(ii) Real Short-Term Interest Rates
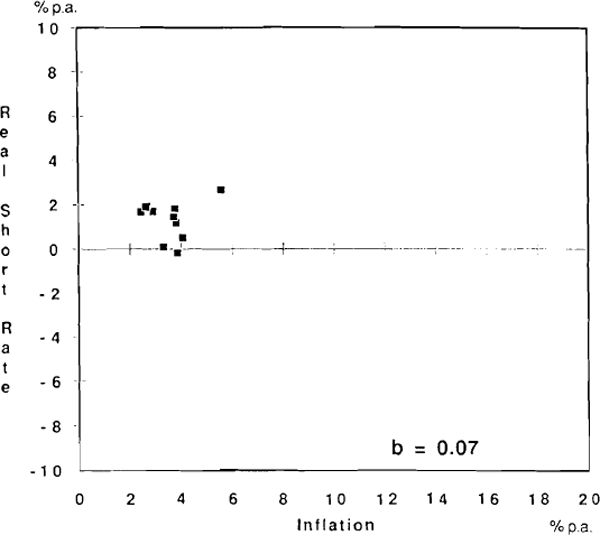
In the previous section, the relationship between real short-term interest rates and inflation could be determined with reference to a 45 degree line. The following graphs present this information in a more direct way. For each period, the graphs show the relationship between real short-term interest rates and inflation across countries. Regression coefficients are reported on the graphs and in Appendix 2.
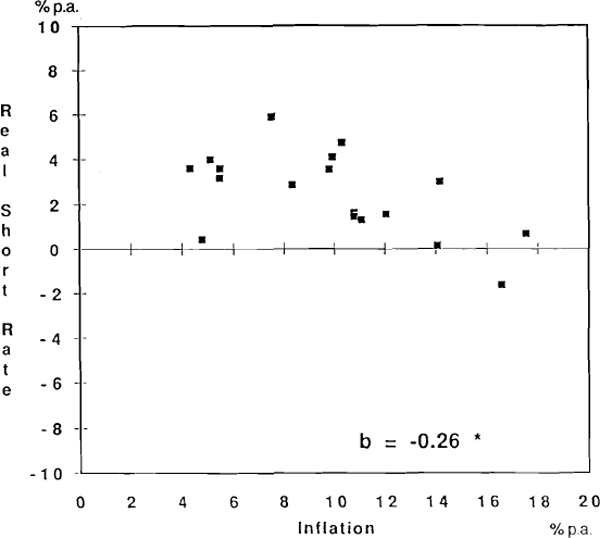
During the 1960s there is no obvious relationship between real short-term interest rates and inflation (see Graph 7). This is supported by the slope coefficient which is small (0.07) and insignificant. But from 1970 through to 1979, there were many cases of negative real interest rates.[4] More importantly, the relationship between inflation and real short-term interest rates had become negative (Graphs 8,9 and 10). For 1970–1972 and 1973–74, the slope coefficient is around −0.7 and significant. The relationship weakens in the second half of the 1970s but remains negative.
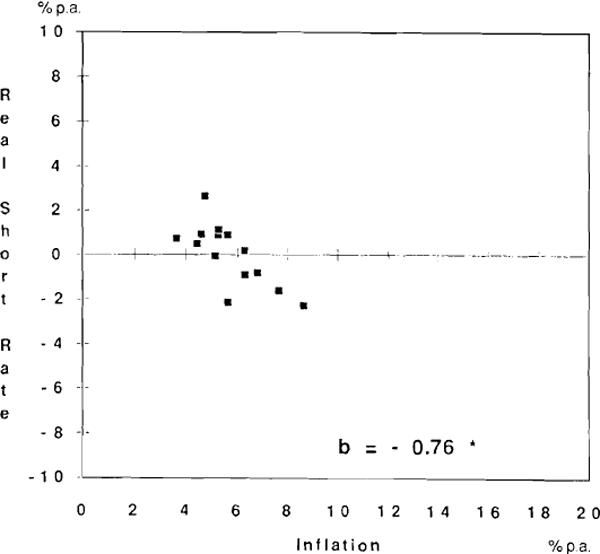
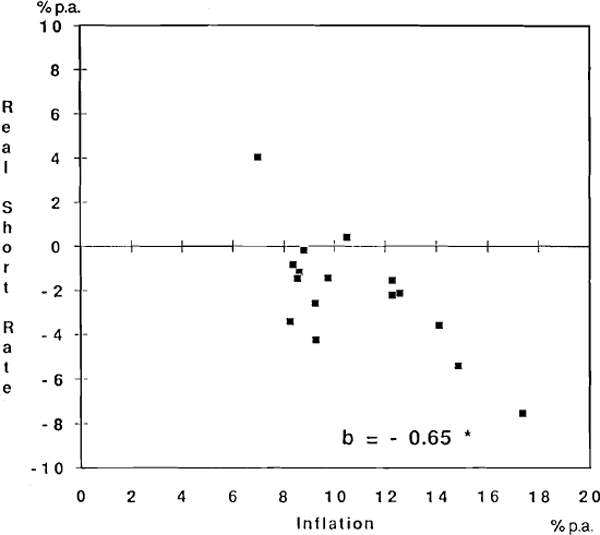
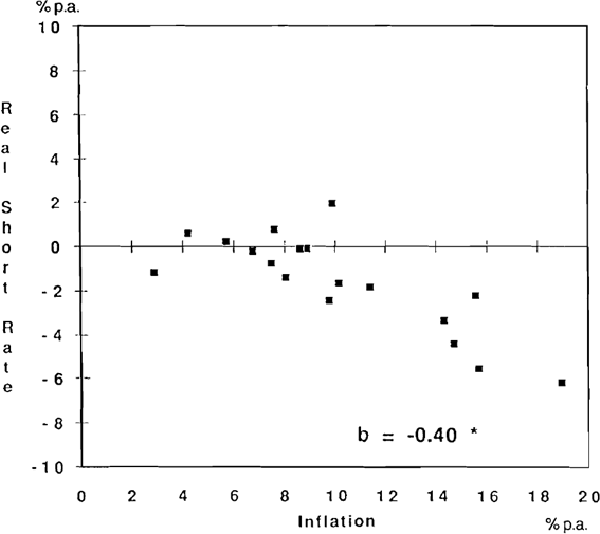
By the 1980–1983 period however, the relationship between inflation and real short-term interest rates had shifted upwards (see Graph 11). Most countries had at least zero if not positive real short-term interest rates. Furthermore, the negative relationship which was quite strong in the early 1970s had weakened further. Countries such as Australia and Japan had a similar level of real short-term interest rates but Japan's average inflation rate was about 6 percentage points lower than Australia's.
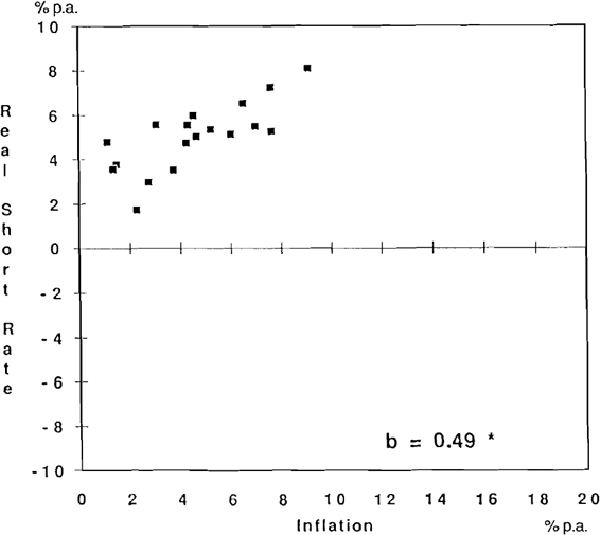
A relationship re-emerged in the 1984–1989 period but it was the opposite to that in the 1970s (see Graph 12)[5]. In this period, there is a positive relationship between inflation and real short-term interest rates; the slope coefficient is 0.49 and significant. Countries with higher inflation tended to have higher real short-term interest rates.
As is obvious from a glance at Appendix 1, the data on short-term interest rates is a mixture of rates on short-term government securities and private sector rates, the mixture being dictated by data availability. But private sector assets such as bank bills will have a risk premium on government securities of similar maturity. Since the relationship between real short-term interest rates and inflation in the second half of the 1980s is so striking, it is worth confirming that the relationship is not a product of the mixture of data.
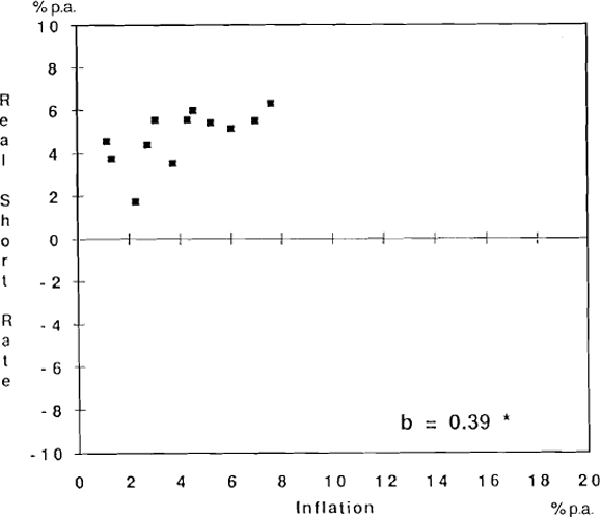
It was not possible to obtain interest rates on short-term government securities for all 18 countries in the sample. Ten countries had a three month government security yield while two more countries had a rate on a security of unknown maturity. A scatter plot of all twelve countries confirms the relationship observed above (see Graph 13). Real short-term interest rates are higher in high inflation countries. The OLS estimate of the slope coefficient is 0.39; smaller than the coefficient found in the sample of 18 countries but nevertheless significantly different from zero. So the relationship does not appear to be the result of different risk characteristics of assets.[6]
To summarise the important observations on short-term interest rates:
- through most of the 1970s and 1980s, there was a positive relationship between inflation and nominal short-term interest rates;
- through most of the 1970s there was a negative relationship between inflation and real short-term interest rates; and
- in the second half of the 1980s, there was a positive relationship between inflation and real short-term interest rates.
(c) Long-Term Interest Rates and Inflation[7]
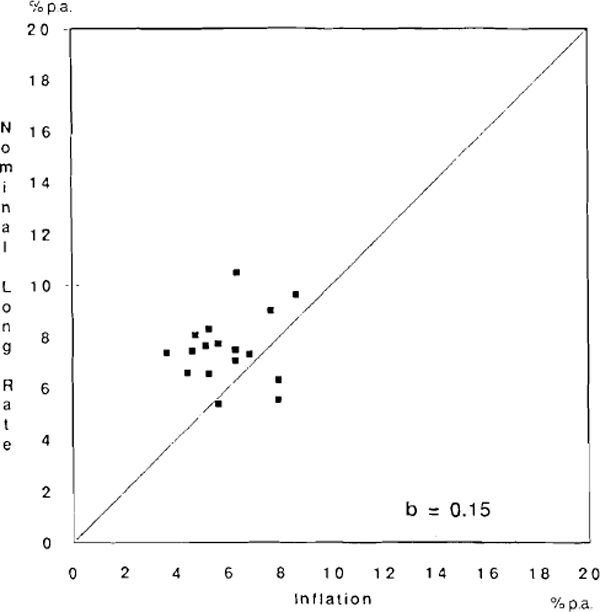
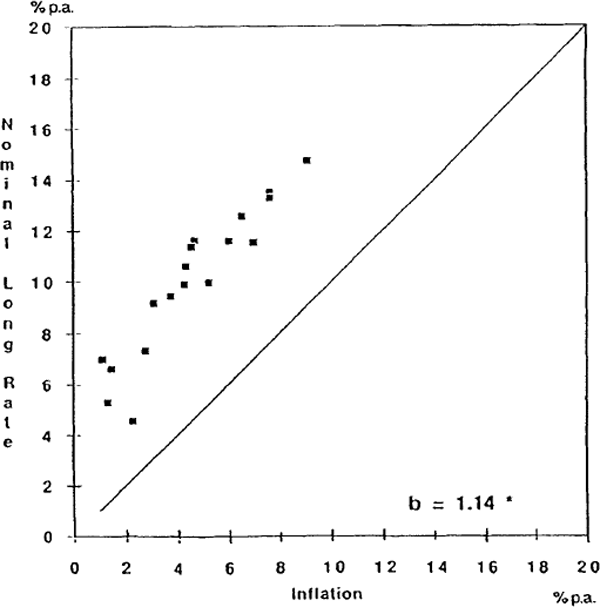
Graphs 14 to 19 show that, as for short-term interest rates, there tends to be a positive relationship between nominal long-term interest rates and inflation, although it is not very strong in some of the early periods. For real long-term interest rates, the regressions indicate a negative relationship in the 1960s and early 1970s (Graphs 14 and 15).
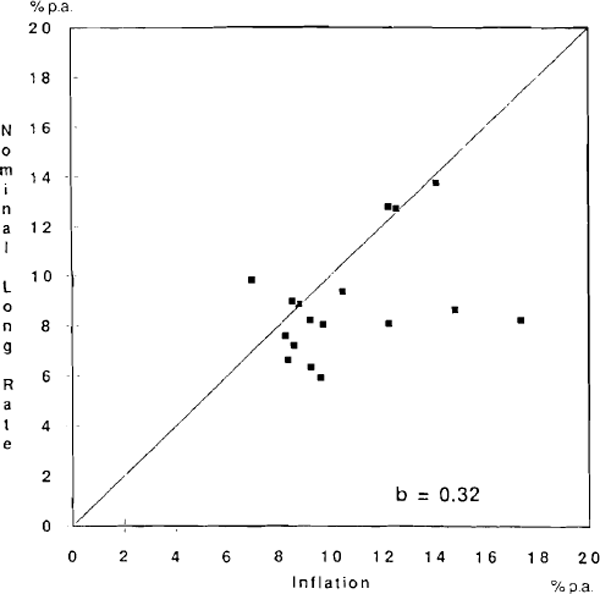
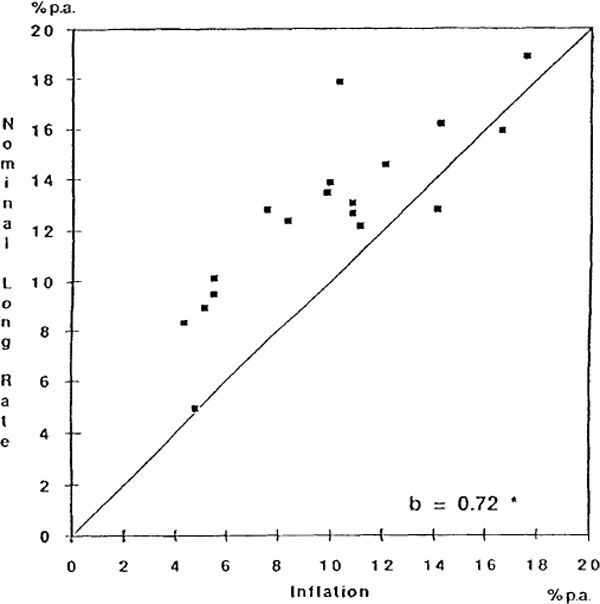
The relationship appeared to change from the mid 1970s. Graphs 16 and 17 show that the observations are much more dispersed (essentially due to more dispersed inflation rates) than in earlier periods and that there is a positive relationship between nominal long-term interest rates and inflation. Furthermore, the slope is less than one which implies that there is a negative relationship between real long-term interest rates and inflation from 1973 to 1979. This is precisely what was observed for short-term rates.
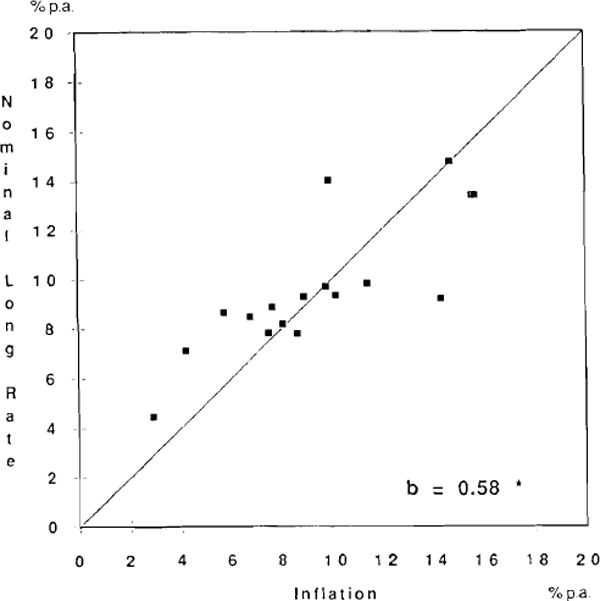
In 1984–89 there appeared to be a further change in the relationship between inflation and real interest rates. There is a significant positive relationship between nominal long-term interest rates and inflation – approximately one-for-one (see Graph 19). In other words, long-term real interest rates tend to be equalised across countries. The regression coefficient, br, is insignificantly different from zero supporting the conclusion that real long-term interest rates are equalised across countries for this period. This is in contrast to earlier periods and in contrast to real short-term rates.
Footnotes
The data are calculated as follows:
(a) Average inflation rate: Quarterly data on consumer price indices (CPI) are used to
calculate four-quarter ended percentage changes in consumer prices – the inflation
rate. For most countries in the sample, the CPI is a monthly series so a quarterly CPI
is calculated by averaging the indices over the three months of the quarter. For each
period, the average inflation rate is the average of the quarterly data on the
four-quarter ended percentage changes in the CPI.
(b) Average nominal interest rate: For each period an average of monthly data on
interest rates is calculated.
(c) Average real interest rate: The average inflation rate for a period is subtracted
from the average nominal interest rate for the same period. This is the same as
calculating a real interest rate for each quarter and then averaging the real interest
rate over the period.
Looking at real interest rates over a period of time as is
done in this note should reduce the problem of how real rates are measured and make the
results less dependent on the measure used. However, in periods of variable inflation,
there may be some difficulties as noted in footnote 4.
[1]
Since the level of real interest rates will also impact on the rate of inflation, π is strictly endogenous. As a result, the coefficient estimates will be asymptotically biased. It can be shown that if b>0, the coefficient estimate of b will be biased downwards. If b<0 the bias could be positive or negative, depending on how large an effect real interest rates have on inflation. If changes in real interest rates have a large impact on inflation then the estimate of b will be biased upwards. In what follows, the sign of b is not obvious. If b>0 in the 1980s (as the following sections suggest), then the OLS estimate of b will understate the positive association between real interest rates and inflation. [2]
A 45 degree line is drawn to help in assessing the graphs. Points on the line imply zero average real interest rates. Above the line represents positive real rates and below the line negative. Problems with this interpretation are noted below. The graphs do not identify individual countries because, as noted in the introduction, the paper is attempting to identify more general relationships. [3]
Note that in this instance, the proxy used for real interest rates may be misleading. Since the rates of inflation experienced during this period were outside most people's experience, inflationary expectations may have been vastly different from the actual inflation rate, probably lower. Hence it is possible that expected real interest rates were not as negative as indicated by the measure used here. [4]
In the 1984–89 period a goods and services tax (GST) was introduced in New Zealand. As a result, the measured consumer price inflation rate was pushed up sharply. In 1987, the 12 month ended change in the CPI was sometimes 7½ percentage points higher than it would have been with the impact of the GST removed. In the graph and regressions, the New Zealand inflation rate is measured excluding the GST. There are some other countries in which CPIs were affected by consumption taxes or value added taxes but compared with the New Zealand case, the impact was relatively minor so no adjustments have been made. In the case of Australia, adjustments have been made to take into account the effect on measured inflation of Medibank and Medicare. [5]
Note that New Zealand had very high real interest rates during this period but is not included in graph 13. Market determined rates for New Zealand Treasury bills are available from 1986. When graph 13 is reproduced for the period 1986–1989 to include New Zealand (and France can then be included as well), the conclusion is strengthened. [6]
Only graphs of the relationship between nominal long-term interest rates and inflation are shown. The real interest rates/inflation relationship is discussed with reference to the 45 degree line. Regression results are reported on the graphs (noting that br = 1−bn) and in Appendix 2. [7]
