RBA Annual Conference – 2018 The Transmission of Monetary Policy through Banks' Balance Sheets Anthony Brassil, Jon Cheshire and Joseph Muscatello[*]
1. Introduction
The Reserve Bank of Australia's (RBA's) policy rate (known as the ‘cash rate’) is not directly linked to the interest rates Australians pay on their mortgages, nor the rates they receive on their deposits.[1] These rates are mostly determined by the banking system.[2] However, the cash rate does have a strong indirect effect on these rates through its effect on banks' cost of funding (the interest rates banks pay on their liabilities and the banks' cost of equity). The question we seek to address is ‘how much does the cash rate influence banks' lending and deposit rates?’
This is an important question for the RBA – understanding how cash rate changes are passed through to banks' lending and deposit rates ensures the RBA can set its cash rate target appropriately to achieve its goals. Knowledge of how pass-through is influenced by the level of the cash rate is also important for ascertaining any limits on pass-through.
While there are a number of monetary policy transmission channels (see Atkin and La Cava (2017) for an exposition), from the perspective of Australian households, the transmission through banks' lending and deposit rates is the most explicit; almost one-quarter of working-age Australians currently have a bank loan, while almost all have a deposit account (World Bank 2017). Therefore, correcting any mistaken perceptions about pass-through is important for households' decision-making. For example, if households erroneously believe the link between the cash rate and lending rates has weakened, they may underestimate the effect future cash rate increases will have on their mortgage rates, potentially leading to mortgage stress when these increases occur. On the other hand, erroneously believing future cash rate reductions will not be passed through would dampen the effect monetary policy has via households' forward-looking decision-making (e.g. the consumption versus saving decision).
Unfortunately, determining how much the cash rate influences banks' lending and deposit rates is not straightforward. This is because banks' lending and deposit rates are influenced by many factors other than the cash rate (and expectations of future cash rates), and it is difficult to distinguish the influence of the cash rate from these other factors.
Included in these other factors are the various risks that banks take into account when setting interest rates. These include the risk of the borrower not repaying the loan (credit risk), the risk to the bank of not having the money available for withdrawal requests (liquidity risk), and the risk that future short-term interest rates will not turn out as expected (interest rate risk). Banks' rates are further influenced by banking regulations, competition, and conditions in banks' various funding markets (including offshore markets).
By focusing on the cash rate we do not mean to suggest that these other factors are unimportant. During the late 1980s and 1990s, increased competition following the deregulation of the financial system caused a large reduction in the major banks' net interest margins (RBA 2014b). More recently, the global financial crisis prompted disruptions to banks' funding markets, changes in risk perception, and regulatory changes (e.g. Davies, Naughtin and Wong 2009; RBA 2014b).[3]
Rather, these other factors are not the focus of this paper (they are, however, examined in regular RBA analyses – see, for example, annual RBA Bulletin articles on banks' funding from Davies et al (2009) to McKinnon (2018)). As the focus of this paper is the influence of the cash rate on banks' lending and deposit rates, it is important to abstract from changes in these other factors to determine the influence of the cash rate.
To show why it is important to abstract from these other factors, Table 1 provides pass-through estimates from regressions that do not control for changes in any other factors that influence banks' interest rates. In the 1986–94 subset, the deviations of these estimates from unity partly reflected regulations, competition, and changes in risk (Lowe 1995). In the two post-2007 subsets, the pass-through estimates differ markedly from the estimates in this paper that properly control for the other factors.
| 1986–94(a) | 1997–2006 | 2007–11 | 2012–17 | |
|---|---|---|---|---|
| Housing (variable) | 0.56 | 1.00 | 0.75 | 0.80 |
| Large business (variable) | 0.83 | 0.72 | 0.75 | 1.24 |
| Credit card (variable) | 0.36 | 0.81 | 0.08 | −0.06 |
| Term deposit (1 month) | 0.75 | 0.71 | 0.27 | 0.57 |
| Term deposit (12 months) | 0.78 | 1.07 | 0.59 | 1.12 |
|
Notes: Each number is the ordinary least squares estimate of the slope
coefficient in a simple linear regression of the bank interest rate on
the cash rate Sources: Authors' calculations; Lowe (1995); RBA |
||||
Since properly abstracting from the other influences on banks' rates is difficult, Table 1 likely reflects people's perceptions of monetary policy pass-through. For the decade from 1997, people were used to seeing variable home loan rates move one-for-one with the cash rate. The fall in the simple pass-through estimates since the onset of the financial crisis may have caused people to think the potency of monetary policy has diminished. This paper seeks to provide a more accurate estimate of monetary policy pass-through.
1.1 Summary of our approach and results
A common approach to estimating monetary policy pass-through is to directly analyse the effect of cash rate changes on various lending and deposit rates. This approach (discussed in Section 2) presents some significant challenges for separately identifying pass-through from the aforementioned ‘other factors’ that influence banks' rates. Instead, we create a novel framework for indirectly measuring the pass-through of monetary policy that overcomes many of these challenges. Specifically, we:
- construct a detailed model of banks' balance sheets, incomes, and expenses;
- calibrate this model using data the major banks report to the Australian Prudential Regulation Authority (APRA) and interest rate data held by the RBA (accuracy is assessed by comparing other more aggregated data to the equivalent aggregates produced by our model);
-
determine the effect of the cash rate (and expectations of future cash rates) on what we
define as the ‘non-discretionary’ components of the banks' balance
sheets (Table 2);
- the non-discretionary components are those where the banks have little control over pricing, either because they are price takers in the respective markets (e.g. wholesale debt funding and securities held as assets), the price is fixed by virtue of the product (e.g. non-interest bearing deposits), or because of regulations defining how the price must be set (e.g. provisions for expected losses);
- determine the effect of the cash rate on return on equity (ROE); and
- use the balance sheet identity to equate this ‘intermediate pass-through’ to the non-discretionary components and ROE with the pass-through to discretionary lending and deposit rates.[4]
| Assets | Funding | |
|---|---|---|
| Non-discretionary | Cash and liquid assets Securities Provisions(a) |
No-/low-interest deposits Wholesale debt(b) Wholesale deposits(c) |
| Discretionary | Loans | At-call high-interest deposits Term deposits Equity |
|
Notes: (a) Provisions subtract from the value of assets |
||
This approach has several advantages over existing approaches. By looking at each part of the balance sheet separately, we are able to model each component in the way most appropriate for that component (so we can more accurately control for the other factors mentioned above). And by focusing our analysis on the non-discretionary components of the banks' balance sheets, our analysis is not influenced by unobserved changes in banks' pricing decisions (e.g. due to changes in demand for particular funding sources).
Moreover, we are able to determine whether the intermediate pass-through to some components offsets the intermediate pass-through to others; this is important as these components may change in size in the future. We can evaluate whether the speed of intermediate pass-through differs between components, and can identify any differing nonlinearities. And for components with long maturities or interest rate hedges, we can determine when the peak effect of any cash rate change will occur.
We document several interesting findings:
- The major banks' assets and liabilities have similar repricing structures, and almost all of the remaining interest rate risk is hedged. Therefore, changes in the cash rate do not have the mechanical effect on net interest spreads that they would if assets and liabilities repriced at different speeds. This differs from other banking systems where repricing mismatch is a more important component of policy transmission.
- We estimate that the major banks source around 9 per cent of their debt funding from deposits that pay either no interest or a low fixed rate of interest (henceforth, no-/low-interest deposits). Cash rate reductions increase the relative cost of these deposits, but the banks smooth this adjustment through hedging. Our model can estimate both the relative cost increase and the timing of these smoothed cost increases. These deposits have directly contributed 23 basis points to the major banks' relative cost of debt funding since January 2007 (relative to current and expected cash rates); they are now among the largest contributors to the increase in the majors' relative debt funding costs since 2007. Due to the smoothing, we estimate that the direct contribution of these deposits will peak at 31 basis points around the end of 2020.
- Recently, the low level of the cash rate may have caused depositors to shift away from higher interest deposits into no-/low-interest deposits; this would partially offset the above direct effect (by a maximum of 8 basis points).
-
We find that the major banks' provisions for potential future losses have a positive
relationship with the cash rate (new provisions effect profitability and may therefore
influence pass-through). This is expected; after controlling for changes in
macroeconomic conditions (and forecasts of these conditions), lower interest rates
reduce both the probability of borrower default (due to lower required repayments) and
the expected loss given default (due to higher asset prices).
- Cutting the cash rate from 7.25 per cent to 1.5 per cent is estimated to have reduced annual provisioning rates by 41 basis points.
- The major banks' cash and liquid assets spread has a negative relationship with the cash rate, consistent with several of the assets within this category not paying interest. However, this asset category makes up just 3 per cent of the major banks' balance sheets, so we estimate that these assets increase the major banks' relative return on assets by 2 basis points per 100 basis point reduction in the cash rate.[5]
- While the timing of the effects have differed, the features identified above have been partially offsetting and have had a small aggregate effect. In aggregate, intermediate pass-through has been slightly amplified by these non-discretionary components. On average since 2003, intermediate pass-through to these non-discretionary components has been 103 to 109 basis points per 100 basis point cash rate change.
-
Our estimates suggest that, between 2003 and 2012, the major banks' ROE moved to
offset the non-discretionary amplification, such that aggregate pass-through to lending
and deposit rates was broadly one-for-one. Conversely, from mid 2012, ROE has moved to
offset changes in provisioning rates, but has not moved with either the cash rate or the
remaining non-discretionary components. This has more than offset the amplification
coming from the non-discretionary components, such that aggregate pass-through to
lending and deposit rates has been less than one-for-one since mid 2012.
- That said, with equity comprising around 8 per cent of the majors' funding, the aggregate effect is small. If this intermediate pass-through were spread evenly across the majors' discretionary lending and deposit rates, the deviation from one-for-one pass-through would be around 11 basis points for every 100 basis point change in the cash rate since mid 2012. In other words, aggregate pass-through has been around 90 per cent since mid 2012. So this channel of monetary policy transmission is still very effective (in contrast to the estimates in Table 1).
Importantly, further substitutions into no-/low-interest deposits will increase the direct funding cost impact of any further cash rate reductions (assuming these deposit rates remain fixed). While the process of substituting to these no-/low-interest deposits will offset the direct effect in the near term, there is a limit to how much this can offset the increasing direct impact. Therefore, there is a point beyond which we would expect the pass-through from cash rate reductions to be much lower than what we have estimated in this paper.[6]
To the extent that shareholders value an ROE that does not move with the cash rate, increasing the correlation between ROE and the cash rate may increase the future cost of equity, thereby increasing future average prices for the banks' customers. Evaluating the size of this trade-off, and whether the banks' customers would prefer lower average prices or greater pass-through, is beyond the scope of this paper.
2. Literature Review and Our Approach
The pass-through of monetary policy to banks' lending and deposit rates has been well researched internationally. In recent years this has included analysis of the effects of zero or negative interest rates amid concerns about whether banks would pass through interest rate decreases, and what impact this would have on both their profitability and financial stability more broadly (e.g. Cœuré 2012; Bech and Malkhozov 2016).
Importantly, bank profitability and interest rate pass-through are two sides of the same coin; any change to a bank's non-discretionary funding costs requires a change in its ROE and/or a change in lending/deposit rates. So the literature estimating pass-through is connected to the literature estimating the impact of low interest rates on banks' profitability.
Theoretically, there are several reasons why monetary policy changes may not be fully passed through to lending and deposit rates. There is the traditional view of banks as institutions that lend at long maturities and borrow at short maturities. If these lending rates reprice infrequently, unexpected changes in monetary policy will take time to flow through to the real economy. There are several general and partial equilibrium models that incorporate this maturity mismatch (either explicitly or implicitly via repricing frictions) and find that monetary policy shocks are attenuated by the banking system (e.g. Gerali et al 2010; Andreasen, Ferman and Zabczyk 2013; Alessandri and Nelson 2015).
Monetary policy may not fully pass through if changes in the policy rate affect banks' profitability. Brunnermeier and Koby (2017) argue that policy rate reductions beyond a certain level will be contractionary. This occurs because policy rate reductions shrink banks' net interest margins (after the short-term benefit of liabilities repricing faster than assets subsides), reducing profitability. Beyond some point, profitability is sufficiently inhibited to cause banks to shift away from risky lending (due to regulatory constraints requiring more capital to be held against these loans); the more the policy rate falls, the more this constraint binds, and the more contractionary the policy becomes.
Monetary policy may not fully pass through if there are bounds on some interest rates. Eggertsson, Juelsrud and Getz Wold (2017) build a New Keynesian dynamic stochastic general equilibrium model in which deposit rates have a floor because people have the ability to switch into cash. In their model, this floor means policy rate reductions below the floor have no effect on banks' funding costs, and therefore do not pass through to lending rates.
Ultimately, whether monetary policy fully passes through to lending and deposit rates is an empirical question. There are three common approaches in the literature: stationary time series models, the analysis of long-run relationships, and panel models.
Stationary time series models, such as univariate regressions and vector autoregressions, use the co-movement between monetary policy rates and bank rates over time to identify how much monetary policy is passed through to bank rates. Some studies, such as Angeloni and Ehrmann (2003) and de Bondt (2005), use a small number of variables in their analysis (such as bank rates, money market rates, and the policy rate); implicitly assuming that monetary policy is not correlated with any of the excluded variables that would influence bank rates.
This assumption is problematic. We know that banks account for changes in both their cost of funding and the risk of their loan portfolio when pricing their loans. We also know that increases in perceived risk often occur at the same time as central banks cut their policy rates to stabilise their economies (e.g. when there is an increase in the probability of a recession).
Including more controls can help identify the true relationship between monetary policy and bank rates. von Borstel, Eickmeier and Krippner (2016) use a factor modelling approach that allows them to parsimoniously include a much larger set of controls. However, even these large studies typically do not include controls for the risk of the loan portfolio. They typically assume the relationships are linear and that there are no structural changes, such as changes in portfolio composition, competition or regulation. They also implicitly assume that the balance sheet components they have not included, such as expected loan losses and profitability, are not correlated with the monetary policy variable, which theoretically need not be the case (e.g. Van den Heuvel 2007).
Another issue with stationary time series models is that they implicitly assume the timing and magnitude of pass-through to bank rates is constant over time. This assumption will be violated if banks have some discretion over when they change their bank rates, or if the bank rates are long-term rates, in which case the model would need to control for expected future policy rate changes. To overcome these issues, and the abovementioned issues with using only a small number of variables, a very common approach is to analyse long-run relationships between monetary policy and bank rates. Examples include, Lowe (1995), Borio and Fritz (1995), Aristei and Gallo (2014), Darracq Paries et al (2014), Horvath, Kotlebova and Siranova (2018), and Cook and Steenkamp (2018).
If the monetary policy rate and bank rates have a unit root and are cointegrated, then, with a sufficiently large sample, the long-run relationship between these variables can be identified without needing to control for any stationary variables (this is the super-consistency property of cointegrated variables, see Maddala and Kim (1998)). However, monetary policy rates in inflation-targeting economies can only have a unit root if the neutral real rate has a unit root.[7] Moreover, there is evidence that interest rates were mean-reverting before inflation targeting (see Figure 2 in Simon (2015)).
Studies that analyse long-run relationships typically test for the presence of unit roots, but while these tests have nice asymptotic properties, they are known to have poor finite sample properties (Andries and Billon 2016). Moreover, even if these variables were cointegrated, accurately estimating the cointegrating relationship requires a time series sufficiently long that the variance of the common stochastic trend dominates the variances of the stationary variables; this is unlikely to be the case when estimating recent pass-through, especially when one considers how much risk spreads changed during the global financial crisis. As a result, these long-run analyses are likely subject to the same biases as the stationary time series models.[8]
The final common method is to use panel data; that is, instead of using aggregate data, one uses data on many individual banks over time. One advantage of panel data is that it allows the researcher to control for the various features of individual banks that may change over time and confound aggregate estimates of pass-through. That said, the panel models still require the researcher to have properly controlled for variables correlated with both monetary policy and bank rates. One way to do this is to include time fixed effects and to interact the policy rate with some of the time-varying bank-specific features. But then the researcher is only able to identify the features that cause pass-through to differ across banks, rather than the aggregate pass-through.
Because panel models ideally have a large cross-section, they are best used in jurisdictions with a large number of different banks (e.g. the euro area or the United States). Examples of papers with panel models include Gambacorta (2008) and Hristov, Hülsewig and Wollmershäuser (2014). The profitability literature referred to above also typically uses panel models. Examples of these papers include Borio, Gambacorta and Hofmann (2015), Claessens, Coleman and Donnelly (2017), and Altavilla, Boucinha and Peydró (2017).
Unfortunately, panel data is unlikely to sufficiently aid pass-through estimation in Australia. Australia has a small and highly concentrated banking system with little variation among the balance sheets of the major banks.[9] And while there is more variation among the smaller Australian-owned and foreign-owned banks, extrapolating this information to the major banks would require the brave assumption that we had completely controlled for everything that would cause the major banks to respond differently to the other banks.
In Australia, Lowe (1995) finds that between 1986 and 1994, banks' lending and deposit rates moved far less than one-for-one with the cash rate (some of these results are reported in Table 1). Apergis and Cooray (2015) report evidence of asymmetric pass-through, but do not report the level of pass-through. However, their paper falls into the category of the long-run analyses discussed above, and their finding of asymmetric pass-through could just be proxying for changes in pass-through over time (the cash rate was rising in the first part of their sample, then falling in the second).
2.1 Our approach
Instead of using regression techniques that estimate pass-through by trying to directly control for the various other influences on banks' lending and deposit rates (i.e. the approaches above), we construct a detailed model of banks' balance sheets. We then use data that the major banks report to APRA and interest rate data held by the RBA to calibrate the components of this model. Having a model of the banks' balance sheets allows us to determine the effect of the cash rate on each balance sheet component separately, thereby allowing us to account for differing amounts of intermediate pass-through, different controls (to abstract from the various other influences on banks' lending and deposit rates), and different intermediate pass-through speeds. It also allows us to account for differences in maturity structure between assets and liabilities, account for any hedging, and identify the source of any incomplete pass-through. While calibration may be less accurate than an unbiased estimator and a large sample, given all the estimation issues discussed above, we believe that calibration is likely to provide more accurate parameter values.
We split the banks' balance sheet into discretionary and non-discretionary components. The non-discretionary components are those where the banks have little control over pricing; this is either because they are price takers in the respective markets (e.g. wholesale debt funding and securities held as assets), the price is fixed by virtue of the product (e.g. non-interest bearing deposits), or because of regulations defining how the price must be set (e.g. provisions for expected losses). Since these components are non-discretionary, we can analyse the effect of the cash rate on them without needing to control for unobserved changes in banks' pricing decisions that may occur at the same time as the cash rate changes.
Once we determine the effect of the cash rate (and cash rate expectations) on banks' non-discretionary components, due to the balance sheet identity this must equal the effect of the cash rate on the discretionary components. The banks' discretionary components are the loans and deposits over which they have some pricing power, non-interest incomes and expenses, and their ROE. Therefore, the pass-through to lending and deposit rates equals a combination of the relationships between the cash rate and the non-discretionary components, net non-interest income, and ROE (i.e. the balance sheet identity means ‘pass-through’ equals ‘intermediate pass-through’); this is explained in detail in Section 3.
That said, this approach does have some disadvantages. First, the model is not behavioural; so we can't say whether the banks will respond to future cash rate changes in the same way as they have responded to past cash rate changes. While this is a critique of empirical models in general, it is particularly important for this research because the banks likely have some flexibility in how they respond to cash rate changes.
Second, we do not attempt to determine the extent of pass-through to individual lending and deposit rates, only the aggregate pass-through. This is because – without information on how the banks price their products, changes to competitive pressures, changes to regulations, or any other unobservable changes to the decision-making of banks – estimates of individual pass-through based on historical relationships are likely to be fraught with error and are unlikely to accurately estimate future pass-through. In any case, aggregate pass-through is what most concerns a central bank. While the marginal propensities to consume of net borrowers differ from net savers (La Cava, Hughson and Kaplan 2016), these differences are of second-order importance to the aggregate pass-through effect.
Third, we do not look at the effect of cash rate changes on lending volumes, which means we are not capturing every part of the transmission of monetary policy through the banking system. Nevertheless, the transmission through volumes acts on the flow of loans, whereas the transmission through rates acts on both the stock and flow of loans and deposits. The latter is likely to be the more important of the two mechanisms, especially in Australia, where 80 per cent of the major banks' assets have interest rates that can be repriced in under three months.
3. Model of Banks' Incomes and Expenses
As with most research that incorporates a theoretical model of banks' incomes and expenses (e.g. Lowe 1995; Borio et al 2015), we start with a stylised balance sheet identity:
where Ai is the current value of asset i, Lj is the current value of liability j, and E is the current book value of equity. From this balance sheet identity, we construct a relationship between the bank's ROE (rE) and its incomes and expenses:
where rA,i is the interest income from asset i, rL,j is the interest cost of liability j, f is the non-interest income gained per unit of assets (e.g. fees), c is the non-interest expense per unit of assets (e.g. staffing costs).
We assume that the bank never defaults (so rL,j is always paid in full), but that some borrowers will not repay their loans. pi(1+rA,i)Ai is the unconditional expected loss from asset Ai; it is an unconditional expectation as it incorporates both the probability of default and the expected loss given default. Therefore, element i in the first sum on the right-hand side of Equation (1) is the expected gross interest income from asset i.
In this model, banks' ROE (rE) is the actual ROE, not the expected ROE. It is a function of expected losses (Σipi(1+rA,i)Ai), rather than actual losses, because Australian banks are required to ‘provision’ for losses when they become likely (not only after they occur) and account for new provisions in current expenses. Provisions include likely losses on individual loans and an expense to cover ‘currently unidentified’ losses, with this expense based on historical loss experience and prevailing economic conditions (RBA 2009a).
Dividing both sides of Equation (1) by the total current value of assets (ΣiAi) and subtracting the cash rate (rC) from both sides of the equation gives:
where 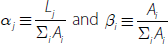 . Equation (2) is the framework that will be used in the
rest of this paper.
. Equation (2) is the framework that will be used in the
rest of this paper.
Equation (2) expresses the interest rates as spreads to the cash rate. If any of these assets or liabilities have interest rates that are fixed for some period, changes in the cash rate will mechanically change these spreads. For example, banks that borrow at short maturities and lend at long maturities (with fixed interest rates) would see their ROE spread fall as the cash rate increased (ceteris paribus). In practice, banks may reduce their exposure to interest rate risk by lending for long maturities with interest rates that can be repriced frequently or by using derivatives to hedge the interest rate risk from repricing mismatches.
To hedge interest rate risk, a bank will enter into derivatives that ‘swap’ a stream of interest payments with one repricing term for a stream of interest payments with a different repricing term. These derivatives must be incorporated into Equation (2). Appendix A shows that these derivatives can be incorporated into Equation (2) simply by replacing the ‘spreads to cash rate’ of the hedged assets and liabilities with ‘spreads to the relevant reference rates’.[10] Moreover, any additional margin can be added to these spreads without affecting Equation (2); we add the BBSW–OIS spread so that the spreads we analyse are hedged spreads to current/expected cash rates.[11]
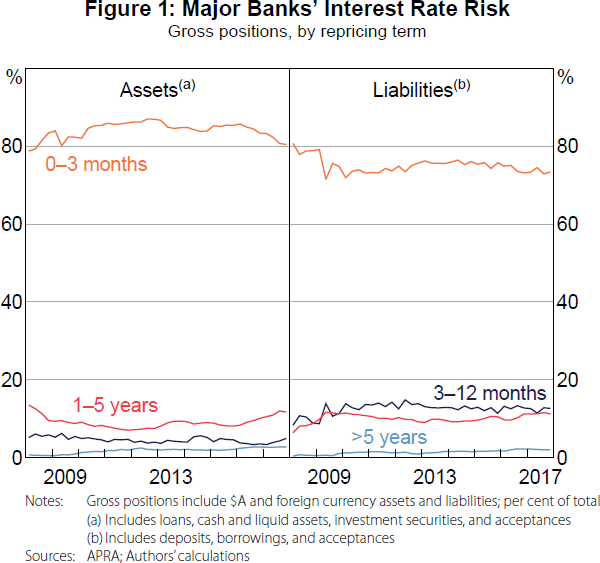
Over the past decade, the majority of the major banks' assets and liabilities had interest rates that repriced in less than three months (Figure 1). Furthermore, the remaining repricing mismatch between assets and liabilities was hedged (Figure 2). This has two main implications for our analysis. First, changes in the cash rate do not affect the major banks' ROE via repricing mismatches; this differs from several other banking systems, see Gambacorta (2008) and Alessandri and Nelson (2015), for example.[12] And second, we can use the spreads to reference rates in place of the spreads to cash rate for the assets and liabilities in Equation (2).
The benefit of converting the interest rates on banks' assets and liabilities into spreads to reference rates is that we do not need to separately control for the repricing structure of each asset and liability class, or for changes in expected future cash rates (e.g. a 5-year interest rate that does not fully adjust because expected future cash rates do not change does not indicate incomplete monetary policy pass-through). Any regression that does not fully control for these features would be biased. If the spreads we analyse are all independent of (current and expected) changes in the cash rate, monetary policy would pass through one-for-one to banks' lending and deposit rates (as the reference rates are market determined and assumed to fully incorporate current and expected cash rate changes).
Since this paper is not concerned with the effect of the cash rate on loan volumes, Equation (2) normalises the size of the balance sheet to one (the βi and αj are the balance sheet shares of each asset and liability class, respectively). We then assume that banks are profit-maximising and therefore choose the cheapest funding mix given their constraints (constraints include the supply of each funding source, liquidity considerations, and regulatory requirements). This means we can focus our analysis on changes in spreads.[13]
The remainder of the paper will evaluate the effect cash rate changes have on each part of Equation (2): provisioning (Section 4.1); debt funding spreads (Section 4.2); non-loan asset spreads (Section 4.3); non-interest income and expenses (Section 4.4); and ROE (Section 5). These components will then be aggregated to determine the aggregate pass-through of monetary policy to the major banks' discretionary lending and deposit rates (Section 5).
4. The Relationship between the Cash Rate and the Model Components
4.1 New provisions
In this section, we model banks' net new provisions for expected loan losses (also known as their ‘charge for bad and doubtful debts’). We model these new provisions (relative to assets in the previous quarter, henceforth the provisioning rate) as a linear function of the cash rate, long-term interest rates, and economic variables.[14]
Loan losses are determined by two variables, whether a borrower defaults on their loan, and the amount the bank is able to recover from the borrower after they have defaulted (including through asset sales). Therefore, expected losses are determined by both the probability of default and the expected loss given default.
Theoretically, the cash rate will affect both components. By reducing the interest burden, an unexpected reduction in either current or future cash rates should reduce borrowers' probability of default. By increasing asset values, an unexpected reduction in current or future cash rates should reduce the expected loss given default.
Expected losses will also be affected by the prevailing economic conditions. For example, an unexpected increase in either current or future unemployment will increase borrowers' probability of default. While an unexpected downgrade in GDP forecasts, for example, will increase expected losses given default. Therefore, when determining the relationship between the cash rate and provisioning rates, it is important to control for current and expected macroeconomic conditions.
As a key component of profits, the international literature evaluating the effect of interest rate changes on bank profitability typically evaluates the effect on banks' provisioning rates.
Two recent international studies (Altavilla et al 2017; Borio et al 2015) both found a positive and statistically significant relationship between short-term interest rates and provisioning rates, as expected. Importantly, Altavilla et al (2017) found that controlling for macroeconomic forecasts is important for determining the relationship between interest rates and provisioning rates. Rodgers (2015) conducted a comprehensive analysis of Australian banks' credit losses between 1980 and 2013 and found a positive relationship between interest rates and losses. However, unlike the above studies and our analysis, Rodgers analysed ‘current losses’, a less forward-looking measure than provisioning rates. So our results are not directly comparable.
We have quarterly data on net new provisions between 2002 and 2017, but the similarity between the major banks means we cannot utilise the panel aspect of our data; so we analyse the aggregate provisions of the major banks divided by the value of their assets in the previous quarter, that is, a concept consistent with Equation (2). This gives us 61 observations.
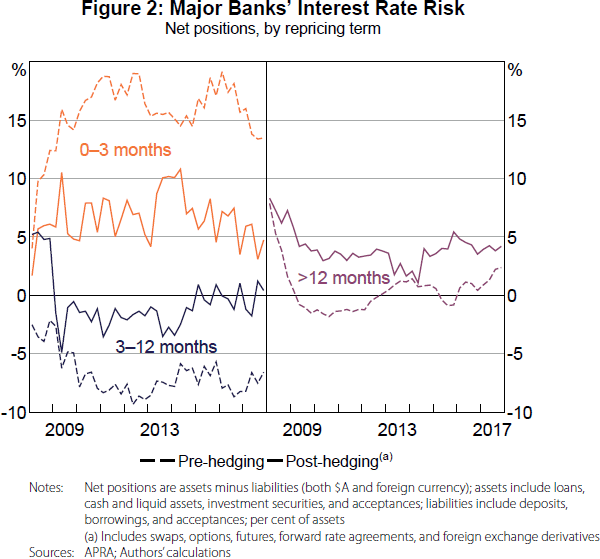
We want to control for the prevailing and expected economic conditions as best as possible, so we have 14 macroeconomic variables and forecasts we would like to include (see Table B1 for a list). However, the small number of observations means including this many variables would make our analysis prone to overfitting. To overcome this problem, we use a common dimensionality reduction technique known as principal component analysis (PCA). We find that the first two principal components contain 57 per cent of the variation contained within our collection of macroeconomic variables (see Appendix B for further explanation and details about the make-up of the principal components).
We regress quarterly provisioning rates on the cash rate, the slope of the yield curve (to control for expectations of future cash rates), and our two principal components. As expected, both the cash rate and yield curve variables have a positive and statistically significant effect on provisioning rates, while an economic deterioration causes provisioning rates to rise. Our explanatory variables are able to explain 55 per cent of the variation in provisioning rates.[15]
Figure 3 decomposes quarterly provisioning rates into the contribution of each explanatory variable. The impact of the economic deterioration during the crisis (including the deteriorating forecasts) is obvious, as is the counteracting effect of the large reduction in the cash rate during this period. While a lot of the identification comes from the crisis period, the subsequent period of falling provisioning rates in line with further cash rate reductions is also evident.
Based on these estimates, a 100 basis point cut in the cash rate is expected to reduce annual provisioning rates by 7 basis points (with a 2 standard deviation confidence interval of 5–10 basis points). This may not seem like much, but the cut in the cash rate from 7.25 per cent to 1.50 per cent means annual provisioning rates are 41 basis points lower. Compared with an average annual provisioning rate of 23 basis points (during 2002–17), this is a big effect.
The effect of the cash rate on provisioning rates may diminish at low interest rates. Provisioning rates can only be negative if previously provisioned losses are no longer in danger of being realised. Therefore, the benefit of lower interest rates is likely to weaken as provisioning rates approach zero.
4.2 Debt funding spreads
4.2.1 Construction of funding spreads and shares
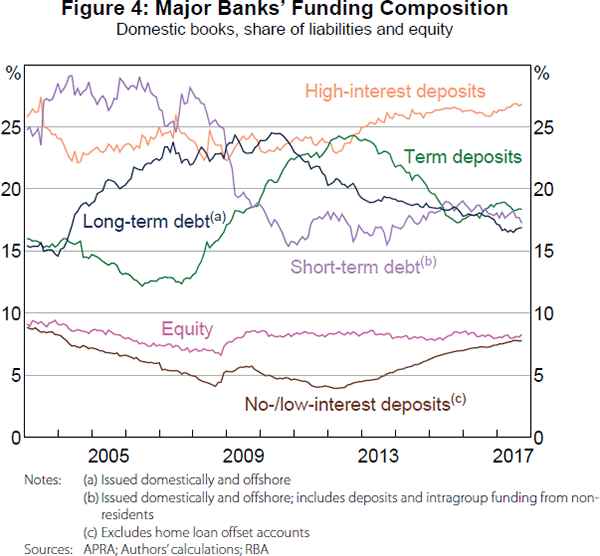
In this section, we outline the key assumptions and data used to construct the funding side of our model.[16] The shares of each funding component – the αj parameters in Equation (2) – are calibrated using APRA data reported by the major banks (Figure 4) and other balance sheet data obtained by the RBA.[17] The spreads are estimated from major bank interest rate data collected by the RBA and data reported to APRA (see Appendix E for more detail):
- Long-term debt spreads equal the value-weighted average spreads at issuance of the major banks' outstanding bonds. The spreads at issuance equal the estimated foreign currency-hedged yield at issuance minus the swap rate of similar maturity. We then add the BBSW–OIS spread (as discussed in Section 3).
- Short-term debt spreads equal value-weighted spreads between market-based estimates of the major banks' foreign currency-hedged short-term debt funding costs (e.g. for foreign currency debt we use BBSW rate plus the cross-currency basis) and maturity-matched OIS rates.
- Term deposit spreads are weighted averages of the maturity-matched spreads (to OIS) at issuance of term deposits assumed to remain outstanding. The weights depend on the proportion choosing each term, the length of each term, and the volume of term deposits issued at each point in time. The proportion choosing each term depends on the advertised ‘special’ rates at each point in time, and a mapping from the distribution of remaining terms to maturity (for which we have data) to the historical original-maturity distributions.
-
High-interest deposits include at-call high-interest accounts (such as online savings
accounts, bonus saver accounts, and cash management accounts) and the accounts of
corporations, pension funds, and governments.
- At-call high-interest account spreads are weighted average spreads between the rates on these accounts and the cash rate, with weights depending on the volumes in the various account types.
- For corporations, pension funds and governments, we assume their remaining deposit accounts pay interest rates that move with rates in the domestic markets for short-term bank debt securities (these are converted into spreads to OIS); these securities are plausible substitutes for many of these institutions.
- No-/low-interest deposits include non-interest-bearing deposits (excluding balances in home loan offset accounts) and the accounts of households and unincorporated enterprises not classified as at-call high interest (these are assumed to pay a non-zero but low fixed rate). We assume banks hedge these deposits into a variable interest rate exposure by entering into 3-year fixed-for-floating swaps (this is known as a ‘replicating portfolio’ hedge); this variable rate is converted into a spread to OIS.[18]
4.2.2 Accuracy of the debt funding part of the model
This section evaluates how well the funding part of our model lines up with more aggregated data reported to APRA. This is important as our model calibration requires multiple assumptions about the maturity structure of the major banks' debt and that our interest rate data accurately reflect their costs of funding.
While the reported data may be more accurate than our model estimates, they likely also contain measurement error and do not provide a sufficiently rich breakdown for our purposes. For example, we need to know the share of no-/low-interest-bearing deposits relative to other types of deposit accounts. None of the data used for comparison in this section was used to calibrate our model, so this is a true external validation exercise.
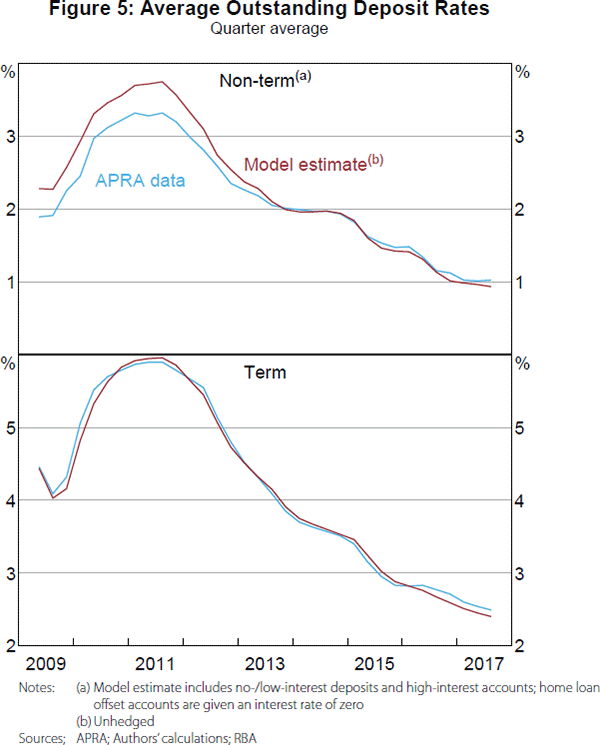
Figure 5 compares quarterly average outstanding non-term and term deposit interest rates estimated from our model (the parts of our model requiring the most assumptions) to quarterly average interest rates reported to APRA by the banks. Our model provides a close approximation to the reported rates. Moreover, it is not just the broad trends that are matched, but the shape of the interest rate curves. These results give us confidence in the accuracy of our assumptions and calibration.
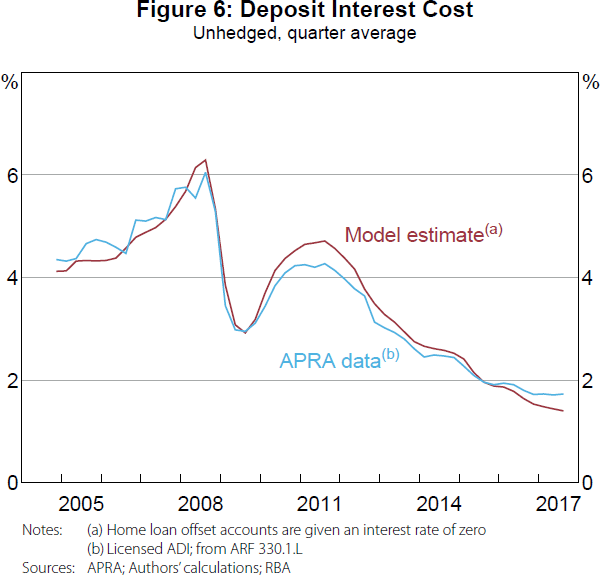
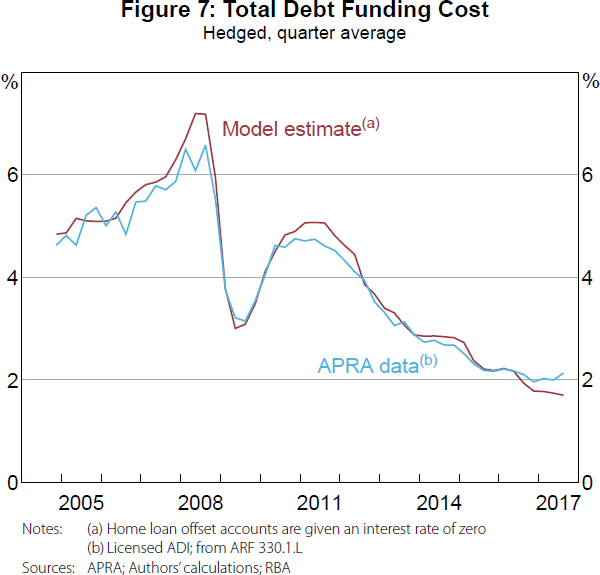
While the quarterly average rates reported by APRA provide the best comparison, we only have data from 2009. For a longer time series, we approximate quarterly average interest rates from the major banks' quarterly interest expense data reported to APRA.[19]
The APRA data in Figures 6 and 7 are constructed on a ‘licensed authorised deposit-taking institution (ADI)’ basis, while our model and the APRA data in Figure 5 are based on Australian dollar deposits on the ‘domestic book of the licensed ADI’. So we do not expect our model to align as closely in Figures 6 and 7 as they do in Figure 5. That said, our model closely approximates these licensed ADI estimates over the entire sample, providing further validation of our assumptions and calibration.[20]
4.2.3 Wholesale funding assumptions
We assume the major banks' are price takers in offshore wholesale debt markets.[21] This means that they are not sufficiently large issuers of debt that changes in their wholesale debt volumes change the price of debt in these markets (i.e. the debt supply curve faced by the banks is flat, so offshore debt is a non-discretionary source of funding).[22] The small share of outstanding offshore debt that was issued by the major banks gives credence to this assumption; the major banks' outstanding offshore debt comprised less than 1 per cent of total global financial-corporation debt at the end of June 2017 (BIS 2017).
Since the major banks are able to tap both offshore and domestic markets, hedged spreads in offshore debt markets provide an approximate upper bound for domestic market spreads. However, in normal times, the spreads in both markets are very close and the major banks issue in both markets. Therefore, the price-taker assumption in offshore markets typically means the banks' issuance volumes do not influence spreads in either domestic or offshore markets.
That said, there have been periods during which offshore spreads diverged from domestic spreads; the height of the global financial crisis is an example (Black, Brassil and Hack 2010). During these periods, the volume of banks' debt issuance may have influenced domestic spreads. For example, the lower issuance by banks during the financial crisis may have caused domestic spreads to be lower than they would have been had banks continued to issue the same amount. As long as the change in issuance is not caused by a change in current or expected cash rates, the resulting change in spreads is not important for our analysis of monetary policy pass-through.
We further assume that the spreads between the major banks' debt and the risk-free rates in the various domestic and offshore markets do not depend on the levels of the risk-free rates. Instead, changes in these spreads are determined by changes in perceptions of risk (such as credit risk or liquidity risk). This assumption is consistent with numerous RBA publications that analyse the changes in these spreads and mention changes in risk as causal factors, not changes in the level of the risk-free rate (e.g. Davies et al 2009; Black et al 2010; Berkelmans and Duong 2014).
While changes in historical spreads may not be caused by changes in global risk-free rates, this need not always be the case. The ‘search for yield’ argument suggests that demand for riskier assets may cause spreads to shrink as risk-free rates fall. That said, as long as this search for yield behaviour relates to global risk-free rates rather than the cash rate, the search for yield behaviour is not important for our analysis.
Combined, these assumptions mean changes in monetary policy transmit one-for-one to the cost of the major banks' wholesale debt funding.
4.2.4 Direct effect of the cash rate on no-/low-interest deposits
By paying a fixed interest rate in our model (this is why it is a non-discretionary source of funding), the spreads on no-/low-interest deposits increase one-for-one as the cash rate falls. But these spread increases are assumed to be smoothed via a replicating portfolio hedge.
The large cash rate reductions following the onset of the financial crisis initially had only a small effect on the major banks' no-/low-interest spreads (due to the replicating portfolio), especially relative to their other sources of debt funding (Figure 8). Since then, the historically low levels of the cash rate and the length of time it has remained at these low levels have increased the cost of these deposits relative to other sources of funding. The change in the no-/low-interest spread now contributes a similar amount to the increase in the major banks' debt funding spreads as wholesale funding (Figure 8), despite being a much lower share of funding (Figure 4); contributing 23 basis points to the major banks' debt funding spreads since 2007.
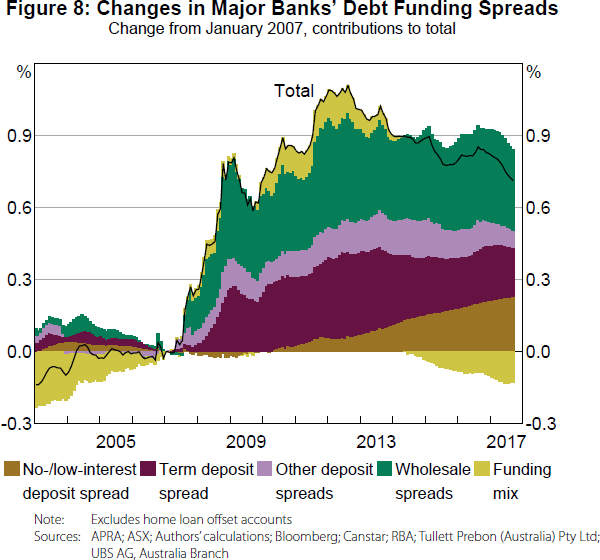
Since we model both the share of these deposits and the replicating portfolio hedge, we can use expectations of future cash rates to forecast how these no-/low-interest deposit spreads will develop in the future. Using estimates of market-expected future cash rates, and assuming these deposits remain at their current share of debt funding, we estimate that the contribution of no-/low-interest spreads will peak at 31 basis points in late 2020. The ability to model the timing of changes in funding costs, and to project how these changes will evolve, is an advantage of our framework over the existing research methodologies.
While no-/low-interest deposits currently make up a similar share of major banks' deposits as they did at the beginning of the inflation-targeting period, they accounted for over half of their deposits in 1980 (Lowe 1995). As a result, changes in the cash rate would have had a larger impact on the major banks' funding spreads prior to the inflation-targeting period.
4.2.5 Indirect effect of the cash rate on no-/low-interest deposits
If cash rate reductions also cause a substitution of depositors into these no-/low-interest deposits, this indirect effect may partially offset the direct effect estimated in the previous section. The indirect effect may include both an increase in the share of no-/low-interest deposits (which reduces funding costs) and an increase in the spreads on substitute deposits (e.g. term and high-interest deposits).[23] Under some mild assumptions, the indirect effect will be cost-reducing in total (see Appendix C for a detailed explanation). So even though we are not able to provide a point estimate of the size of this indirect effect, we can show that the upper bound of the indirect effect is likely small.
There is no evidence of substitution occurring between 2007 and 2013; the share of no-/low-interest deposits was broadly stable despite a large fall in the cash rate (and therefore increase no-/low-interest deposit spread). Conversely, the share of no-/low-interest deposits is estimated to have increased from 5 per cent to 8 per cent recently (Figure 4). To estimate an upper bound, we assume this increased share was completely due to the cash rate fall.
We then produce an upper bound by running a counterfactual exercise in which all the spreads move as they do in the data, but the share of no-/low-interest deposits remains around 5 per cent (Appendix C explains this exercise in detail).[24] In this exercise, the funding mix component of the change in the major banks' debt funding spreads since 2007 would currently be –5 basis points (as opposed to the −13 basis points in Figure 8). So an upper bound for the offsetting indirect effect is 8 basis points.
The broadly constant share of no-/low-interest deposits between 2007 and 2013, but increasing share recently, is consistent with a nonlinear supply curve for no-/low-interest deposits.[25] Identifying a nonlinear supply curve is important for evaluating the total effect of any future cash rate reductions. As the share of no-/low-interest deposits increases, cash rate reductions have a larger direct effect. However, if the supply curve flattens, the indirect offset will also be larger. But this can only occur up to the point where most of the potential substitution has already occurred, after which the indirect offset would wane while the direct effect would be large. Unfortunately, it is not possible to know either the size of the indirect effects from any future cash rate reductions, nor the point at which these indirect effects will wane.
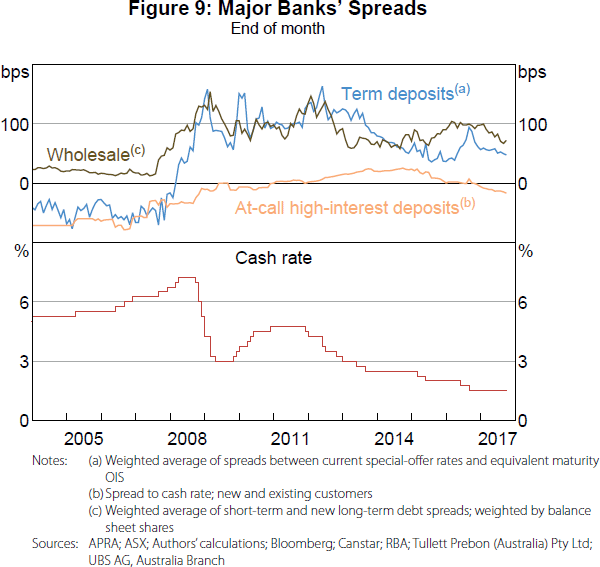
4.2.6 Effect of the cash rate on term deposit and at-call high-interest deposit spreads
The interest rates of term deposits and at-call high-interest deposits are set by the banks. While banks will be constrained in their choice of rate – by competition and the supply of these deposits, for example – the fact that they are set by the banks makes them discretionary sources of funding. We assume that banks set these spreads to maximise their profits given any constraints. This means that the cash rate will only affect these spreads via its effect on any non-discretionary substitute spreads or its effect on any constraints (see Appendix C).
In our model, term deposit spreads and spreads on at-call high-interest deposits have contributed to the increase in the major banks' funding costs since 2007 (Figure 8). In contrast to no-/low-interest accounts, changes in the cash rate are unlikely to be an important determinant of changes in term deposit and high-interest spreads. Wholesale funding spreads and demand-side factors unrelated to the cash rate are the important determinants.
Before the crisis, spreads on these deposit accounts were broadly constant, despite an increasing cash rate (Figure 9). Once the crisis hit, spreads on new term deposits increased due to intense competition between banks for this source of funding (Davies et al 2009). As spreads on substitute sources of funding increased (i.e. wholesale spreads), banks vied for the cheaper sources of funding, pushing these spreads higher. Moreover, banks were likely to have reassessed the virtues of short-term wholesale debt as a stable source of funding, adding to the pressure on deposit spreads. Competition initially focused more on term deposits due to these being a reasonably stable source of funding that allow banks to offer higher interest rates without immediately repricing their existing deposits (Brown et al 2010).
While not as stable as term deposits, at-call high-interest accounts often have minimum monthly deposits or withdrawal limitations that make them a partial substitute, leading to increased competition for these deposits before 2016 (Berkelmans and Duong 2014). The release of APRA's net stable funding ratio proposal (in 2016) – classifying term deposits as a more stable source of funding than at-call high-interest deposits – led to renewed competition for term deposits relative to at-call high-interest accounts (Cheung 2017).
While the level of the cash rate is not typically cited as an explanatory factor for changes in these deposit spreads, it is still possible that changes in the cash rate have had a small effect (e.g. see Section 4.2.5). Crucially though, as discretionary components, for the cash rate to have affected these spreads they must have affected either non-discretionary substitute spreads or the constraints. We do not see the cash rate as affecting any of the demand-side constraints on term and high-interest deposits (risk considerations and regulations, for example). Therefore, any effect of the cash rate on term and high-interest deposits can only occur indirectly via changes in other spreads.
4.3 Non-loan assets
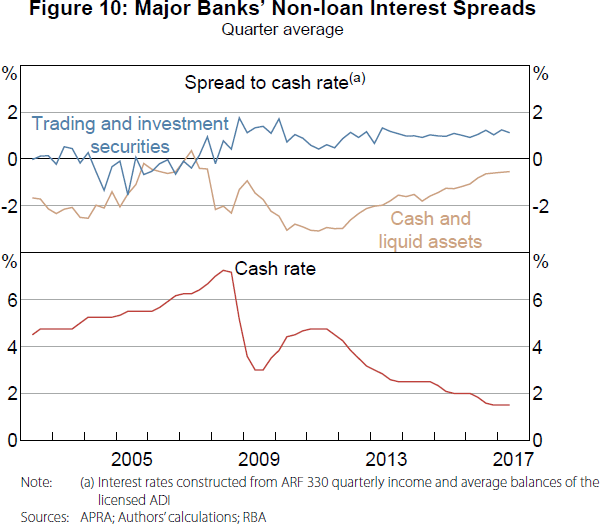
As with the banks' wholesale debt funding, the trading and investment securities that banks hold likely have spreads that depend on changes in risk perception (e.g. credit and liquidity risks) rather than changes in the level of the cash rate. Therefore, it is not surprising that the estimated spreads do not appear to be correlated with the cash rate, but instead have spreads exhibiting a similar pattern to wholesale debt funding spreads (Figure 10).
Conversely, several of the asset classes included in cash and liquid assets pay no interest. These include notes and coins, gold, and some receivables due from financial institutions. As a result, the interest spread on these assets rises as the cash rate falls.
Since 2009, a negative relationship between the cash and liquid asset spread and the cash rate is evident in our estimates (Figure 10), but it is not evident beforehand. This post-2009 relationship suggests a 100 basis point reduction in the cash rate causes a 73 basis point increase in the spread.[26] At around 3 per cent of the major banks' assets, this translates to a 2 basis point increase in the major banks' interest spread per 100 basis point reduction in the cash rate.
4.4 Non-interest income and expenses
Banks gain non-interest income through, for example, trading securities, foreign exchange transactions, and by charging their customers fees and commissions for various activities. They also have non-interest expenses such as personnel, occupancy, equipment, information technology, and tax. These non-interest incomes and expenses are, at least partially, discretionary and enter Equation (2) via the (f − c) component.
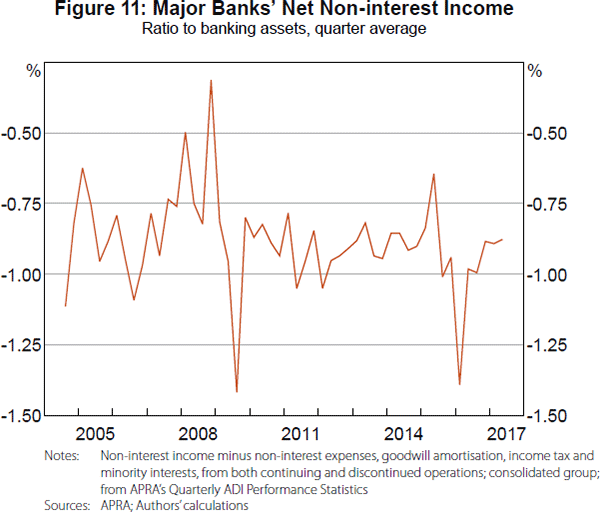
As a share of assets, the major banks' net non-interest income, while volatile, has had a broadly stable average since 2004 (Figure 11). Underlying this has been a downward trend in both the ratio of banks' fees to assets (Fitzpatrick and White 2017) and improvements in operational efficiencies (RBA 2014a).
During our sample, there is no evidence of a relationship between the cash rate and the major banks' net non-interest income. Therefore, we focus only on the major banks' interest income and interest expenses in the remainder of this paper.
4.5 Summary of non-discretionary intermediate pass-through
To summarise our results so far, we find:
- The spread on no-/low-interest deposits has a negative one-for-one relationship with the cash rate (excluding the effects of the replicating portfolio hedge). Via this channel, we estimate the major banks' unhedged funding spread to increase by around 6 basis points per 100 basis point cash rate reduction (based on the average funding share of no-/low-interest deposits since 2003). This estimate represents an upper bound on the full effect, because both hedging and the possible indirect effects discussed in Section 4.2.5 would reduce the estimate.
- Provisions for potential future losses have a positive relationship with the cash rate. We estimate that a 100 basis point reduction in the cash rate reduces provisioning rates by 7 basis points.
- The cash and liquid assets spread has a negative relationship with the cash rate, consistent with several of the assets within this category not paying interest. However, this asset category makes up just 3 per cent of the major banks' balance sheets. So we estimate that, via this channel, the major banks' income spread increases by 2 basis points per 100 basis point reduction in the cash rate.
- With respect to Equation (2), these effects have been partially offsetting, such that changes in the cash rate have been slightly amplified by the non-discretionary balance sheet components. While the size of the amplification depends on the balance sheet shares of the aforementioned components, the average amplification since 2003 amounted to 3–9 basis points per 100 basis point cash rate change.[27]
5. Return on Equity and Aggregate Pass-through
In this section, we assess intermediate pass-through to the major banks' ROE. Since we find a slight amplification in intermediate pass-through to the non-discretionary components, one-for-one pass-through to discretionary lending and deposit rates requires ROE to have an offsetting relationship with the cash rate.
Importantly, we make no claim as to whether banks' ROE should move in this manner. What we evaluate here is an identity: if ROE does not move to exactly offset the amplification, then pass-through to discretionary lending and deposit rates will not be one-for-one.
Assessing the level of ROE is also beyond the scope of this paper. There are many other factors that influence the level of ROE (see Lowe (1995) and ACCC (2018) for discussions); all we seek to determine is how ROE moves with the cash rate over time.
Changes in these other factors can mask how ROE moves with the cash rate. We proceed by excluding some components in a way that improves the accuracy of our analysis (see Appendix F for further discussion). First, we exclude net non-interest income, as it is volatile and does not move with the cash rate (Section 4.4). We call the resulting variable return on equity from net interest income (ROE–NII).[28] Importantly, while the level of ROE–NII will differ from the level of ROE, due to the lack of correlation between net non-interest income and the cash rate any correlation between the cash rate and ROE must also be present in the correlation between the cash rate and ROE–NII.
Second, we exclude provisioning. Excluding provisioning is more contentious than the first exclusion because it has the potential to bias our analysis. This bias may occur if banks do not absorb changes in provisioning rates into their ROE but instead pass these changes through to discretionary lending and deposit rates (see Appendix F for further discussion). By excluding provisioning, we are therefore assuming that the major banks absorb changes in provisioning rates into their ROE. The large reduction in the variance of ROE–NII after excluding provisioning (henceforth ROE–EP) is evidence in favour of this assumption (Figure 12).
Figure 12 also includes a line that shows how ROE–EP would need to have changed to result in one-for-one pass-through of cash rate changes to discretionary lending and deposit rates (see Appendix F for a derivation). Up to 2012, ROE–EP broadly tracked the ‘one-for-one pass-through’ ROE–EP, suggesting that aggregate pass-through was indistinguishable from one-for-one. However, from mid 2012 ROE–EP deviated from one-for-one pass-through ROE–EP. Our analysis suggests that, not only was aggregate pass-through less than one-for-one during this period, but that ROE–EP had no discernible relationship with the cash rate.
We cannot determine how this deviation from one-for-one pass-through was distributed across the banks' lending and deposit rates. But we can use our model to provide some scenarios. Denoting the set of discretionary lending and deposit rates as D, then from Equation (2), when ROE–EP does not move with the cash rate the change in these discretionary rates must satisfy the following equality:
where the −0.04 on the right-hand side is the combination of the deviations from one-for-one intermediate pass-through since mid 2012 coming from no-/low-interest deposits and cash and liquid assets.
If the deviation from one-for-one pass-through were spread evenly across the banks' discretionary lending and deposit rates, the absolute value of the derivatives in Equation (3) would all be equal. Then, using the 2017 calibrations for αj and βi, for every 100 basis point reduction in the cash rate lending rates would be 11 basis points higher than one-for-one pass-through and discretionary deposit rates would be 11 basis points lower.
If the deviation were spread across lending rates alone, lending rates would be 16 basis points higher than one-for-one pass-through (per 100 basis point cash rate reduction). If the deviation were spread across discretionary deposits alone, these deposit rates would be 32 basis points lower than one-for-one pass-through. These figures would be larger if the deviation were spread across only a subset of loans or deposits.
The small variation in ROE–EP from mid 2012 suggests the major banks may have a preference for maintaining a specific level of ROE–EP, and is consistent with some banks historically maintaining ROE-level targets that have not varied with the cash rate (see Fabbro and Hack (2011), RBA (2016a, 2016b), and Norman (2017) for further discussion of banks' ROE targets).[29]
The question remains as to why the major banks may have this preference. From the dividend discount model (e.g. Norman 2017), a constant ROE reduces the correlation between a bank's share price and the cash rate.[30] To the extent that equity investors desire this reduced correlation, increasing intermediate pass-through to ROE may increase this bank's future cost of equity (by increasing the equity premium), thereby increasing future average prices for the bank's customers. Determining whether bank customers would prefer lower average prices or more complete pass-through is beyond the scope of this paper.
6. Conclusions and Policy Implications
In this paper, we have constructed a detailed model of banks' balance sheets and have used the model to determine the pass-through of monetary policy to the major banks' lending and deposit rates. This method of determining pass-through is a novel approach in the literature, and is preferred over existing approaches, because our approach:
- can more credibly identify the true response to changes in monetary policy (e.g. we more effectively control for changes in banks' funding markets, properly account for changes in cash rate expectations, and our analysis will not be influenced by unobserved changes in banks' pricing decisions);
- does not make the problematic assumption that interest rates are non-stationary and cointegrated; and
- does not rely on panel models that would require the brave assumption that we had completely controlled for the differences between the major banks and other banks.
Moreover, our novel approach allows each balance sheet component to be separately modelled, thereby permitting identification of any offsetting intermediate effects, differing speeds, and nonlinearities.
While we find that the major banks' intermediate pass-through differs across non-discretionary components, the components' deviations from full intermediate pass-through have been partially offsetting. This is mostly due to the positive relationship between the cash rate and provisioning being partially offset by the negative relationship between the cash rate and the no-/low-interest deposit spread. In aggregate, intermediate pass-through has been slightly amplified by the non-discretionary components.
Between 2003 and 2012, this amplification was offset by ROE, such that aggregate pass-through to the major banks' lending and deposit rates was broadly one-for-one. Since mid 2012, aggregate pass-through has been less than 100 per cent as the correlation between ROE and the cash rate has been lower than during 2003–12. Nevertheless, because the share of equity in banks' funding is small, aggregate pass-through remains high (around 90 per cent). So this channel of monetary policy transmission remains very effective (in contrast to the estimates in Table 1).
We also identify multiple nonlinearities that may have affected recent pass-through and may become more important if the cash rate were to be reduced further:
- At low interest rates, the difference between the rate on no-/low-interest deposits and the rate on other deposits may be sufficiently small that cash rate reductions entice people to substitute into no-/low-interest deposits, offsetting the effect of the increasing no-/low-interest deposit spread. But this substitution has a limit, beyond which any cash rate reductions will have a bigger impact on funding costs due to the larger share of no-/low-interest deposits.
- Provisioning rates can only be negative if previously provisioned losses are no longer in danger of being realised. Therefore, the benefit of lower interest rates is likely to weaken as provisioning rates approach zero.
In addition to most of the cash rate changes since 2003 being passed through to lending and deposit rates, they have passed through quickly, with over 80 per cent of the major banks' assets repricing in less than three months. This differs from other banking systems, such as the United States (where three-quarters of housing loans are at long-term fixed rates), the United Kingdom (where around half of housing loans are at rates fixed for one to five years), and Canada (where three-quarters of housing loans are at fixed rates, mostly for five years) (RBA 2009b). As a result, the cash flow channel of monetary policy likely works more quickly in Australia than in jurisdictions with slower pass-through.
However, this means that borrowers and depositors in Australia are more exposed to movements in interest rates than those in other countries.[31] If the low level of long-term fixed-rate loans is demand driven (e.g. because the borrowers are sufficiently less averse to bearing interest rate risk than banks' shareholders), then the Australian system may be welfare maximising. However, if the low level of long-term fixed-rate loans is due to market frictions preventing the efficient pricing of the risk (i.e. supply-side factors), then the Australian system may not be welfare maximising. An assessment of these welfare implications is beyond the scope of this paper.
The features of the Australian banking system may have implications for financial stability. For example, the Australian major banks are not subject to the same countercyclical profitability as banks that assume more interest rate risk (i.e. short-term profits don't fall as interest rates rise due to the repricing mismatch between assets and liabilities). This potentially makes the credit provision of Australian banks more stable across the cycle.
On the other hand, maintaining ROE-level targets as the cash rate falls could increase banks' desire for risk. This incentive has been shown theoretically (e.g. Dell'Ariccia, Laeven and Marquez 2014), and has been highlighted as a potential concern (RBA 2016a; Norman 2017). Over the period we've assessed, the amplified intermediate pass-through to non-discretionary components would have moderated any incentive for banks to ‘search for yield’. However, the nonlinearities mentioned above could reduce the size of the amplification associated with any further cash rate reductions.
Appendix A: The Impact of Hedging on the Model
This appendix explains why, for any hedged interest rate risk or for assets and liabilities with the same repricing term, the ‘spreads to cash rate’ can be replaced with ‘spreads to the relevant reference rates’ and the Equation (2) equality will still hold.
Reproducing Equation (2) without the non-interest incomes/expenses or provisioning rates (as these are not hedged), gives:
Now suppose we group the assets and liabilities into their various repricing terms (where St is the set of assets and liabilities with pre-hedging repricing term t) and rewrite the right-hand side as spreads of the bank interest rates to the reference rates for each repricing term (rt):
Now suppose the bank enters into derivative contracts for some assets and liabilities such that their interest rates are hedged to some other term (term s). For each of these assets in Equation (A1), we need to add a derivative that pays rt and receives rs; and for each of these liabilities, we need to add a derivative that pays rs and receives rt. Let the subset of each St that is hedged into term s be St,s (assets and liabilities that are not hedged belong to the subset St,t), then with the derivatives Equation (A1) becomes:
The above equation can be simplified by regrouping the last four sums into their post-hedging terms:
Equation (A2) produces our results. Assets and liabilities with the same
post-hedging repricing term (t) will belong to one of the
Ss,t subsets. Therefore, the sum  measures the extent of hedging. If interest rate risk for repricing term t
is completely hedged (i.e. the value of assets with post-hedging repricing term of
t equals the value of liabilities with the same post-hedging repricing
term), then
measures the extent of hedging. If interest rate risk for repricing term t
is completely hedged (i.e. the value of assets with post-hedging repricing term of
t equals the value of liabilities with the same post-hedging repricing
term), then  .
.
Therefore, for hedged assets and liabilities, the spreads to cash rate can be replaced with spreads to the relevant reference rates and the Equation (2) equality will still hold.
Since the value of assets is greater than the value of liabilities, there will be some assets with post-hedging repricing terms that are not offset by liabilities. Therefore, even if all liabilities are hedged (as is shown in Figure 2), replacing the spreads to cash of all assets and liabilities in Equation (2) with spreads to reference rates will introduce a new term into Equation (2). This new term will equal:
With all liabilities hedged,  for all t.
Moreover,
for all t.
Moreover,  . So, if we divide this new term by
  , it becomes a weighted average of spreads between
reference rates (rt) and the cash rate (rC),
with weights equal to the post-hedging net position of each term. If we let the
proportional post-hedging net position of each repricing term be represented by
, it becomes a weighted average of spreads between
reference rates (rt) and the cash rate (rC),
with weights equal to the post-hedging net position of each term. If we let the
proportional post-hedging net position of each repricing term be represented by  , then Equation (2) becomes (we have excluded
non-interest incomes/expenses and provisions for simplicity):
, then Equation (2) becomes (we have excluded
non-interest incomes/expenses and provisions for simplicity):
Therefore, our analysis of the ROE spread should not look at the spread to cash, but should look at the ROE spread to a weighted average of reference rates (with the weights determined by the post-hedging repricing term structure of the major banks' balance sheets). This replacement is not necessary in this paper since we add an additional margin to all spreads to convert them into hedged spreads to current/expected cash rates, and we only evaluate the long-run relationship between the ROE and the cash rate (so different repricing terms do not matter).
Appendix B: Principal Component Analysis
| Variable | Detail | Source |
|---|---|---|
| Real GDP | Annual, year-ended growth | RBA statistical table H1 Gross Domestic Product and Income |
| Real GDP forecast | One-year-ahead, annual, year-ended growth | RBA forecast |
| CPI inflation | Year-ended | RBA statistical table G1 Consumer Price Inflation |
| CPI inflation forecast | One-year-ahead, year-ended | RBA forecast |
| Unemployment rate | End of quarter | RBA statistical table H5 Labour Force |
| Unemployment rate forecast | One-year-ahead | RBA forecast |
| Business credit | Nominal, year-ended growth | RBA statistical table D1 Growth in Selected Financial Aggregates |
| Housing credit | Nominal, year-ended growth | RBA statistical table D1 |
| Personal credit | Nominal, year-ended growth | RBA statistical table D1 |
| Business profits(a) | Nominal, year-ended growth | ABS |
| Household disposable income(b) |
Real, annual, year-ended growth | ABS/RBA |
| Established house price index | Year-ended growth | ABS |
| Terms of trade | Year-ended growth | RBA statistical table H1 |
| ASX 200 option-implied volatility(c) |
Quarter average | Thomson Reuters |
|
Notes: (a) Gross operating surplus and gross mixed income |
||
To parsimoniously incorporate information from a large number of variables, we use a common dimensionality reduction technique known as principal component analysis. In short, out of all possible linear combinations of the variables, the first principal component (PC) is the linear combination with the largest variance.[32] The second PC then has the largest variance conditional on the linear combination being orthogonal to the first linear combination. And so on. Ideally, as a result of this process we can construct a small number of variables that contain the majority of the explanatory power contained within the array of original variables. We find that the first two PCs contain 57 per cent of the variation contained within our collection of variables.
Figure B1 shows the time series of the first two PCs (also known as the ‘scores’). From our regression results, after controlling for the cash rate and the yield curve, both PCs have a negative relationship with provisioning rates. Figure B2 shows each underlying variable's ‘loading’ with respect to each PC (to construct each principal component, each underlying variable is multiplied by a loading, these products are then summed). In this figure, the scores are normalised such that the loadings are the correlations between the underlying variables and each PC.
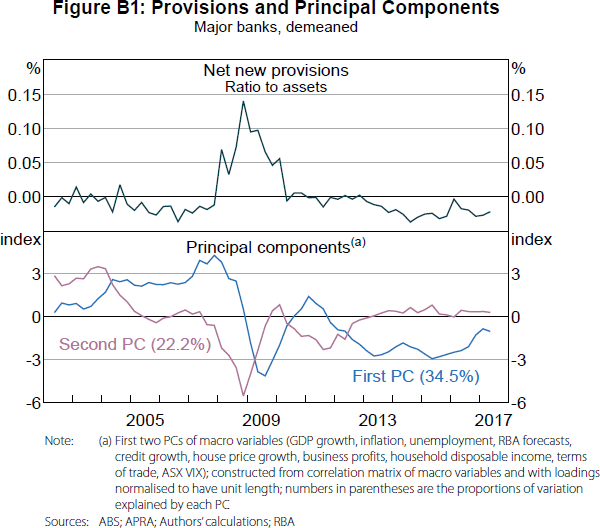
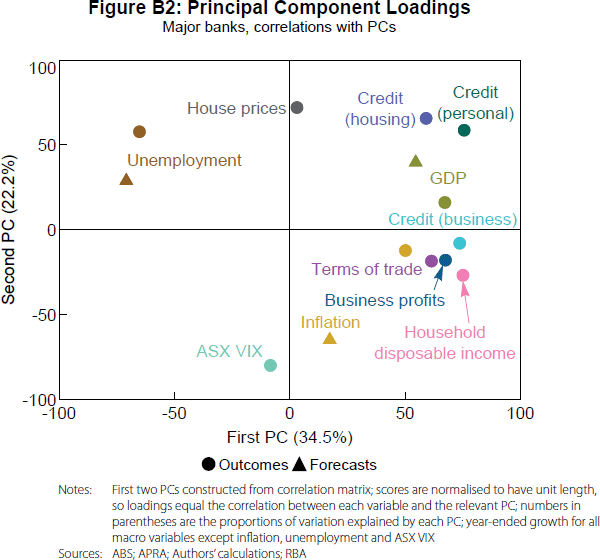
The unemployment rate and its forecast have a strong negative correlation with the first PC, while the credit and income variables have a strong positive correlation.[33] Therefore, the negative relationship between the first PC and provisioning rates is expected. The second PC has a strong negative relationship with the equity volatility index and a strong positive relationship with house prices and household credit, consistent with the second PC's estimated negative relationship with provisioning rates. However, the positive relationship between unemployment and the second PC, and the negative relationship between inflation forecasts and the second PC, are difficult to explain.
One potential problem with using PCs in a regression with other variables (the cash rate and yield curve in our case) is that these other variables could be correlated with the excluded PCs (we only include the first 2, out of 14 PCs), in which case the estimated relationship between the cash rate and provisioning rates may be picking up the relationship between the excluded PCs and provisioning rates rather than the true relationship between the cash rate and provisioning rates (i.e. there may be omitted variable bias).
To evaluate the potential extent of this problem, we regress the cash rate on all excluded PCs. By construction, no other linear combination could reduce the unexplained portion of the cash rate (i.e. the squared residuals are minimised). Therefore, the R2 from this regression can be interpreted as the maximum possible (squared) correlation between the cash rate and the information omitted by only using the first two PCs. We find an R2 of 0.16 and that it is insignificantly different from zero. So we conclude that the estimated relationship between the cash rate and provisioning rates is not just picking up the relationship between provisioning rates and the omitted macro variables.
Appendix C: The Envelope Theorem as It Relates to Cost of Funding
Suppose each bank is subject to a cost function f(x,a), where the vector x contains the bank's discretionary variables and the vector a contains the bank's non-discretionary variables. And that each bank, as a profit maximiser, wants to minimise this cost function subject to a vector of constraints g(x,a) ≥ 0.
Let the constrained optimum values of x be x*(a) (i.e. the optimum values are a function of the non-discretionary variables), and let the Lagrange multipliers at the optimum point be λ*(a). And suppose we put these optimum values back into the cost function to get the constrained optimum value of the cost function: f(x*(a),a).
The Envelope Theorem states that, assuming the cost function and constraints are continuously differentiable, then the total derivative of the optimised cost function with respect to the non-discretionary variables, a, is equal to the partial derivatives of the Lagrangian with respect to a. In other words, to a first-order approximation, we can ignore the effect changes in a have on x*(a) and λ*(a), and just evaluate the effect the change has on the cost function and any binding constraints.
The intuition behind this result is as follows. From the chain rule, the total
derivative of the optimised Lagrangian with respect to a will
include  terms and
  terms.[34]
However, at the optimum, the derivative of the Lagrangian with respect to the
components of x and the Lagrange multipliers must be zero (i.e. the
first-order conditions), so all these terms will equal zero. All that remains of the
total derivative are the partial derivatives of the cost function with respect to
a
terms.[34]
However, at the optimum, the derivative of the Lagrangian with respect to the
components of x and the Lagrange multipliers must be zero (i.e. the
first-order conditions), so all these terms will equal zero. All that remains of the
total derivative are the partial derivatives of the cost function with respect to
a  , and the partial derivatives of the
constraints with respect to a multiplied by the Lagrange
multipliers
, and the partial derivatives of the
constraints with respect to a multiplied by the Lagrange
multipliers  .
.
So what does this mean for our analysis? Take the following simplified summary of a bank's cost minimisation problem:
Subject to:
where rD is the spread on no-/low-interest deposits, x is the share of no-/low-interest deposits, rH is the discretionary spread on the bank's other deposit accounts (e.g. high-interest and term deposits) and y is the share of these deposits, and rW is the cost of wholesale funding and equity. D(y) is some demand function for discretionary deposits (e.g. demand for stable funding).
The two constraints are the supply functions of no-/low-interest deposits and other deposits, respectively; they are a non-negative function of their own spread and a non-positive function of the spreads on substitutes. There is no supply curve for wholesale funding as the bank is assumed to be a price taker in the wholesale market.
When minimising the cost function subject to the constraints, the Lagrange multipliers associated with the no-/low-interest deposit supply curve and the other deposit supply curve are, respectively, λx = rD − rW and λy = rH − rW + D′(y); these are the shadow prices of the constraints.
From the first-order condition for rH:
Assuming rD < rW and that  (both realistic assumptions from the data), the above
equality requires rH − rW + D′(y)
< 0. That is, both shadow prices are negative.
(both realistic assumptions from the data), the above
equality requires rH − rW + D′(y)
< 0. That is, both shadow prices are negative.
Then, from the Envelope Theorem, the change in the cost function following an exogenous increase in rD (i.e. a decrease in the cash rate) equals:
Suppose we further assume that: rH < rD
(a realistic assumption from the data);  (i.e. a change
in rD cannot have a bigger effect (in absolute value) on the
supply of substitute deposits than it has on no-/low-interest deposits); and the
demand for discretionary deposits is not so inelastic that it causes an increase in
rH so large that it completely offsets the cost reduction from
substituting into the cheaper deposits. Then:
(i.e. a change
in rD cannot have a bigger effect (in absolute value) on the
supply of substitute deposits than it has on no-/low-interest deposits); and the
demand for discretionary deposits is not so inelastic that it causes an increase in
rH so large that it completely offsets the cost reduction from
substituting into the cheaper deposits. Then:
The first two terms in Equation (C1) are captured in the ‘funding mix’ part of Figure 8, the third term could be partially captured in the funding mix part and would cause an endogenous increase in rH. Since we know the change in rH will be ≥ 0, the funding mix component must be negative. Moreover, it must be larger in absolute value than any endogenous increase in rH. Therefore, the absolute value of the funding mix component is an upper bound on the total size of the combined indirect effects from changes in the constraints. The counterfactual exercise we run in Section 4.2.5 estimates the size of this upper bound.
Importantly, if the supply curve for no-/low-interest deposits was vertical, both sx and sy would not directly be affected by rD. Therefore, the total change in funding costs resulting from an increase in rD would be the direct effect (xdrD).
Appendix D: Accuracy of the Lending Spreads Part of the Model
The shares of each asset component – the βi parameters in Equation (2) – are calibrated using APRA data reported by the major banks and other balance sheet data obtained by the RBA. The spreads are estimated from major bank interest rate data collected by the RBA.
The loan asset classes are: housing loans (split into the various combinations of owner-occupier/investor, principal and interest/interest only, variable/fixed), home equity loans, unsecured personal loans (variable/fixed), credit cards, margin loans, and business loans (small/large, variable/bank bills/fixed). The RBA collects interest rate data on each of these asset classes (including average discounts on the advertised rates offered by the major banks), and we use information on the repricing maturity of these loans to convert these interest rates into spreads to reference rates. The offset accounts of home loans are assigned an interest rate of zero.
This appendix evaluates how well the loan assets part of our model lines up with more aggregated data reported to APRA. While the reported data may be more accurate than our model estimates, they likely also contain measurement error and do not provide a sufficiently rich breakdown for our purposes. For example, we need to know the repricing terms of the various loan types, the shares of each loan type, and the spreads to reference rates of the loans. None of the data used for comparison in this section was used to calibrate our model, so this is a true external validation exercise.
Figure D1 compares quarterly average outstanding loan rates estimated from our model, to quarterly average lending rates reported to APRA by the banks. Our model provides a close approximation to the reported rates. Moreover, it is not just the broad trends that are matched, but the shape of the interest rate curves. These results give us confidence in the accuracy of our assumptions and calibration.
While the quarterly average rates reported by APRA provide the best comparison, we only have data from 2009. For a longer time series, we approximate quarterly average lending rates from the major banks' quarterly interest income data reported to APRA. The APRA data in Figure D2 are constructed by taking the quarterly loan interest income, dividing it by the average loan balance during the quarter, and annualising.
The APRA data in Figure D2 are constructed on a ‘licensed authorised deposit-taking institution (ADI)’ basis, while our model and the APRA data in Figure D1 are based on the ‘domestic book of the licensed ADI’. So we do not expect our model to align as closely in Figure D2 as it does in Figure D1. That said, our model closely approximates these licensed ADI estimates over the entire sample, providing further validation of our assumptions and calibration.
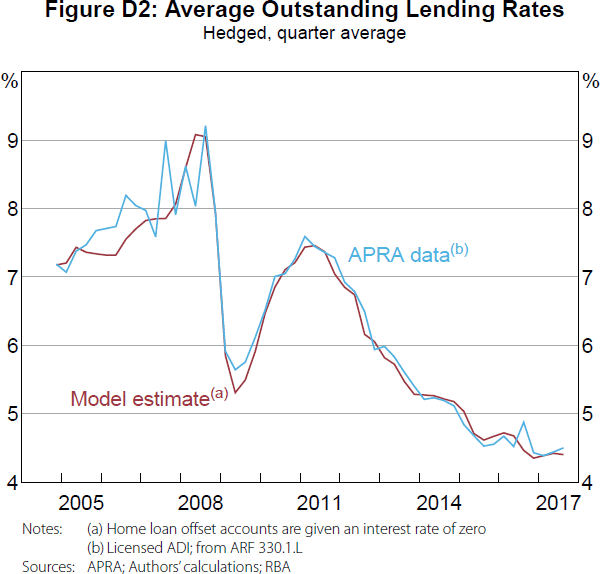
Appendix E: Further Details about the Construction of Debt Funding Spreads
This appendix outlines the construction of debt funding spreads and funding shares in more detail.
Wholesale debt
The long-term debt spreads at issuance are estimated from a combination of primary and secondary market data.
We use BBSW rates as the measure of domestic short-term funding costs. For foreign currency debt, we add the cost of foreign currency hedging to get an estimate of the hedged foreign currency cost.
Term deposits
We estimate the weighted-average outstanding term deposit spread from a daily time series of advertised term deposit ‘special’ rates on new (and rolled-over) deposits, monthly APRA data on the total outstanding volume of term deposits, quarterly APRA data on the remaining time to maturity of outstanding term deposits, and an ad hoc query of the banks' actual average cost of term deposits.
The interest rate data is collected for monthly maturities up to 12 months, plus 24-, 36-, and 60-month maturities; at each point in time, only a subset of maturities will have a ‘special’ rate. We begin by assigning these maturities into short, medium, and long buckets (X ∈{S,M,L}). For each maturity (m), let Tm be the length of that maturity in days. And use rm,t,i to denote the spread to equivalent-maturity OIS of a new m-month special term deposit issued on day t − i. We compute the weighted-average outstanding term deposit spread as:
where:
- Vt−i is the outstanding volume of term deposits at time t − i. This is intended to proxy for the relative volume of new and rolled-over deposits. Since the level of V doesn't matter, this will be a good proxy as long as the portion of outstanding term deposits that are new or rolled does not change much over time.
-
βX,t−i is the share of new term deposits at time
t − i with a maturity in bucket X. We use a
time series on the ‘remaining time to maturity’ structure to
recursively estimate the β parameters. We aggregate maturities
into buckets because not every maturity will have a special rate on every day,
and because our remaining time to maturity data is not available at a monthly
disaggregation.
- Specifically, we assume the longest remaining time to maturity category are all new term deposits (i.e. we assume the banks do not offer longer-maturity deposits). For the next longest category, we take the residual maturity data and remove the deposits in the longest maturity category that were issued in the previous period (as these would still be outstanding); this gives an estimate of the new term deposits issued with this maturity. This process continues until we reach the shortest maturity category.
- Im,t−i is an index function equal to one if at least one of the major banks offered a ‘special’ rate on a term deposit of maturity m on day t − i; it is equal to zero otherwise. We are implicitly assuming that no-one chooses a term deposit of this maturity if there is not a special rate. We divide this index by Tm to account for the fact that depositors with a preference for longer maturities will roll their term deposits less frequently; all else being equal, this means a given depositor is more likely to choose a shorter-term deposit. The sum is included in the denominator to ensure the share of new deposits at time t − i with a maturity in bucket X equals βX,t − i.
-
q is a constant derived from the ad hoc bank query (only our most
recent query asked about term deposits); its value ensures the
 we compute for 30 June 2017 equals the average value
provided by the major banks through the query for this day. This constant is
designed to account for any unadvertised special rates provided to some
customers. We compute a value of q equal to 16 basis points.
we compute for 30 June 2017 equals the average value
provided by the major banks through the query for this day. This constant is
designed to account for any unadvertised special rates provided to some
customers. We compute a value of q equal to 16 basis points.
-
The average must include spreads on all term deposits still outstanding. We
assume term deposits remain outstanding until their original maturity date has
been reached. This is accounted for in the
 sum.
sum.
At-call high-interest deposits
We use data from the ad hoc queries of the major banks to determine the total volume of the major banks' at-call high-interest accounts (such as online savings accounts, bonus saver accounts, and cash management accounts); we interpolate the data between queries.[35] We then use interest rate data collected by the RBA to determine the advertised spread to the cash rate on these deposits at each point in time. We add a constant to account for any difference between the advertised and actual rates given to some customers; we compute an average difference of 15 basis points (based on the difference between our advertised weighted average rate and the rates reported in the ad hoc queries).
Wholesale deposits
For corporations, pension funds, and governments, we assume their remaining deposit accounts pay interest rates that move with rates in the domestic markets for short-term bank debt securities (these are converted into spreads to OIS); these securities are plausible substitutes for many of these institutions. From the ad hoc queries, we found that the average difference between these deposit rates and the rates on short-term debt securities was −71 basis points; so we add this constant to the short-term debt spreads to get our estimate of wholesale deposit spreads.
The volume of these deposits are computed as a residual – the total volume of deposits minus the deposits assigned to other categories.
No-/low-interest deposits
The volumes of non-interest bearing deposits, and low but fixed-rate deposits of households and unincorporated enterprises, are computed from the ad hoc queries of the major banks; we interpolate the data between queries. We estimate the low fixed rate using the average rate on these deposits reported in the queries (1.01 per cent). We assume banks hedge these no-/low-interest deposits into a variable interest rate exposure by entering into 3-year fixed-for-floating swaps (this is known as a ‘replicating portfolio’ hedge); this variable rate is converted into a spread to OIS.
Appendix F: Excluding Components from Return on Equity (ROE)
From Equation (2), we have the following relationship between the ROE and the various components that must sum to equal the ROE:
where we have split out the discretionary and non-discretionary components (D is the set of discretionary lending and deposit components), and we have added a time subscript (t).
Equation (F1) is not a causal equation. That is, banks have discretion over their discretionary lending and deposit rates (by definition), and therefore have discretion over their ROE. So this equation is not enough for us to determine the level of ROE for a given level of the non-discretionary components. To characterise the behaviour of the banks, we define the following general behavioural function that determines a bank's ROE:
where ft (·) is some (potentially time-varying) function that determines the systematic response of the bank's ROE to some set of variables (Xt and rC,t), and εt is some mean-zero independent random component (that would have a variance of zero if ROE is completely deterministic given Xt and rC,t). This equation is sufficiently general to cover all possible behavioural response functions, but it is not very helpful in its current form. To get something more useful, we require more assumptions.
Splitting ft(Xt,rC,t) into f2,t(Xt,rC,t) and a part of the function that is orthogonal to rC,t (call it f1,t(Xt)) is innocuous because we can recover ft(Xt,rC,t) by setting f1,t(Xt) ≡ 0. So we rewrite Equation (F2) as:
From Equation (F1), for any change in the non-discretionary components that results
from a cash rate change, there exists some
f2,t(Xt,rC,t)
such that the aggregate pass-through to discretionary lending and deposit rates is
one-for-one. From Equation (F1), this function (call it  )
must satisfy:
)
must satisfy:
where  are the non-discretionary components, and we have
assumed the equity share does not change with the cash rate.
are the non-discretionary components, and we have
assumed the equity share does not change with the cash rate.
To determine whether aggregate pass-through to discretionary lending and deposit
rates is one-for-one, we need to determine whether  .
With some assumptions, this can be done by looking at the co-movement of
.
With some assumptions, this can be done by looking at the co-movement of  and
and  over time.
First, we assume the changes in rE,t not caused by
changes in the cash rate are also not correlated with changes in the cash
rate. For changes in f1,t(Xt) and
εt, this is true by construction. For
f2,t (Xt,rC,t),
this requires  and
and  to not
be correlated with
to not
be correlated with  . If this assumption holds, then with
a sufficiently large sample we would be able to statistically determine whether the
pattern in
. If this assumption holds, then with
a sufficiently large sample we would be able to statistically determine whether the
pattern in  is significantly different from
  plus uncorrelated noise.
For a given sample size, the accuracy of this statistical analysis decreases as the variance of the uncorrelated noise increases. So, when constructing rE,t from the components of our model, we can increase the accuracy of our analysis by excluding components of the uncorrelated noise.
From Section 4.4, net non-interest income is volatile and is not correlated with the cash rate. Therefore, if net non-interest income is part of the majors' ROE behavioural function, it would be in the uncorrelated noise (specifically, it would be in f1,t(Xt)), and excluding it would increase the accuracy of our analysis. So we exclude net non-interest income from ROE.[36]
Second, we exclude provisioning. From Section 4.1,
changes in the provisioning rate can be caused by both changes in the cash rate and
changes in other factors. Since these other factors can be large, excluding
provisioning and adjusting  accordingly may improve the
accuracy of our analysis. Unfortunately, with provisioning rates being correlated
with the cash rate, if provisioning is not part of f2,t(Xt,rC,t)
then excluding it from ROE will introduce a bias into our analysis (because the
erroneously excluded component will go into εt and will
be correlated with the cash rate). Therefore, by excluding provisioning from ROE we
are implicitly assuming that all provisioning is captured in
f2,t(Xt,rC,t).
The large reduction in the variance of ROE–NII after excluding provisioning is
evidence in favour of this assumption.
accordingly may improve the
accuracy of our analysis. Unfortunately, with provisioning rates being correlated
with the cash rate, if provisioning is not part of f2,t(Xt,rC,t)
then excluding it from ROE will introduce a bias into our analysis (because the
erroneously excluded component will go into εt and will
be correlated with the cash rate). Therefore, by excluding provisioning from ROE we
are implicitly assuming that all provisioning is captured in
f2,t(Xt,rC,t).
The large reduction in the variance of ROE–NII after excluding provisioning is
evidence in favour of this assumption.
At each point in time (T), the ‘one-for-one pass-through’ line in Figure 12 is defined as:
where  is
is  excluding the ROE
response to provisioning, CLA denotes ‘cash and liquid assets’,
ND denotes no-/low-interest deposits, μ is the adjustment
required for the 2003–07 average to equal zero,
and Δ(rND,t − rC,t) accounts for
the replicating portfolio hedge.
excluding the ROE
response to provisioning, CLA denotes ‘cash and liquid assets’,
ND denotes no-/low-interest deposits, μ is the adjustment
required for the 2003–07 average to equal zero,
and Δ(rND,t − rC,t) accounts for
the replicating portfolio hedge.
Footnotes
The authors are from Economic Research Department (Brassil) and Domestic Markets Department (Cheshire and Muscatello) of the Reserve Bank of Australia. Views expressed in this paper are those of the authors and not necessarily those of the Reserve Bank of Australia. [*]
The RBA implements monetary policy via a target for the average interest rate banks charge each other for unsecured overnight loans – the ‘cash rate’. See Baker and Jacobs (2010) for information on how the RBA operates in markets to achieve this target. [1]
In addition to banks, loans can be made by non-bank authorised deposit-taking institutions (non-bank ADIs) and non ADIs. However, the non-bank share of the market is currently small. For example, non-bank ADIs account for less than 3 per cent of outstanding residential mortgages (APRA 2018), while non ADIs account for less than 5 per cent (Gishkariany, Norman and Rosewall 2017). [2]
The RBA Board has accounted for financial market and regulatory developments when setting the cash rate target (e.g. Debelle 2012; Lowe 2012). [3]
By ‘discretionary’ we mean that the price is a choice variable of the bank. Importantly, we are not claiming that this choice is unconstrained (e.g. competition and regulations constrain banks' choices), only that it is not exogenously determined. [4]
The cash and liquid assets referred to here are those in the ‘cash and liquid assets’ category reported to APRA. Importantly, ‘trading securities’ and ‘investment securities’ are in separate categories, even though they may be liquid. [5]
This assumes that no-/low-interest deposit rates cannot go below zero. There are policy suggestions that could allow deposit rates to move below zero; see Rogoff (2017), for example. [6]
In the long run, monetary policy rates equal the neutral real interest rate plus inflation, with the neutral real rate being the real interest rate that equates saving and investment in the long run, and inflation being determined by the inflation target (McCririck and Rees 2017). There is disagreement as to whether global neutral real rates have a unit root or whether they exhibit structural breaks and/or nonlinear mean reversion (Neely and Rapach 2008). [7]
To get an idea of the potential problem, the regressions in Table 1 are typical of the long-run analysis literature, with these pass-through estimates differing markedly from the results of our analysis. [8]
There are 86 banks in Australia (of which 44 are branches of foreign banks), with the 4 major banks accounting for around 80 per cent of domestic banking assets. In contrast, the US and European banking systems consist of thousands of banks, and are far less concentrated than the Australian banking system (based on the Herfindahl-Hirschman indices reported in Wheelock (2011) and Deloitte Access Economics (2014)). [9]
The reference rates for assets/liabilities with terms longer than one year are the rates at which the market is willing to swap a stream of fixed interest payments for a stream of variable-rate payments (each term will have a different reference rate). The reference rates for shorter-term assets/liabilities are the variable interest rates typically used in these swaps, known as bank bill swap (BBSW) rates (Gizycki and Gray 1994).
Importantly, we are not saying that the derivative instruments used for hedging do not influence profits; banks can still gain or lose money on these derivatives if future short-term rates do not turn out as expected. All we are saying is that, if these derivatives offset other positions on a bank's balance sheet, then any gain/loss on the derivatives will be offset by a loss/gain on the balance sheet (i.e. their interest rate risk is hedged).
For assets and liabilities with the same repricing term, the spreads to cash rate in Equation (2) can trivially be replaced by spreads to the relevant reference rates; any change in reference rates are offsetting by virtue of the assets and liabilities having the same repricing term.
[10]Overnight index swaps (OIS) are ‘derivatives in which one party agrees to pay the other party a fixed interest rate in exchange for receiving the average cash rate recorded over the term of the swap’ (Finlay and Chambers 2008, p 11). [11]
Hoffmann et al (2017) find that euro area banks use derivatives to reduce interest rate risk by only 25 per cent, while Begenau, Piazzesi and Schneider (2015) finds that US banks use derivatives to increase interest rate risk. [12]
From the Envelope Theorem, changes in the cash rate influence funding costs through any direct effects on spreads and through changes in any binding constraints (to a first-order approximation, see Appendix C for explanation). [13]
We regress provisioning rates on the levels of these variables, rather than the changes, because of the way provisions are constructed. Individual provisions require a loan to be identified as being ‘impaired’, while provisions for ‘currently unidentified’ losses incorporate both the prevailing economic conditions and historical loss experience (RBA 2009a); the latter meaning provisions do not all occur the moment conditions deteriorate. [14]
Our residuals exhibit serial correlation (Figure 3). To remove the serial correlation we estimated a version of the model including the first lag of the dependent variable and regressors. These lags increased the explained variation to 79 per cent. However, this model exhibited features symptomatic of overfitting, which is why it is not our preferred model. For example, with cash rate changes typically being small except for December quarter 2008, the model uses the large change in this quarter to ‘explain’ the large positive residual (Figure 3), even though the large change was a fall in the cash rate (so it should not have caused an increase in provisioning rates). In any case, even with the likely overfitting, the conclusion that the cash rate level has a positive relationship with provisioning rates remained. [15]
Our assumptions in this section are similar to the assumptions used in previous RBA work. See Davies et al (2009) and Berkelmans and Duong (2014), for example. [16]
See APRA (2006) for a breakdown of what banks report to APRA. [17]
If the cash rate cycle is shorter than the length of the hedge, then the amplitude of the cycle in no-/low-interest spreads will be smaller after hedging, but the amplitude will not be zero (so this is only a partial hedge). [18]
The APRA data in Figure 6 is constructed by taking the quarterly deposit expense, dividing it by the average deposit balance during the quarter, and annualising. Figure 7 is similarly constructed – dividing total interest expense by average interest-bearing liabilities during the quarter. [19]
Even after extracting the cash rate, there is still a high correlation between the model estimates and the APRA data in Figures 6 and 7 (over 80 per cent). [20]
Wholesale debt markets include the markets for bank bills, certificates of deposits, bonds, asset-backed securities, and hybrid securities. [21]
This is an assumption about being able to move the market. This assumption does not cover a change in debt volumes sufficiently large to change the risk characteristics of the issuing bank. [22]
When there is substitution, an exogenous increase in the no-/low-interest deposit spread is expected to reduce the supply of substitute deposits (as depositors switch to the no-/low-interest deposits), thereby increasing the spread on these deposits and reducing their shares. [23]
For the counterfactual exercise, we retain the reduction in the share of term deposits, but reallocate the increase in no-/low-interest deposits to high-interest deposit accounts. [24]
It is possible that the usual difference between no-/low-interest spreads and spreads on other deposits is typically too large for small changes in these spreads to affect the supply of no-/low-interest deposits (i.e. the supply curve of the no-/low-interest share is typically vertical), but also that depositors are more willing to keep funds in these accounts when the spread differential reaches a sufficiently low level. [25]
Despite the increasing spread, there is no evidence of the major banks shifting their asset mix towards these cash and liquid assets. Regressing the share of these assets on the cash rate produces an R2 of just 5 per cent. [26]
The 3–9 basis point range accounts for the no-/low-interest deposit number being an upper bound. [27]
The ROE–NII constructed here is based on the domestic books of the licensed ADI (as opposed to the global operations of the consolidated group). Our model-based measure of ROE–NII is defined as ‘interest income’ minus ‘provisioning’ minus ‘interest expenses’, all divided by equity. Constructing this measure requires us to calibrate the shares and spreads of the loan assets in our model. See Appendix D for details about our calibration and for an assessment of model accuracy. [28]
Regulatory changes to investor and interest-only loans, and the fall in net non-interest income during 2016 (Figure 11), may have contributed to the increase in ROE–EP since 2016 (see ACCC (2018) for a discussion of banks' price-setting behaviour during this period). [29]
This is a theoretical argument about how changes in the relationship between ROE and the cash rate affect the correlation between banks' share prices and the cash rate. Importantly, increases in equity premia, even if they occur at the same time as cash rate reductions, need not prevent ROE from moving with the cash rate, as the share price would move to compensate. Davis (2012) provides an in-depth discussion of the relationship between banks' cost of equity, return on equity, and share price. [30]
While interest rate risk is not diversifiable, heterogeneity in individuals' ability to manage this shock creates an idiosyncratic default risk that can be diversified away. Increasing the prevalence of fixed rate loans may therefore improve welfare. [31]
More accurately, our method normalises each variable by its standard deviation before conducting the PCA. So the first PC maximises the normalised variance. [32]
The interpretation here is that falling credit growth signals poor macroeconomic conditions and/or a reduced ability of borrowers to refinance, which then causes provisioning rates to rise. Alternatively, higher credit growth could reduce provisioning rates to the extent that new borrowers are of higher credit quality than the existing stock of loans (Borio et al 2015). However, another possibility is that higher provisioning rates reduce profitability, causing banks to pull back on lending (i.e. reverse causality). [33]
The complementary slackness condition from the Karush–Kuhn–Tucker theorem means that f(x*(a),a) and the Lagrangian at x*(a) and λ*(a) are identical. [34]
These ad hoc queries occur on an approximately annual basis. [35]
If net non-interest income is not part of the majors' ROE behavioural function, then excluding it from ROE would add a component to εt. This would increase the variance of the uncorrelated noise and reduce the accuracy of our analysis, but it would not introduce a bias (because net non-interest income is uncorrelated with the cash rate). The smaller variance of ROE–NII relative to ROE suggests that net non-interest income is part of the majors' ROE behavioural function. [36]
References
ACCC (Australian Competition and Consumer Commission) (2018), ‘Residential Mortgage Price Inquiry: Interim Report’, March.
Alessandri P and BD Nelson (2015), ‘Simple Banking: Profitability and the Yield Curve’, Journal of Money, Credit and Banking, 47(1), pp 143–175.
Altavilla C, M Boucinha and J-L Peydró (2017), ‘Monetary Policy and Bank Profitability in a Low Interest Rate Environment’, ECB Working Paper No 2105.
Andreasen MM, M Ferman and P Zabczyk (2013), ‘The Business Cycle Implications of Banks' Maturity Transformation’, Review of Economic Dynamics, 16(4), pp 581–600.
Andries N and S Billon (2016), ‘Retail Bank Interest Rate Pass-Through in the Euro Area: An Empirical Survey’, Economic Systems, 40(1), pp 170–194.
Angeloni I and M Ehrmann (2003), ‘Monetary Transmission in the Euro Area: Early Evidence’, Economic Policy, 18(37), pp 469–501.
Apergis N and A Cooray (2015), ‘Asymmetric Interest Rate Pass-Through in the U.S., the U.K. and Australia: New Evidence from Selected Individual Banks’, Journal of Macroeconomics, 45, pp 155–172.
APRA (Australian Prudential Regulation Authority) (2006), ‘ARF_320_0: Statement of Financial Position (Domestic Books)’, Plain English Taxonomy form, rev 10 April 2017, viewed 17 March 2018. Available at <http://webarchive.nla.gov.au/gov/20171113042437/http://www.apra.gov.au/sbr-pet/ARF/ARF_320_0-D2A2.html>.
APRA (2018), ‘Quarterly ADI Property Exposures December 2017’, Statistical publication, accessed 17 March 2018. Available at <https://www.apra.gov.au/publications/quarterly-authorised-deposit-taking-institution-property-exposures>.
Aristei D and M Gallo (2014), ‘Interest Rate Pass-Through in the Euro Area during the Financial Crisis: A Multivariate Regime-Switching Approach’, Journal of Policy Modeling, 36(2), pp 273–295.
Atkin T and G La Cava (2017), ‘The Transmission of Monetary Policy: How Does It Work?’, RBA Bulletin, September, pp 1–8.
Baker A and D Jacobs (2010), ‘Domestic Market Operations and Liquidity Forecasting’, RBA Bulletin, December, pp 37–43.
Bech M and A Malkhozov (2016), ‘How Have Central Banks Implemented Negative Policy Rates?’, BIS Quarterly Review, March, pp 31–44.
Begenau J, M Piazzesi and M Schneider (2015), ‘Banks' Risk Exposures’, NBER Working Paper No 21334.
Berkelmans L and A Duong (2014), ‘Developments in Banks' Funding Costs and Lending Rates’, RBA Bulletin, March, pp 69–75.
BIS (Bank for International Settlements) (2017), ‘Debt Securities Statistics’, accessed 17 March 2018. Available at <https://www.bis.org/statistics/secstats.htm>.
Black S, A Brassil and M Hack (2010), ‘Recent Trends in Australian Banks' Bond Issuance’, RBA Bulletin, March, pp 27–33.
Borio C and W Fritz (1995), ‘The Response of Short-Term Bank Lending Rates to Policy Rates: A Cross-Country Perspective’, BIS Working Paper No 27.
Borio C, L Gambacorta and B Hofmann (2015), ‘The Influence of Monetary Policy on Bank Profitability’, BIS Working Paper No 514.
Brown A, M Davies, D Fabbro and T Hanrick (2010), ‘Recent Developments in Banks' Funding Costs and Lending Rates’, RBA Bulletin, March, pp 35–44.
Brunnermeier MK and Y Koby (2017), ‘The “Reversal Interest Rate”: An Effective Lower Bound on Monetary Policy’, Unpublished manuscript, Princeton University, 10 July.
Cheung B (2017), ‘Developments in Banks' Funding Costs and Lending Rates’, RBA Bulletin, March, pp 45–50.
Claessens S, N Coleman and M Donnelly (2017), ‘“Low-For-Long” Interest Rates and Banks' Interest Margins and Profitability: Cross-Country Evidence’, Board of Governors of the Federal Reserve System International Finance Discussion Papers No 1197.
Cœuré B (2012), ‘Central Banks and the Challenges of the Zero Lower Bound’, Speech given at the ‘Meeting on the Financial Crisis’, hosted by the Initiative on Global Markets, at the University of Chicago Booth School of Business, Miami, 19 February.
Cook B and D Steenkamp (2018), ‘Funding Cost Pass-Through to Mortgage Rates’, Reserve Bank of New Zealand Analytical Note AN2018/02.
Darracq Paries M, DN Moccero, E Krylova and C Marchini (2014), ‘The Retail Bank Interest Rate Pass-Through: The Case of the Euro Area during the Financial and Sovereign Debt Crisis’, ECB Occasional Paper Series No 155.
Davies M, C Naughtin and A Wong (2009), ‘The Impact of the Capital Market Turbulence on Banks' Funding Markets’, RBA Bulletin, June, pp 1–13.
Davis K (2012), ‘Banking Profitability, Bank Capital and Competition’, Australian Centre for Financial Studies Financial Regulation Discussion Paper FRDP 2012 – 1.
de Bondt GJ (2005), ‘Interest Rate Pass-Through: Empirical Results for the Euro Area’, German Economic Review, 6(1), pp 37–78.
Debelle G (2012), ‘Bank Funding’, Opening Keynote Address given to the 2012 KangaNews DCM Summit, Sydney, 22 March.
Dell'Ariccia G, L Laeven and R Marquez (2014), ‘Real Interest Rates, Leverage, and Bank Risk-Taking’, Journal of Economic Theory, 149, pp 65–99.
Deloitte Access Economics (2014), ‘Competition in Retail Banking’, Report commissioned by the Australian Bankers' Association, March. Available at <https://www2.deloitte.com/content/dam/Deloitte/au/Documents/Economics/deloitte-au-economics-retail-banking-competition-010314.pdf>.
Eggertsson GB, RE Juelsrud and E Getz Wold (2017), ‘Are Negative Nominal Interest Rates Expansionary?’, NBER Working Paper No 24039.
Fabbro D and M Hack (2011), ‘The Effects of Funding Costs and Risk on Banks' Lending Rates’, RBA Bulletin, March, pp 35–41.
Finlay R and M Chambers (2008), ‘A Term Structure Decomposition of the Australian Yield Curve’, RBA Research Discussion Paper No 2008-09.
Fitzpatrick R and G White (2017), ‘Banking Fees in Australia’, RBA Bulletin, June, pp 35–39.
Gambacorta L (2008), ‘How Do Banks Set Interest Rates?’, European Economic Review, 52(5), pp 792–819.
Gerali A, S Neri, L Sessa and FM Signoretti (2010), ‘Credit and Banking in a DSGE Model of the Euro Area’, Journal of Money, Credit and Banking, 42(s1), pp 107–141.
Gishkariany M, D Norman and T Rosewall (2017), ‘Shadow Bank Lending to the Residential Property Market’, RBA Bulletin, September, pp 45–52.
Gizycki M and B Gray (1994), ‘Default Risk and Derivatives: An Empirical Analysis of Bilateral Netting’, RBA Research Discussion Paper No 9409.
Hoffmann P, S Langfield, F Pierobon and G Vuillemey (2017), ‘Who Bears Interest Rate Risk?’, Unpublished manuscript, October.
Horvath R, J Kotlebova and M Siranova (2018), ‘Interest Rate Pass-Through in the Euro Area: Financial Fragmentation, Balance Sheet Policies and Negative Rates’, Journal of Financial Stability, 36, pp 12–21.
Hristov N, O Hülsewig and T Wollmershäuser (2014), ‘The Interest Rate Pass-Through in the Euro Area during the Global Financial Crisis’, Journal of Banking & Finance, 48, pp 104–119.
La Cava G, H Hughson and G Kaplan (2016), ‘The Household Cash Flow Channel of Monetary Policy’, RBA Research Discussion Paper No 2016-12.
Lowe P (1995), ‘The Link between the Cash Rate and Market Interest Rates’, RBA Research Discussion Paper No 9504.
Lowe P (2012), ‘Bank Regulation and the Future of Banking’, Remarks to the 41st Australian Conference of Economists ‘The Future of Economics: Research, Policy and Relevance’, Melbourne, 11 July.
Maddala GS and I-M Kim (1998), Unit Roots, Cointegration, and Structural Change, Themes in Modern Econometrics, Cambridge University Press, Cambridge.
McCririck R and D Rees (2017), ‘The Neutral Interest Rate’, RBA Bulletin, September, pp 9–18.
McKinnon T (2018), ‘Developments in Banks' Funding Costs and Lending Rates’, RBA Bulletin, March, viewed 3 May 2018.
Neely CJ and DE Rapach (2008), ‘Real Interest Rate Persistence: Evidence and Implications’, Federal Reserve Bank of St. Louis Working Paper 2008-018A.
Norman D (2017), ‘Return on Equity, Cost of Equity and the Implications for Banks'’, RBA Bulletin, March, pp 51–58.
RBA (Reserve Bank of Australia) (2009a), ‘Box A: Banks' Provisioning’, Financial Stability Review, September, pp 39–41.
RBA (2009b), ‘Box B: An International Comparison of Pass-Through of Policy Rate Changes to Housing Loan Rates’, Statement on Monetary Policy, February, pp 57–58.
RBA (2014a), ‘Box B: Australian Major Banks' Cost-to-Income Ratios’, Financial Stability Review, September, pp 35–38.
RBA (2014b), Submission to the Financial System Inquiry, Reserve Bank of Australia, Sydney, March.
RBA (2016a), ‘Box C: Recent Developments in Australian Banks' Capital Position and Return on Equity’, Financial Stability Review, October, pp 40–43.
RBA (2016b), Financial Stability Review, April.
Rodgers D (2015), ‘Credit Losses at Australian Banks: 1980–2013’, RBA Research Discussion Paper No 2015-06.
Rogoff K (2017), ‘Dealing with Monetary Paralysis at the Zero Bound’, Journal of Economic Perspectives, 31(3), pp 47–66.
Simon J (2015), ‘Low Interest Rate Environments and Risk’, Address given to the Paul Woolley Centre for the Study of Capital Market Dysfunctionality Conference ‘Are Financial Markets in the Eye of the Storm?’, Sydney, 8 October.
Van den Heuvel SJ (2007), ‘The Bank Capital Channel of Monetary Policy’, Unpublished manuscript, The Wharton School, University of Pennsylvania, June.
von Borstel J, S Eickmeier and L Krippner (2016), ‘The Interest Rate Pass-Through in the Euro Area during the Sovereign Debt Crisis’, Journal of International Money and Finance, 68, pp 386–402.
Wheelock DC (2011), ‘Banking Industry Consolidation and Market Structure: Impact of the Financial Crisis and Recession’, Federal Reserve Bank of St. Louis Review, 93(6), pp 419–430.
World Bank (2017), ‘Global Financial Development Database’, accessed 23 February 2018. Available at <http://www.worldbank.org/en/publication/gfdr/data/global-financial-development-database>.