RBA Annual Conference – 1994 Internationalisation and the Macroeconomy David Gruen and Geoffrey Shuetrim[*]
1. Introduction
Australia has been a small open economy since at least 1788. In the subsequent two hundred years, trade and financial links with the rest of the world have been of crucial importance. In other words, internationalisation of the Australian economy is not a recent phenomenon.
What is a recent phenomenon, however, is the development of a widespread view within the Australian political/economic community that there are substantial gains for Australia from becoming more outwardly oriented. This view evolved, primarily, as the Australian counterpart of a world-wide appreciation that economies with an outward focus, like those in East Asia, generate more impressive economic outcomes than those with an inward focus. In Australia, there was growing disillusionment with the performance of the domestic economy under insular policies largely inherited from the days of Federation (colourfully summarised by Henderson (1990) as the ‘Federation Trifecta’ of the White Australia Policy, ‘protection all round’ and centralised industrial relations).
In this paper, we examine some of the macroeconomic implications of the increasing outward orientation of the Australian economy. From the perspective of internationalisation, three key changes to the economic landscape have had (and will continue to have) a significant impact on the behaviour of the Australian macroeconomy.
The first key change is the substantial fall in protection that has taken place over the past twenty five years and particularly in the 1980s (see Figure 7 in Fahrer and Pease, this Volume). This fall in protection has been one of the factors responsible for a strongly rising trade share of GDP since the early 1980s. With further falls in protection projected to the year 2000, the trade share should continue to rise. A consequence of this rising trade share is that the exchange rate has an increasingly important influence on both domestic inflation and activity. Falling levels of protection have also contributed to a diversification of Australia's export base, both by convincing many Australian firms that they could not survive solely with domestic sales, as well as by re-directing domestic factors of production from import competition and the non-traded sector to the export sector.
The second key economic change is the gradual transition from a fixed exchange rate under the Bretton Woods System, via a crawling peg, to a floating exchange rate in December 1983. With a floating exchange rate and a rising trade share, monetary policy acts increasingly through the external sector, by altering the nominal exchange rate and thereby influencing the domestic prices of traded goods. With a floating exchange rate, Australia should also gain independent control of its domestic inflation rate; a proposition supported by experience in the decade since the float. As we shall discuss, floating the exchange rate also significantly changes the response of the macroeconomy to one of Australia's most important external shocks, namely, terms of trade shocks.
The final key change is deregulation and technological advance in financial markets. Together, these changes have allowed Australians and foreigners to exchange claims to both real and financial assets with very low transaction costs. With open capital markets and low transaction costs, arbitrage and the flow of information between Australian and foreign asset markets is now rapid and continuous. Shocks to world asset markets (like the stockmarket crash in October, 1987 and the rise in long bond yields in 1994) now translate rapidly to Australian asset markets and may, as a consequence, have a relatively quick impact on the Australian macroeconomy.
In this paper, we discuss the impact of these three key aspects of internationalisation on both inflation and the domestic business cycle. The effects of internationalisation on unemployment and the labour market, however, are not discussed since this topic is dealt with by Fahrer and Pease in this Volume.
Our paper is organised as follows. In Section 2, we describe an ‘Australian macro-model’ which provides a simple and convenient framework for thinking about the Australian macroeconomy with a floating exchange rate and deregulated financial markets. Section 3 discusses the implications of internationalisation for domestic inflation. It begins with a brief discussion of the range of ways in which internationalisation may affect the incentives facing public policy makers as well as the behaviour of price and wage setters in the Australian economy.
As mentioned above, the behaviour of the exchange rate becomes an increasingly important influence on domestic prices as the trade share rises. Further, as has been widely recognised, the predominant medium-term influence on the Australian exchange rate is the terms of trade. These two observations provide the motivation for the rest of Section 3 which examines the changing inflationary impact of terms of trade shocks. Two key issues are examined: how the impact changes with a floating exchange rate compared with a fixed exchange rate and how, with a floating exchange rate, the impact changes as the economy's trade share rises.
Section 4 turns to the implications of internationalisation for the domestic business cycle. This section's main contribution is to estimate a series of models of Australian output growth with the aim of elucidating the important channels by which foreign influences are transmitted to domestic real activity. Finally, Section 5 draws policy conclusions and summarises the paper.
2. An Australian Macro-Model
Paul Krugman argues that most economists on the United States policy circuit carry around in their heads some variant of a generic macro-model of the international economy (Krugman 1991, 1993). Krugman calls this generic model either the ‘Massachusetts Avenue’ model (since its main contemporary adherents in the United States work on or near a Massachusetts Avenue in either Cambridge, Massachusetts or Washington, DC) or the modified-Mundell-Fleming model (which describes its pedigree).
In this section, we outline a variant of this generic macro-model that is relevant for Australia, especially in the decade since the float of the dollar and the deregulation of the Australian financial system.
The model can be expressed in a few key relationships. (An algebraic summary is provided in Appendix A.) The first relationship embodies the Keynesian idea that output is demand determined in the short run. Demand for domestic goods is the sum of domestic demand and net exports. In Krugman's generic model, domestic demand depends on both real income and the real interest rate, while net exports depend on domestic income, foreign income and the real exchange rate. Given the importance of the terms of trade for the Australian economy, both domestic demand and net exports also depend on the terms of trade in the Australian macro-model.
The second relationship determines the domestic short-term nominal interest rate. Traditionally, the nominal interest rate is determined by equilibrium in the money market (the LM curve) and Krugman follows this tradition. Largely as a consequence of financial deregulation, however, the world-wide experience since the early 1980s has been that such equations are unstable. Therefore, rather than modelling equilibrium in the money market, it is more straightforward to recognise that the short-term nominal interest rate is set by the central bank. The Australian macro-model makes this assumption.
The third element in the model is an exchange rate equation. It is derived assuming that investors equalise expected returns on domestic and foreign interest-bearing assets. To do so, investors assume that the real exchange rate gradually adjusts towards its long-run equilibrium level.
The fourth element of the model is the assumption that the long-run equilibrium real exchange rate depends on the terms of trade. This assumption is motivated both by the importance of terms of trade shocks to Australia and by their strong relationship with the Australian real exchange rate (Gruen and Wilkinson 1991; Blundell-Wignall, Fahrer and Heath 1993). In some formulations, the equilibrium real exchange rate also depends on the level of net external assets (or liabilities) of the domestic economy, but we abstract from this complication.
To complete the model, we need a description of the evolution of domestic consumer prices. At any point in time, the consumer price level is pre-determined. The rate of inflation is determined by the combination of an expectations-augmented Phillips curve and by the rate of change of the domestic price of imports. Expected or core inflation in the Phillips curve relationship is adaptive, adjusting slowly in response to actual inflation.[1]
To summarise, the Australian macro-model differs from the framework discussed by Krugman in three distinct ways. First, the Australian model explicitly includes the effect of the terms of trade as a determinant of domestic demand, net exports and the equilibrium real exchange rate. Second, rather than modelling equilibrium in the domestic money market, the short-term nominal interest rate is assumed to be set by the central bank. Finally, in the determination of domestic consumer price inflation, the Australian model allows for the influence of changes in the real exchange rate on the domestic price of imports.
In common with all variants of the original Mundell-Fleming model, the Australian macro-model is a short-run model. Thus, it provides useful insights into the effects of shocks over the business cycle while being of limited use for examining longer-term issues. In the next section of the paper, we use it to examine the inflationary impact of terms of trade shocks.
3. Internationalisation and Inflation
The process of internationalisation fundamentally alters the price-setting strategies of domestic economic agents. This is true for agents operating in product markets, factor markets and financial markets. At a micro level, internationalisation directly alters pricing behaviour by deepening product and factor markets. More potential buyers and sellers implies greater competition and a reduction in excess returns. At a macro level, internationalisation also has the potential to change the incentives faced by public policy makers.
Looking first at the consequences for public policy, Grattan (1994) and Macfarlane (1994), amongst others, argue that public policy is now constrained by the reactions of financial markets. By inducing big changes in financial asset prices, financial markets can now signal concern about the direction of public policy. The desire to avoid a backlash in financial markets then becomes a consideration in policy decisions. This developing power of financial markets to dictate the limits of ‘reasonable’ policy may even constrain Australia's ability to maintain an inflation rate different to its trading partners: an ironic implication of the move to a floating exchange rate.[2]
Two additional factors suggest that internationalisation may reduce the incentive to pursue short-run output gains through expansionary monetary policy. First, expansionary monetary policy operates by increasing demand. As imports become a larger share of the economy, more of the increased demand spills overseas, reducing the domestic benefits of expansion. Second, the flexibility of a floating exchange rate translates into increased flexibility of domestic prices in sectors that compete on world markets. As the trade share rises, this price flexibility applies to a rising share of the domestic economy. Since the output effect of monetary policy arises from the sluggish adjustment of goods prices, the output-payoff from expansionary monetary policy is again reduced when the economy is more open. Therefore, actual inflation in open economies should be lower than in more insulated economies (Rogoff 1985). While this argument seems theoretically appealing, evidence for this consequence of internationalisation is hard to find, at least for industrial countries. Romer (1991) finds a strong and significant negative relationship between openness and inflation, but the relationship does not hold for OECD countries, casting doubt on its relevance for Australia.
While clearly having the potential to influence public policy, internationalisation also has direct consequences for the pricing strategies of private agents. We now explore these consequences, dealing first with the view of imports as a market discipline. Helpman and Krugman (1989) refer to this hypothesis as the oldest insight in trade policy with imperfect competition. International trade, by raising the level of competition, reduces the ability of domestic producers to extract surplus rents. The move towards marginal-cost pricing should directly reduce domestic price levels. The impact on inflation then depends upon how drawn out and how complete is the transition to a competitive market. In a study of the ‘imports as a market discipline’ hypothesis, Levinsohn (1993) uses data on Turkish manufacturing plants to demonstrate that the ratio of price to marginal cost declines in imperfectly competitive industries undergoing trade liberalisation.
In the Australian context, evidence is anecdotal. Interviews with manufacturing exporters conducted in 1994 reveal that the annual tariff reductions in the automobile industry are explicitly taken into account in contracts written with domestic component suppliers through what is known as a ‘cost-down’ policy (personal communication, Gordon Menzies who conducted the survey). Thus, competition at the final product level can flow through to factor suppliers. Pressure can also be applied in factor markets by producers, like multinational corporations, who conduct similar operations in a variety of countries. For example, Heinz operates similar plants in Australia and New Zealand to service their expanding Pacific Rim markets. After an agreement reached with unions, their chief executive commented about their Australian plant:
We are in Dandenong to stay, provided Dandenong is efficient and competitive.
Dr O'Reilly (Australian Financial Review, 11 October 1993, p. 22, italics added)
Such considerations may be partly responsible for the willingness of the union movement to accept real wage cuts through the 1980s. Unions' recent commitment to keeping price inflation comparable with Australia's trading partners is also an example of the increased relevance of the world economy in domestic wage-setting behaviour (ACTU 1987, pp. 46–47). With external constraints perceived both by labour and by the suppliers of other inputs, there should be less potential for supply-side inflationary pressure than in a closed economy. Similarly, capacity constraints pose less of an inflationary threat when international substitutes are available.
Increased competition has wider ramifications than a loss of market power for domestic producers. Much of the motivation for turning Australia's focus to global markets is the promise of accelerated economic growth over an extended period, if not in the long run (see papers by Dowrick and by Ergas and Wright in this Volume). If this eventuates, we may observe the reverse of some of the influences which contributed to the rise in global inflation in the early 1970s. World-wide inflationary problems arose then at the same time as a widespread slowdown in productivity growth. At least partly, when workers demanded the wage increases to which they had become accustomed in the 1960s, it fed inflationary pressures because productivity growth did not underpin their claims. In the 1990s, if productivity growth accelerates, wage claims are more likely to be underpinned by real increases in the value of labour. Such an outcome would clearly reduce supply side inflationary pressures.
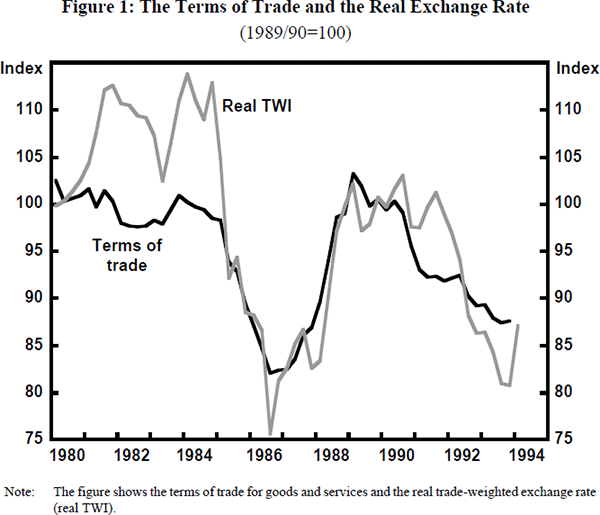
As well as putting downward pressure on prices by squeezing margins, internationalisation also makes more of the prices in the economy sensitive to movements in the exchange rate. As Figure 1 shows, medium-term movements in the Australian real exchange rate are driven largely by the terms of trade. Indeed, a strong rationale for floating the Australian dollar was that it would insulate the domestic economy, to some extent, from terms of trade shocks. In the following sub-sections therefore, we analyse the transmission mechanisms from the terms of trade to domestic prices (and income) and estimate how these relationships change as the trade share rises.
3.1 The Terms of Trade
Among industrialised countries, Australia has a fairly low share of exports and imports to national income. Indeed, by these measures, every country in Western Europe is more open to trade than Australia. Australia is also unusual in another important respect. By contrast with most industrial countries, the mix of Australian exports is very different from the mix of its imports. As Figure 2 shows, a high proportion of Australia's exports are commodities (both rural and mineral) while Australian imports are almost exclusively manufactures and services.
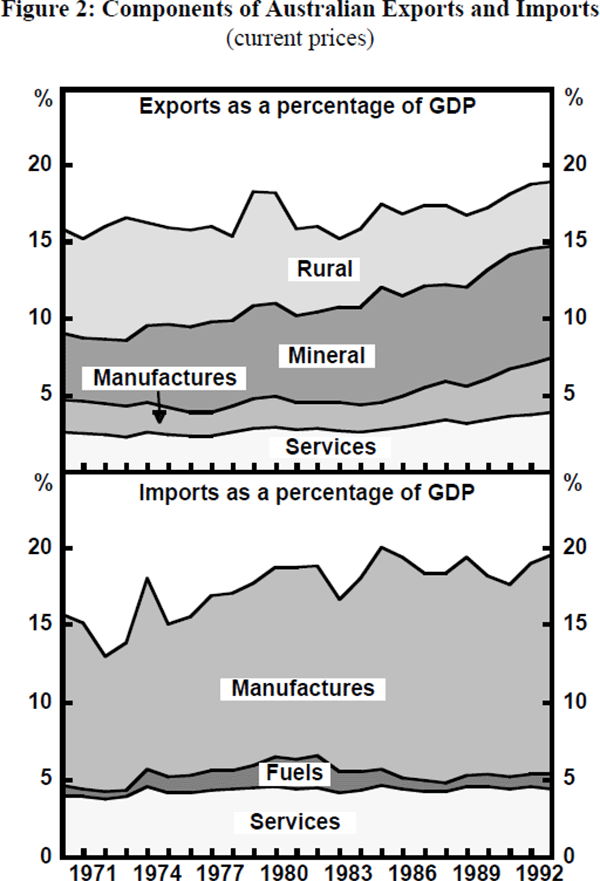
Figure 3 shows the US dollar prices of a broad basket of manufactures and of Australia's mineral and rural commodities. The difference in their volatility is striking. Given Australia's exports of commodities and imports of manufactures and services, one should expect the Australian terms of trade (the ratio of export prices to import prices) to be more volatile than the terms of trade of those industrial countries that export and import similar types of goods.
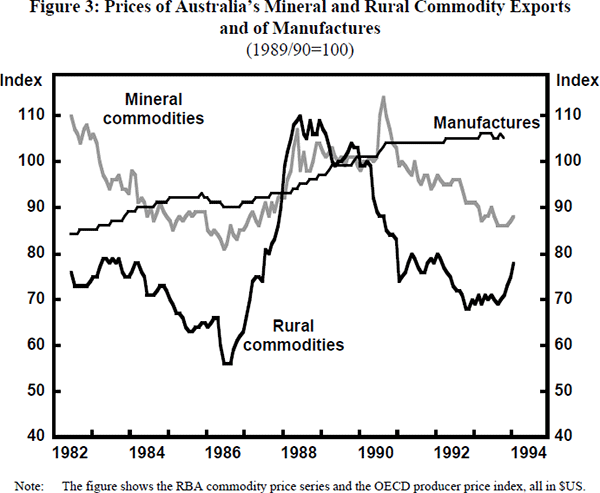
Figure 4 confirms this expectation. It shows an international comparison of terms of trade changes for sixteen industrial countries and five less-developed countries. Among the industrial countries, Australia has relatively big terms of trade changes. The few industrial countries with more volatile terms of trade than Australia are either commodity exporters (like New Zealand) or countries with a high share of oil exports (like Norway) or oil imports (like Japan). Four of the five less-developed countries in Figure 4 (Colombia, Philippines, Pakistan and South Korea) also have more volatile terms of trade than Australia. All but South Korea export a high proportion of commodities. In general, their exports are also relatively undiversified which contributes to their terms of trade volatility.
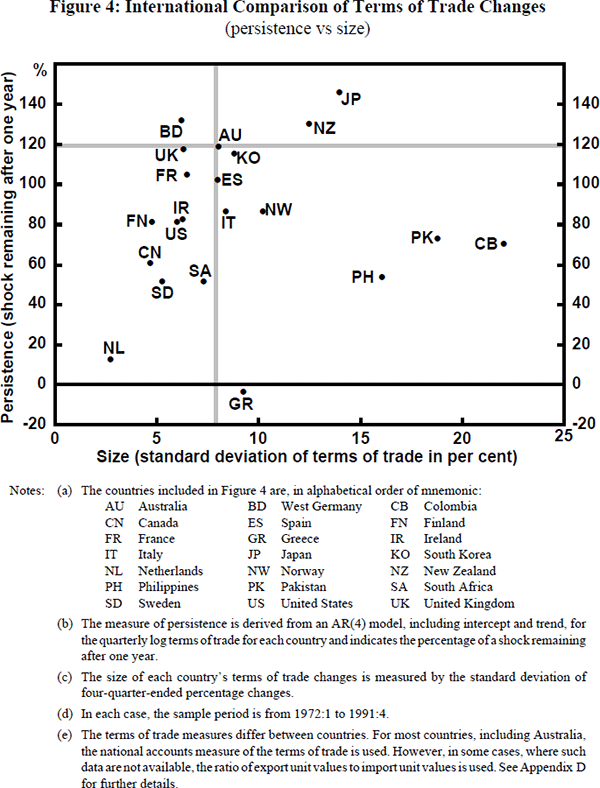
Figure 4 also shows that Australia has relatively persistent terms of trade shocks, with an estimated 120 per cent of a shock remaining after one year (that is, the shock grows in magnitude for the first year.) A more refined model of the Australian terms of trade suggests that, although relatively persistent, shocks do not appear to have a permanent effect. About 85 per cent of a shock remains after two years, but the effect falls rapidly in the third year (see Appendix C).
From the perspective of macroeconomic management, both the persistence and the size of terms of trade changes are important. For given persistence, larger changes clearly have a greater influence on the domestic economy. However, if changes of a given size are known to be short-lived, they induce consumption smoothing on the part of individuals and provide little incentive for resource reallocation in the economy. By contrast, more persistent changes induce larger responses in both consumption and production patterns. These considerations, combined with the evidence in Figure 4, explain why terms of trade movements are of considerable concern to Australian policy makers but of less relevance to policy makers in many other industrialised countries.
Given the importance of terms of trade shocks, we turn to a detailed analysis of their impact on domestic inflation and, in particular, on how this impact changes as the economy integrates with the rest of the world. There are two interesting questions here:
- How does the impact of a given terms of trade shock change as the economy becomes more open?
- What are the implications of the changing mix of Australia's exports on the average size of terms of trade shocks and hence on their average impact on the Australian economy?
We address these questions in turn in the following two sub-sections.
3.2 The Inflationary Impact of a Given Terms of Trade Shock
We have had a surge of income which is drifting into expenditure. I mean, basically, the glass is too full and the effervescence is spilling over the sides. … Too much of a good thing can still be too much of a good thing.
Paul Keating, in the aftermath of a favourable terms of trade shock (quoted in Australian Financial Review, 17 February 1989, p. 1).
Figure 5 shows domestic inflation around the time of three large shocks to the Australian terms of trade. The largest shock occurred in the early 1950s when the Korean War temporarily drove up the price of wool by 250 per cent (panel I). With a fixed nominal exchange rate, the accompanying surge in income and money balances translated quickly into record inflation. When wool prices and the terms of trade subsequently collapsed, there was a corresponding fall in the rate of inflation.
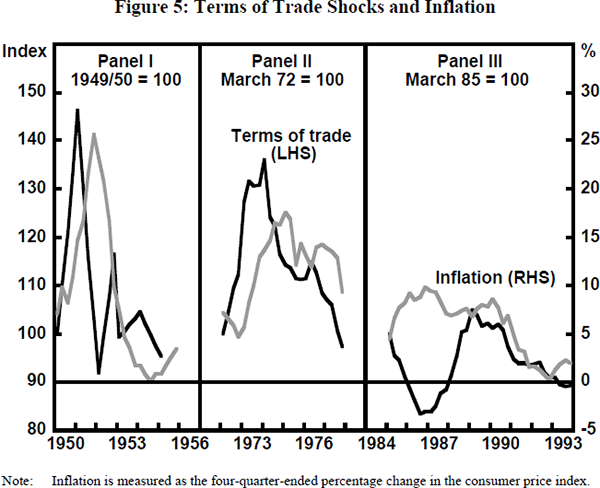
A similar relationship between the terms of trade and inflation occurred during the 1970s, although the magnitude of the changes was less than in the 1950s (panel II). This time, the terms of trade rise was driven by a broadly-based commodity price boom including a quadrupling of the US dollar oil price. Again, with a fixed nominal exchange rate, the resultant increase in income and money balances fed into domestic inflation and as the terms of trade fell, so did domestic inflation.[3]
These two experiences established a piece of conventional wisdom, namely, that the Australian terms of trade and domestic inflation are strongly positively correlated, with rising terms of trade leading to a surge in inflation. However, with the floating of the exchange rate in December 1983, this conventional relationship appeared to break down.
In the mid 1980s, the terms of trade fell sharply but, for the first time, the fall was not deflationary. Instead, the currency depreciated rapidly (see Figure 1), increasing the domestic price of imports and leading to an acceleration of domestic inflation (panel III of Figure 5). This negative correlation between the terms of trade and inflation clearly distinguishes this episode from the earlier ones.
Most recently, the terms of trade and inflation have again moved in line with each other, with both series falling. This suggests that the mid 1980s may have been an aberration with speculative market dynamics causing the exchange rate to fall by more than was justified by fundamentals. However, despite a return to the historical norm, it is premature to conclude that, as a general rule, a fall in the terms of trade is deflationary. As ever, it is difficult to disentangle the influence of the terms of trade on inflation from the effect of the business cycle and domestic policy settings. Thus the question remains: with a floating exchange rate, what is the impact of terms of trade changes on inflation?
This section addresses this question by analysing the changing inflationary impact of a once-off 10 per cent rise in the terms of trade as the Australian economy becomes more open. For the sake of exposition, we defer until later the issue of when this rise is unwound. (Recall our evidence, reported in Appendix C, that terms of trade shocks are persistent but not permanent.) It should also be noted, in passing, that all the analysis in this section applies, with signs reversed, to a 10 per cent terms of trade fall.
Throughout, we assume that the exchange rate floats and that short-term real interest rates are kept constant. Thus, we make no allowance for policy reaction to the terms of trade shock. Rather, the aim is to discover the ‘impact effect’ of the terms of trade shock on the domestic inflation rate.
The 10 per cent terms of trade rise has two effects on the economy that are relevant to the domestic inflation outcome. First, there is a demand effect on the prices of non-traded goods. The terms of trade rise increases Australian real income and hence domestic demand. This extra demand falls, at least partly, on non-traded goods, driving up their prices. The terms of trade rise is also associated with a real exchange rate appreciation (see Figure 1) which lowers the price of imports relative to non-traded goods. This lower relative price of imports induces substitution towards imports and so reduces the magnitude of the demand effect on the prices of non-traded goods.
The second effect is a direct price effect. The real exchange rate appreciation makes imports cheaper. Since imports form part of the domestic consumption basket, cheaper imports imply a lower average price for the whole consumption basket. Clearly, the demand effect acts to increase domestic inflation while the direct price effect acts to reduce it.[4]
We use the Australian macro-model to quantify these two effects as the degree of openness of the economy changes (see Appendix B for technical details). To do so, we need to calibrate the model with estimates of the effect of the terms of trade rise on domestic demand and national income. Over the period 1980–93, when the trade share (defined as the mean of the import and export shares) averaged 18 per cent of GDP, our estimate (standard error) is that a 10 per cent terms of trade rise led to a rise in domestic demand of 2.3 (1.1) per cent-years, cumulated over two years. The corresponding figure for the rise in national income is 0.03 (0.95) per cent-years (see Appendix C for further details).[5]
We now estimate the effect both on demand in the economy and on inflation of the 10 per cent terms of trade rise. Figure 6 shows the estimated effects on domestic demand and non-traded demand as a function of the economy's trade share. The effect on domestic demand is a straight line from the origin, reflecting the fact that, as the trade share rises, the terms of trade rise applies to a progressively larger proportion of the economy.[6]
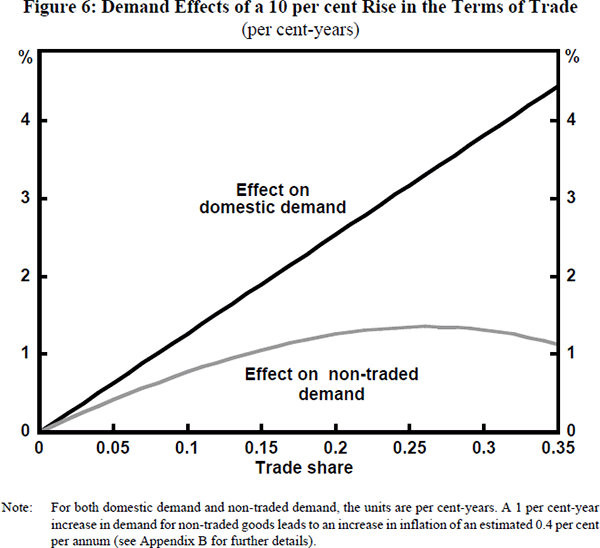
The effect on non-traded demand, shown in Figure 6, is more interesting but requires some explanation. Recall that domestic demand is satisfied by non-traded and imported goods. That is, we assume that domestic demand for exportables is small enough to be ignored. Now, for the sake of the argument, assume counterfactually that the income elasticity of demand for imports is unity and that the terms of trade rise induces no change in the relative price of imports to non-traded goods. In that case, the percentage rise in demand for non-traded goods would be the same as the percentage rise in domestic demand and the two lines in Figure 6 would lie on top of each other.
The actual change in demand for non-traded goods, shown in Figure 6, differs from the change in domestic demand for two reasons. First, the income elasticity of demand for imports is estimated to be higher than unity. Second, the real appreciation caused by the rise in the terms of trade substantially reduces the relative price of imports, further increasing demand for them. (See Appendix B for the income and price elasticities used for the results in Figure 6.) Since domestic demand is satisfied by either imports or non-traded goods, a disproportionate rise in import demand implies that the proportional rise in demand for non-traded goods is less than the rise in domestic demand.
These effects become more important as the trade share rises. To see why, consider a given rise in domestic demand. If the import share is small, even a disproportionate rise in import demand satisfies only a small part of this extra demand. Most of the extra demand must still be satisfied by domestic non-traded goods. With a larger import share, however, a disproportionate rise in import demand can satisfy much more of the rise in domestic demand. As Figure 6 shows, the induced rise in demand for non-traded goods does not continue to increase as the trade share rises.
We now turn to the overall impact of the 10 per cent terms of trade rise on domestic consumer price inflation, including both the demand effect on the prices of non-traded goods and the direct price effect of cheaper imports. Figure 7 shows the results of two sets of calculations, a standard model (which we have discussed thus far) and an alternative model.[7] The alternative model involves these three plausible refinements to the standard model:
- the import share of consumption is assumed to be less than (and to rise more slowly than) the trade share;
- domestically-produced import substitutes, whose prices are influenced by the domestic price of imports, are introduced; and
- second stage pass-through of shocks from over-the-dock import prices to prices faced by consumers are allowed to be incomplete.[8]
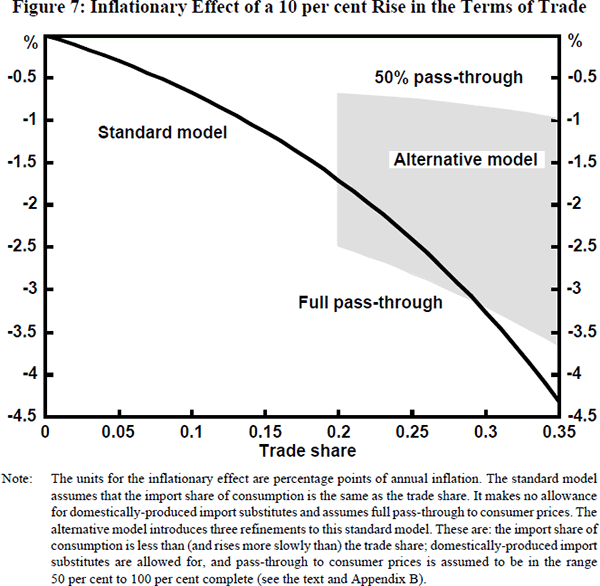
As Figure 7 makes clear, using either model, the terms of trade rise reduces domestic inflation. This counter-intuitive result occurs because the associated exchange rate appreciation is so big. The 10 per cent terms of trade rise is associated with an estimated real appreciation of nearly 9 per cent (see Appendix B). As a consequence, the disinflationary effect of cheaper importables overwhelms the inflationary effect of higher demand for non-traded goods.
Further, using either model, the magnitude of the disinflationary effect rises as the trade share rises. In both models, this occurs, predominantly, because cheaper importables make up a rising share of consumption as the trade share rises. Not surprisingly, the effect on inflation of the terms of trade rise is less sensitive to the trade share in the alternative model because the share of importables in consumption in this model is assumed to rise more slowly than the trade share. Nevertheless, it remains true that internationalisation tends to magnify the impact on domestic inflation of a given percentage change in the terms of trade.
We conclude this sub-section with three final points.
- First stage pass-through from exchange rate changes to over-the-docks import prices is rapid and virtually complete (Dwyer, Kent and Pease 1993). By contrast, although apparently complete in the long run, second stage pass-through to consumer prices appears to be only about a third (half) complete within one (two) years (de Brouwer et al. 1994). This slow pass-through to consumer prices implies that the disinflationary effect of a terms of trade rise only becomes apparent gradually.
- Since terms of trade shocks are not permanent, all shocks are eventually unwound (after about two or three years on average – see Appendix C). Combined with the last point, this suggests that estimates that assume partial second stage pass-through may be the more relevant ones.
- The share of importables in consumption (including indirect effects via intermediate inputs) may be much larger than assumed in the alternative model (the results of de Brouwer et al. (1994) imply a current share of 0.49 rather than 0.26). If so, this implies a bigger disinflationary effect than shown by the alternative model.
Although these three points further complicate accurate estimation of the inflationary effect of a terms of trade rise, they do not change the direction of the relationship. To summarise, floating the exchange rate profoundly altered the impact of terms of trade changes on domestic inflation. Before the float, a terms of trade rise translated rapidly into a surge in domestic inflation. By contrast, with a floating exchange rate, it takes some time for a terms of trade shock to have a noticeable impact on domestic inflation. After two years, however, terms of trade rises (falls) appear to have a favourable (adverse) impact on domestic inflation. Finally, these effects will probably become more pronounced as the Australian economy continues to internationalise.
3.3 The Effect of the Changing Mix of Australian Exports
We have previously noted the unbalanced composition of Australia's trade with exports dominated by commodities and imports dominated by manufactures and services (see Figure 2). As the Australian economy continues to internationalise, we should expect the composition of exports to change. We now address the implications of this changing mix of exports for the average size of terms of trade shocks and hence for their average impact on domestic inflation.
Given the volatility of commodity prices, the key to predicting how Australian terms of trade volatility will change as the economy continues to open, is to capture expected changes both in the composition of Australia's commodity exports and in commodities' share of total exports. We presume that other compositional changes (e.g., between manufactures and services) have much less impact on terms of trade volatility and we therefore ignore them.
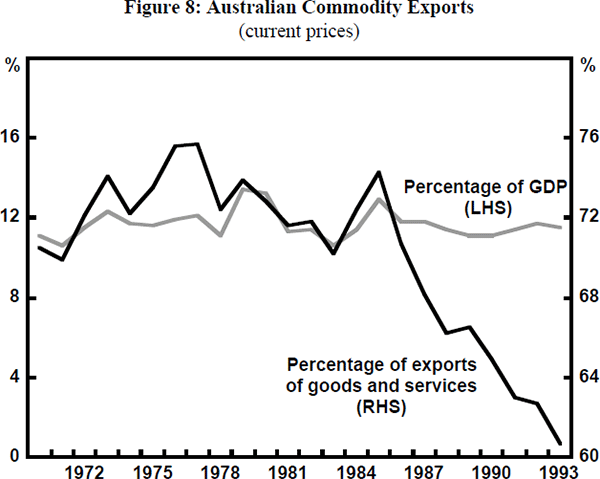
For our purposes, there have been two important trends in commodity exports. First, the share of rural commodity exports has been falling as the overall trade share has risen (see Figure 2). From 1975 to 1980 the trade share averaged 16.7 per cent and rural exports averaged 52.8 per cent of total commodity exports. By 1993, when the trade share had risen to 19.2 per cent, rural exports had fallen to 36.8 per cent of commodity exports. Second, total commodity exports have been a falling share of total exports, although their share of GDP has been almost constant for over twenty years (see Figure 8).
With these two trends in mind, we assume the following:
- Australia exports three types of goods (rural commodities, mineral commodities, and manufactures) but imports only manufactures.[9]
- Measured in a common currency, the prices of exported and imported manufactures are identical.
- As the trade share rises, Australia's commodity exports remain a constant share of GDP (which implies, of course, that the rising export share occurs because of rising exports of manufactures).
- As the trade share rises, there is a continuing trend fall in the rural share of commodity exports.
Given these assumptions, Figure 9 shows the estimated volatility of the Australian terms of trade as the trade share rises from the current value of about 0.2.[10] Terms of trade volatility is predicted to fall substantially as the trade share rises. There are two reasons for this fall. First, there is a falling share of commodities in total exports. Since, by assumption, commodities are the source of the volatility, the falling commodity share reduces the estimated volatility of the terms of trade. Second, for commodities relevant to Australia, mineral commodity prices are about 40 per cent less volatile than rural commodity prices. With mineral exports rising as a proportion of total commodity exports, this volatility differential leads to further reductions in the estimated volatility of the terms of trade.
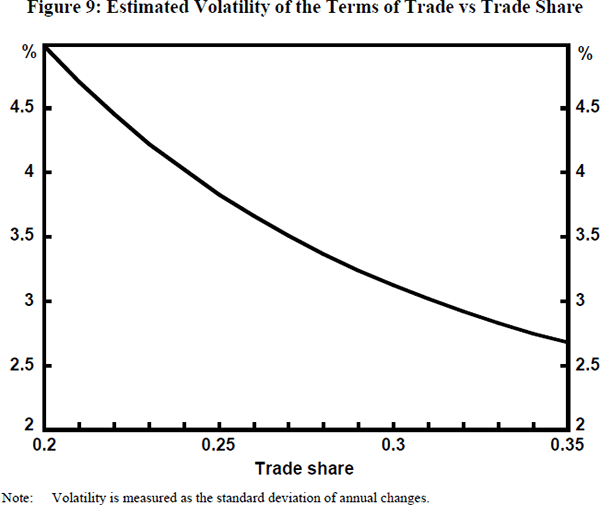
The combined effect of these two influences is substantial. At the current trade share (β ≈ 0.2), the estimated standard deviation of annual terms of trade changes is 5.0 per cent (see Figure 9). When the trade share rises to β = 0.30, this standard deviation is estimated to fall to 3.1 per cent; that is, a fall in volatility of almost 40 per cent.[11]
We now link these results with those of the last section. In that section, we showed that terms of trade shocks of a given size have an increasing impact on inflation as the trade share rises – with rising terms of trade reducing inflation and falling terms of trade exacerbating it. Here we have shown that terms of trade shocks are smaller on average as the trade share rises. These two results raise an interesting question. As the economy opens up, what is the inflationary effect of an ‘average’ terms of trade shock, taking into account the fact that this average shock should get smaller as the trade share rises?
Figures 10 and 11 answer this question, using the standard and the alternative models respectively. Both figures show the effect on non-traded demand (as in Figure 6) and the overall effect on inflation of a two-standard-deviation rise in the terms of trade (where, for given trade share, the standard deviation is given in Figure 9).
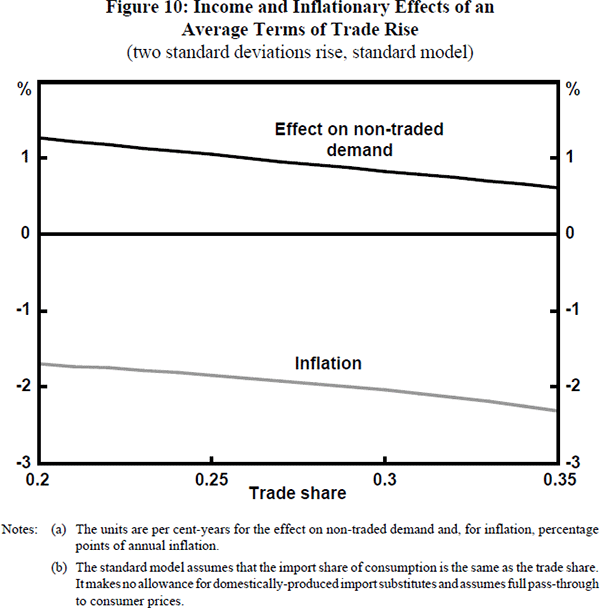
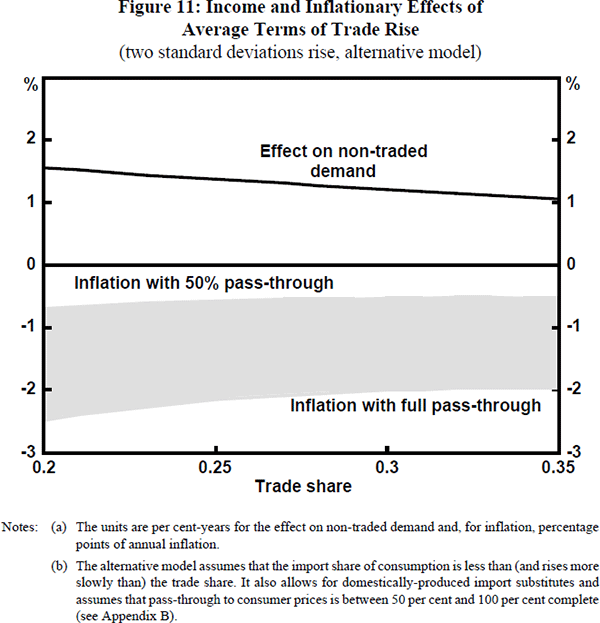
Allowing for the changing composition of Australian exports, the impact on domestic inflation of an ‘average’ terms of trade shock either becomes gradually more pronounced (from the standard model results in Figure 10) or remains roughly unchanged (from the alternative model results in Figure 11) as the trade share rises. It remains true, however, that an average terms of trade rise always has a favourable impact on inflation, while an average terms of trade fall exacerbates it. As before, this occurs because of the large exchange rate change associated with the terms of trade shock. Again, because of slow pass-through to consumer prices, these effects only become apparent with a substantial lag.
4. International Influences on the Australian Business Cycle
This section explores international influences on the domestic business cycle. It begins by examining the correlation between Australian output growth and various measures of foreign growth over the past thirty years and by analysing the extent to which the Australian terms of trade can be explained by measures of foreign activity. The section's main contribution, however, is to estimate a series of models of Australian output growth with the aim of elucidating the important channels by which foreign influences are transmitted to domestic real activity. One of our tentative conclusions is that trade and information flows between foreign and Australian asset markets may be one of the important ways in which foreign shocks are now transmitted to the domestic business cycle. Given this tentative conclusion, we complete the section with an examination of the correlations between Australian and foreign bond, stock and property markets.
Casual observation suggests that the influence of the world economy on the Australian business cycle has long been a profound one. Thus, for example, in recent history, the Australian economy suffered recessions in the mid 1970s, the early 1980s and the early 1990s. On each occasion, the world economy was also in recession.
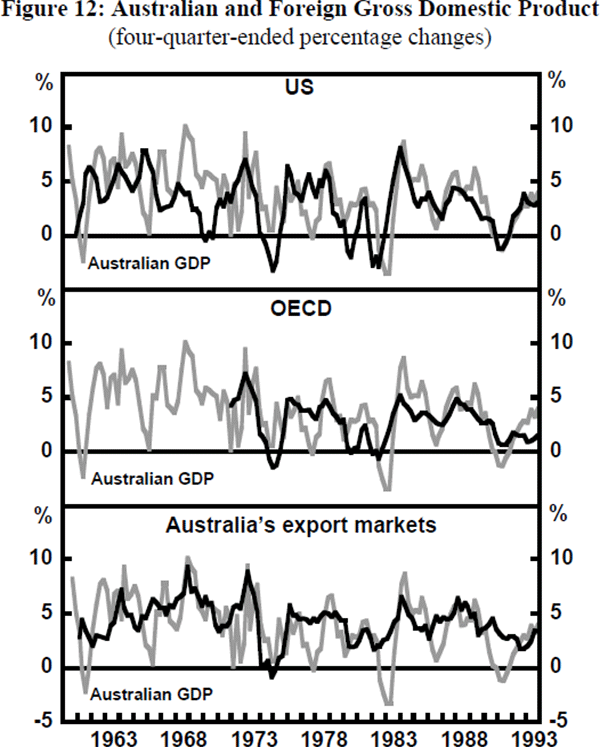
While there are several possible measures of world activity that could be used to examine foreign influences on the Australian business cycle, we concentrate on three measures. The first of these is the output of the US economy, partly because, as the world's largest economy, US output is often used as a proxy for world activity, but also because the Australian and US business cycles have been particularly well correlated recently. The second measure is OECD output since this provides a reasonably broad measure of world output. The third and final measure is the output of Australia's export markets.[12] Analysis of this final measure of world output should help determine whether changing demand for Australian exports is a major foreign influence on the domestic business cycle.
Figure 12 shows Australian GDP growth compared with the growth of these three measures of foreign output over the past thirty years. There are clear correlations between Australian and foreign output growth, and these correlations are apparent whichever measure of foreign output is used. All three measures of foreign output show a slowdown in growth, or a brief period of negative growth, in the mid 1970s, the early 1980s and the early 1990s and, at each of these times, the Australian economy was in recession. Furthermore, the strongest four quarters of growth in the past twenty years, both for Australia and for each of the measures of foreign output, occurred in 1983/84. It is also clear from Figure 12 that the Australian and US business cycles have been particularly closely synchronised over the past five years.
In the polar case of a closed economy with no links whatsoever with the rest of the world, there is no reason for its business cycle to be influenced by, or correlated with, the world business cycle. At the other extreme, an economy with strong trade and financial links with the world should presumably have a business cycle that is strongly correlated with the world cycle. It follows that, during a period in which a country substantially increases its trade and financial links with the rest of the world, we should expect a rising correlation between the domestic and foreign business cycles.
Figure 13 examines empirical evidence for Australia over the past thirty years. It shows the changing correlation between Australian growth and seven measures of foreign growth (the three measures already introduced, as well as industrial production in the OECD and in Australia's export markets and, finally, output growth in the UK and Canada). For each date, the figure plots the correlation between Australian and foreign four-quarter-ended growth over the previous five years. Thus, for example, the number plotted for the United States at 1993:4 is the correlation coefficient between Australian and US four-quarter-ended growth from 1989:1 to 1993:4.
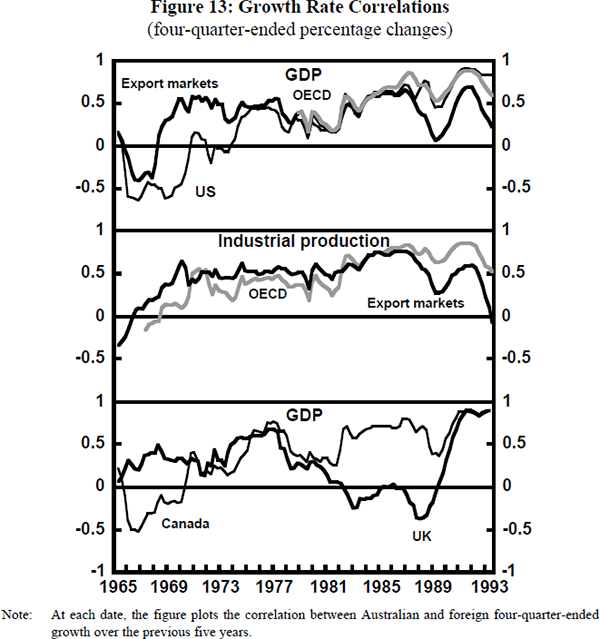
The general pattern to emerge from Figure 13 confirms the argument presented above. The past thirty years have been characterised by increasing trade and financial integration between Australia and the world, and there has been a rising correlation over time between Australian and foreign growth. For every foreign growth measure, with the exception of the UK, the correlation with Australian growth is stronger in the second half of the sample than in the first half and, in many cases, there is a trend rise in correlation throughout the sample.
The exception of the UK is revealing. The share of Australian exports going to the UK fell from 27 per cent in 1960 to just 4 per cent in 1979, and stabilised at around this level thereafter. This may help explain the quite strong correlation between Australian and UK growth before 1980 and the much weaker correlation in the 1980s. The trend fall in the share of Australian exports to the UK clearly cannot explain why the Australian and UK business cycles have again become highly correlated in the late 1980s and early 1990s.
Of course, this recent high correlation between the business cycles in Australia and the UK (as well as those in Canada and the US) may be a coincidence. Alternatively, it may suggest that there are links other than trade links between Australia and the rest of the world that are of increasing importance for the Australian business cycle. We will return to this idea at the end of this section. However, we now turn to a discussion of the well-known correlation between the Australian terms of trade and measures of foreign activity. Figure 14 shows the four-quarter-ended percentage change in the terms of trade and four measures of foreign activity.
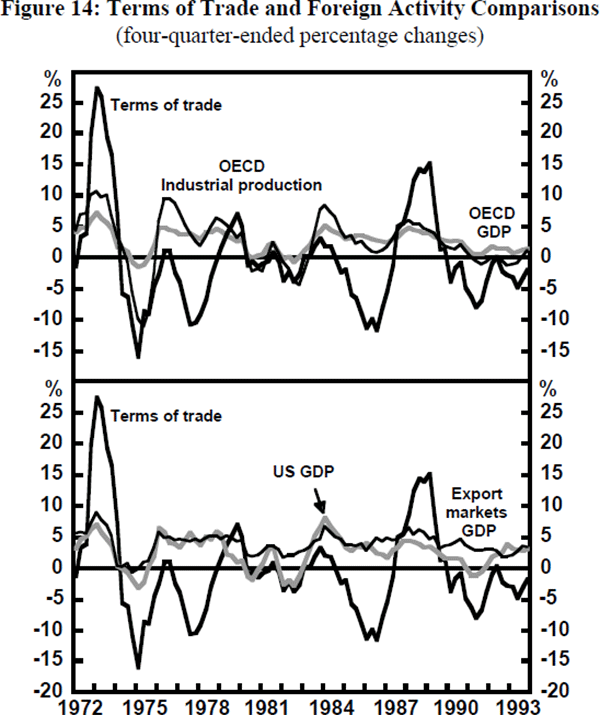
For each measure of foreign activity, there appears to be a positive correlation between changes in foreign activity and changes in the Australian terms of trade. Figure 14 also makes clear, however, that this correlation is relatively weak. Thus, for example, the big fall in the terms of trade in 1986 occurred when foreign activity was not particularly weak. (OECD industrial production was weak, but still much stronger than in the early 1980s or early 1990s.)
To explore the relationship more fully, a model relating Australia's terms of trade to foreign economic activity is estimated. The model allows both for a secular trend decline in the terms of trade (probably arising from a trend decline in commodity prices relative to the prices of manufactures) and for the tendency of the terms of trade to return to this trend after a shock. Contemporaneous and lagged growth in foreign activity, Δwt – j, are also included in the model (see Appendix C for further details). However, as pointed out by Barry Hughes in his comments on the paper, supply-side influences on the terms of trade are ignored. The model is estimated with quarterly data and takes the form:

For each measure of foreign activity, Table 1 shows two types of information. First,
it shows the extent to which the variation in the terms of trade is explained
by the estimated equations (measured by the  ). In all cases, including
the foreign activity variables generates little improvement in explanatory
power compared to the base case. Thus, for example, adding OECD industrial
production to the base case model over the period
1980:1 to 1993:4 increases the by only 0.05. Second,
Table 1 also shows in which models foreign activity makes a statistically significant
contribution to explaining the change in the terms of trade (measured by the
p-value relating to the joint significance of the foreign activity terms).
As the table shows, this only occurs for models estimated over the more recent
sample period. Thus, while measures of foreign activity do help to explain
the behaviour of the Australian terms of trade, much of the terms of trade
movement is not simply a response to the world business cycle, an observation
we will return to shortly.
). In all cases, including
the foreign activity variables generates little improvement in explanatory
power compared to the base case. Thus, for example, adding OECD industrial
production to the base case model over the period
1980:1 to 1993:4 increases the by only 0.05. Second,
Table 1 also shows in which models foreign activity makes a statistically significant
contribution to explaining the change in the terms of trade (measured by the
p-value relating to the joint significance of the foreign activity terms).
As the table shows, this only occurs for models estimated over the more recent
sample period. Thus, while measures of foreign activity do help to explain
the behaviour of the Australian terms of trade, much of the terms of trade
movement is not simply a response to the world business cycle, an observation
we will return to shortly.
| Foreign activity measure | 1980:1 to 1993:4 | 1972:1 to 1993:4 | ||
|---|---|---|---|---|
|
p-value | |
p-value | |
| Base case (no foreign measure) | 0.32 | 0.31 | ||
| OECD GDP | 0.32 | 0.02 | 0.34 | 0.11 |
| USA GDP | 0.36 | 0.00 | 0.34 | 0.08 |
| Export markets GDP | 0.37 | 0.00 | 0.33 | 0.30 |
| OECD industrial production | 0.37 | 0.00 | 0.30 | 0.49 |
| Export markets industrial production | 0.31 | 0.43 | 0.32 | 0.50 |
| Note: The p-values refer to the joint significance of the foreign activity terms. Thus, for example, a p-value less than 0.05 implies joint significance at the 5 per cent level. | ||||
4.1 Models of the Australian Business Cycle
We now turn to econometric models of the Australian business cycle. We are particularly interested in foreign influences on the domestic business cycle and in examining the importance of the terms of trade as a foreign shock to Australian activity. Before discussing the models, we should register a note of caution. All the estimated models are very simple. They ignore aspects of the Australian economy which, arguably, had an important influence on growth during the period under study. Fiscal policy and the effect of the centralised wage-fixing system are two aspects that come to mind. Unfortunately, it is not straightforward to include either of them in a model of growth.[13]
Despite these limitations, the estimated models yield interesting insights. The results are presented in Table 2. The estimated models are all specific versions of the general form:
| OECD | US | Export markets | ||||||
|---|---|---|---|---|---|---|---|---|
| Variable | Model: | 1 | 2 | 3 | 4 | 5 | 6 | 7 |
| Constant | 1.61** (3.70) |
−27.25** (−3.90) |
−15.42** (−2.86) |
−31.71** (−4.01) |
−17.32** (−3.24) |
15.20 (1.91) |
9.75 (1.11) |
|
| Real cash rate(b) | −0.027 {0.00} |
−0.057 {0.00} |
−0.035 {0.00} |
−0.033 {0.00} |
−0.021 {0.01} |
−0.035 {0.00} |
−0.037 {0.00} |
|
| SOI(b)(c) | 0.011 {0.04} |
0.017 {0.08} |
0.011 {0.04} |
0.010 {0.19} |
0.007 {0.05} |
0.017 {0.05} |
0.012 {0.01} |
|
| Terms of trade(b) % change |
0.030 {0.17} |
−0.060 {0.10} |
−0.069 {0.06} |
0.004 {0.82} |
||||
| Real TWI(b) % change |
−0.023 {0.07} |
0.022 {0.03} |
0.047 {0.03} |
−0.012 {0.30} |
||||
| Lagged Australian GDP log level |
−0.29** (−3.69) |
−0.20* (−2.31) |
−0.31** (−4.12) |
−0.19** (−2.58) |
−0.19* (−2.49) |
−0.14 (−1.53) |
||
| Lagged foreign GDP log level |
0.35** (3.84) |
0.24* (2.43) |
0.38** (4.21) |
0.23** (2.76) |
0.16** (2.65) |
0.12 (1.67) |
||
| Foreign GDP % change |
1.22** (5.16) |
0.84** (4.90) |
0.60** (5.22) |
0.40** (4.96) |
0.50* (2.55) |
0.55** (4.27) |
||
| R2 | 0.47 | 0.65 | 0.56 | 0.67 | 0.56 | 0.53 | 0.47 | |
|
0.09 | 0.34 | 0.46 | 0.37 | 0.47 | 0.10 | 0.35 | |
| Joint significance of terms of trade and real TWI | 85.24 {0.00} |
45.58 {0.00} |
86.68 {0.00} |
39.94 {0.00} |
||||
| Autocorrelation test AR(4) | 6.79 {0.15} |
11.80 {0.02} |
3.50 {0.48} |
15.07 {0.00} |
9.91 {0.04} |
10.34 {0.04} |
3.02 {0.55} |
|
| ARCH test ARCH(4) | 16.92 {0.00} |
18.85 {0.00} |
22.26 {0.00} |
17.32 {0.00} |
23.71 {0.00} |
17.25 {0.00} |
20.02 {0.00} |
|
| Jarque Bera test (Normality) | 0.16 {0.93} |
0.28 {0.87} |
2.44 {0.29} |
0.59 {0.74} |
3.26 {0.20} |
0.17 {0.92} |
0.46 {0.80} |
|
|
Notes: (a) Numbers in parentheses () are t-statistics. Numbers in brackets {} are
p-values. Individual coefficients marked with *(**) imply that the coefficient
is significantly different from zero at the 5%(1%) level. Standard errors
are estimated using a Newey-West correction allowing for fourth order residual
correlation. All variables in log levels and their differences are multiplied
by 100 (so growth rates are in percentages). (b) The mean coefficient is reported for the real cash rate, the Southern Oscillation Index, the terms of trade and the real TWI to summarise the coefficients on these variables. The p-values are derived from chi-squared tests of the joint significance of the lags. (c) The SOI (Southern Oscillation Index) measures the sea level barometric pressure differential between Darwin and Tahiti. If the index is positive, trade winds are stronger and rainfall in Australia is more plentiful. If the index is negative, the trade winds are weaker and less rain occurs. The quarterly figures are the average daily value of the index throughout that quarter. |
||||||||
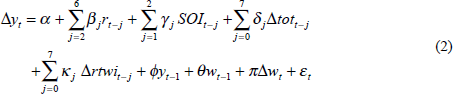
where Δyt is Australian quarterly GDP growth, rt is the real short-term interest rate, SOIt is a weather variable (see below), tott is the log terms of trade, rtwit is the log real exchange rate and yt−1 and wt−1 are the lagged log levels of Australian and foreign GDP.[14]
The first two sets of independent variables control for domestic conditions. We use lags 2 to 6 of the real short-term interest rate to control for the influence of domestic monetary policy because we have prior evidence that monetary policy acts with a lag of roughly six to eighteen months (see, for example, Lowe (1992)). In all the regressions, the mean of the real interest rate coefficients is negative, as expected, and highly significant.[15]
Further, following McTaggart and Hall (1993), we include the Southern Oscillation Index (SOI) to capture the influence of weather on agricultural production and hence on growth in the wider economy. This variable also has the expected impact on domestic growth. A positive SOI is associated with widespread rainfall over eastern Australia, and, according to the regressions in Table 2, is also associated with stronger growth in the Australian economy.[16]
The seven regressions in Table 2 model the foreign influence on the domestic business cycle in different ways. The first regression assumes that this foreign influence can be completely captured by changes in the terms of trade and the real exchange rate. This regression does, however, allow quite long lags (up to two years) in the transmission from terms of trade and real exchange rate changes to domestic growth.[17]
In this first regression, although the significance levels are low, the point estimates imply economically-meaningful relationships, i.e., that a rise in the terms of trade increases the growth rate, while an appreciation of the real exchange rate (a rise in the real TWI) reduces it.[18]
The rest of Table 2 includes, in turn, each of the three measures of foreign activity introduced in Figure 12. Thus, regressions 2 and 3 include OECD GDP, 4 and 5 include US GDP, while 6 and 7 include the GDP of Australia's export markets. In each regression, the contemporaneous foreign quarterly growth rate is included, as are lagged log levels of the Australian and foreign GDP. Including lagged log levels in the regression allows for a possible long-run (cointegrating) relationship between the log levels of Australian and foreign GDP. The table suggests that there is a long-run relationship between Australian and either OECD or US GDP. However, the evidence for a long-run relationship between Australian and export markets' GDP is much less compelling.[19]
Turning to the implications of the results in the table, we begin with a discussion of the importance of the terms of trade. Earlier in the paper, we discussed the big terms of trade rises in the early 1950s and 1970s. Given the relatively fixed nominal exchange rate at those times, these big terms of trade rises led to large rises in domestic activity and money balances, which, in turn, translated quickly into surges in domestic inflation (see Figure 5 and the associated discussion).
For the purposes of the current discussion, it is worth drawing attention to the size of the booms in domestic activity which accompanied these terms of trade rises. Over the two years 1949/50 and 1950/51, real Australian GDP rose by 17 per cent (Stevens 1992), while over the year to March 1973, it rose by nearly 11 per cent. On these two occasions, terms of trade rises had a big impact on domestic real activity. The evidence from Table 2 is that internationalisation and financial deregulation of the Australian economy since the early 1980s, including floating the Australian dollar, has significantly weakened this relationship between the terms of trade and domestic real activity.
There are two interesting aspects of this weakened relationship. First, while a terms of trade rise still appears to lead to a rise in real Australian output, the rapid real appreciation that now accompanies the terms of trade rise has significantly reduced the strength of this link. Thus, a 10 per cent rise in the terms of trade increases Australian GDP over the subsequent two years by an estimated 1.6 per cent when there is no associated real exchange rate change. However, with the average associated post-float real appreciation, the increase in output is a much smaller 0.5 per cent.[20]
The second interesting aspect to emerge from the table is that foreign influences on the domestic real economy are not well captured by changes in the terms of trade and the real exchange rate. Two pieces of evidence support this argument. First, including only terms of trade and real exchange rate changes in the regression (model 1) explains less of Australian growth than any other regression in the table. Second, once foreign activity is explicitly included in the regression, changes in the terms of trade and the real exchange rate make no economically meaningful contribution to Australian growth – a conclusion supported using all three measures of foreign activity.[21]
On this point, it is worth recalling the evidence from Figure 14 and Table 1. While terms of trade changes are correlated with changes in foreign activity, much of the movement in the Australian terms of trade is not simply a response to the foreign business cycle. This makes the evidence from Table 2 even more interesting. Foreign activity is not simply a proxy for the Australian terms of trade. A shock to foreign activity appears to have a strong (and as we shall see, rapid) impact on Australian growth even when it does not lead to a shock to Australia's terms of trade. By contrast, a terms of trade shock does not appear to have a big impact on Australian growth as long as it is not accompanied by a significant change in foreign activity.
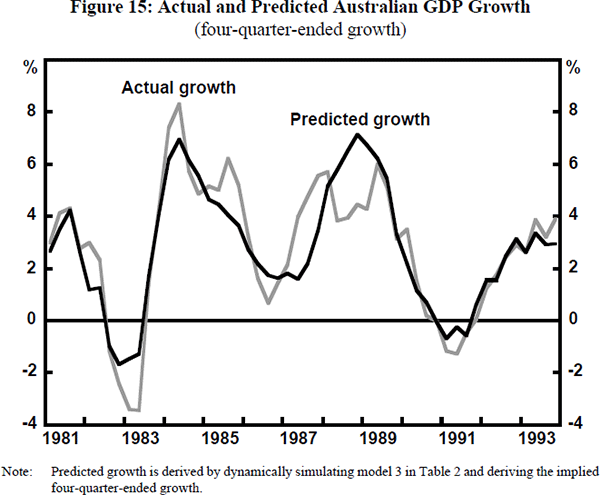
As an example, Australia experienced the biggest terms of trade fall in the estimation period in 1985/86. At the time, OECD growth was relatively buoyant, as Figure 14 shows. While output growth in Australia did slow briefly in 1986 (see Figure 15), the model which includes OECD output growth but not terms of trade changes (model 3 in Table 2) captures this slowing and subsequent acceleration of Australian growth quite well (Figure 15).
Moving beyond the terms of trade, we turn to discussion of the three different foreign
activity measures. Of these measures, the models which include OECD or US GDP
provide much better empirical descriptions of Australian growth than the models
which include the GDP of Australia's export markets (judged by R2
or ) measures). Furthermore,
as previously mentioned, there is much stronger evidence for a stable long-run
relationship between the log levels of Australian and either OECD or US GDP
than between Australian and export markets GDP. This evidence therefore suggests
that the strong growth of Australia's export markets (particularly in Asia)
does not appear to have had much impact on Australian output growth –
at least, not yet.
These results are quite a surprise. In Australian economic debate, terms of trade shocks and changes in demand for Australian exports are perhaps the two most commonly discussed ways in which the rest of the world has an influence on the domestic business cycle. Nevertheless, our evidence provides little support for either of them as dominant channels of foreign influence. As we have seen, since 1980, foreign influences on the domestic real economy are not well explained, either by changes in the terms of trade and the real exchange rate or by growth in Australia's export markets. This suggests that there are links between Australia and the rest of the world that have an important influence on Australian real activity but are not revealed (at least not over a period of a year or two) by changes in either demand or prices for Australian exports. Possible candidates are international links between bond, share and property markets, as well, perhaps, as the international transmission of new ideas and new technologies. We will briefly discuss these links in more detail below. Before doing so, however, we complete our discussion of the results in Table 2.
In terms of goodness of fit, there is not much difference between the models using OECD GDP and those using US GDP. However, the discussion in the last paragraph suggests that measures of foreign output may be acting, at least partly, as proxies for the effects on the Australian real economy of links between Australian and foreign asset markets (or, possibly, the introduction of new foreign technologies or ideas). If so, we presume that broader measures of world output are to be preferred. Hence, we favour model 3, which uses the domestic real cash rate, the weather variable and OECD GDP to explain real Australian growth.
Figure 15 compares actual Australian output growth with growth predicted by this model. The model does an impressive job of tracking the growth of the Australian economy over the estimation period. According to the model, the predominant influences on Australian growth are the stance of domestic monetary policy as well as the level, and the rate of growth, of output in the OECD. To quantify these influences, if the domestic short-term real interest rate is raised by one percentage point (say, from 3 to 4 per cent per annum) for eighteen months, the level of Australian output falls by 0.4 per cent by the end of this time. The largest effect on domestic output growth occurs at the end of the interest rate rise when the four-quarter-ended growth rate has been reduced by about 0.3 percentage points. Monetary policy has a strong, though temporary and substantially lagged, effect on the real economy.[22]
By contrast, a permanent change in OECD output has a rapid and permanent effect on Australian output. A one per cent rise in OECD output raises Australian output by 1.2 per cent in the long run, with over two-thirds of this rise occurring in the same quarter as the rise in OECD output. What explains this extremely rapid transmission from the OECD to Australia? The short answer is that we do not know. It again suggests a possible role for asset markets since it is these markets that respond rapidly to actual or expected changes in the economy.
During the period of estimation (1980 to 1993) the Australian economy has become more open and both deregulation and technological change have strengthened financial links with the rest of the world. Given these changes, it is interesting to see if (or how) the coefficient estimates in the model have changed over time. To this end, the model is estimated initially over the sub-period 1980:1 to 1988:1, then re-estimated after adding each new quarter of data, ending finally with estimates using the whole sample, 1980:1 to 1993:4. (Starting with a shorter sub-period than 1980:1 to 1988:1 generates coefficient estimates with very large standard errors.) The results of this exercise are presented in Figure 16, where each panel of the figure shows a point estimate and the lower two panels show two standard errors either side of the estimate.
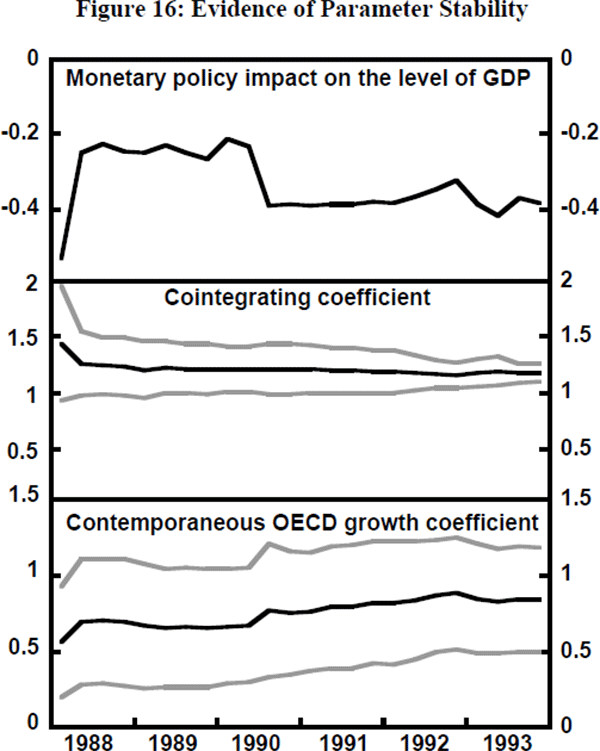
The top panel shows the percentage change in the level of Australian output eighteen months after a one per cent rise in the short-term real interest rate.[23] There is no obvious systematic change in this estimate as the estimation period is lengthened. Thus, changes in the economy in the late 1980s and early 1990s do not appear to have substantially altered the influence of monetary policy on real activity.
The middle panel in Figure 16 shows the estimated ratio of the log levels of Australian and OECD output in the model's long-run equilibrium.[24] For given OECD output growth, this ratio determines the long-run growth rate of the Australian economy. Given the standard errors, there is no obvious change in this estimate as the estimation period is lengthened. This suggests that the changes that have occurred in the Australian economy in the late 1980s and early 1990s have had no obvious impact on the ratio of Australian to OECD long-run growth – at least, not yet. We should, however, register a note of caution. Empirically important changes in the Australian long-run growth rate would be very hard to detect using this analysis.
The bottom panel in the figure shows the estimated coefficient on the contemporaneous growth in the OECD. It therefore shows how much of a shock to OECD output is ‘transmitted’ to domestic growth in the same quarter. Although the standard error bands are wide, the point estimate of this coefficient trends up as the estimation period lengthens from an initial value of 0.57 to a final value of 0.84. While there is no apparent change in the long-run impact on Australian output of an OECD output shock (from the middle panel of the figure), it may be that shocks are now transmitted more rapidly to the domestic economy. This again suggests a possible role for asset markets.
4.2 International Links between Bond, Stock and Property Markets
Our interest in international links between bond, stock and property markets arises from the following implications of our earlier empirical results. Foreign activity plays an important role in explaining the Australian business cycle over the past fourteen years, but neither terms of trade shocks nor changes in demand for Australian exports seem to be dominant foreign influences. Changes in foreign output translate rapidly into changes in Australian output, suggesting a role for asset market links between Australia and the rest of the world. Both deregulation and technological change have strengthened these links, implying that they may be of increased importance for the domestic business cycle. This evidence suggests that, in our preferred model of Australian output growth, foreign output may be acting, at least partly, as a proxy for the effects on the Australian real economy of links between Australian and foreign asset markets.
This sub-section therefore provides evidence on correlations in bond, share and property markets between Australia and the rest of the world. We begin with the most difficult comparison, namely, a comparison between real bond rates in Australia, the US and the ‘world’. To estimate real bond rates requires an estimate of inflationary expectations over the life of the bond. Figure 17 shows US and ‘world’ real bond rates from Blanchard (1993) as well as Australian real bond rates which we have constructed. Blanchard uses inflation forecasts from Data Resources Inc. over the relevant horizon (which, in most cases, is five years) to construct real bond rates. The Australian real bond rates shown in Figure 17 are also for 5-year bonds. Unfortunately, we have inflation forecasts for only the next year (from the OECD) so we use these as forecasts for the average annual inflation rate over the life of the Australian bonds.
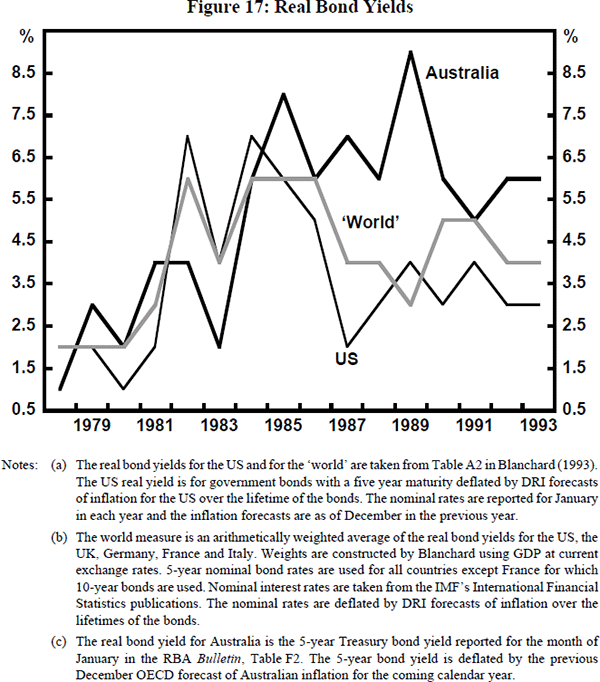
Using these measures, Australian and foreign real bond rates are moderately well correlated. Over the whole period, the correlation between Australian and US real bond rates is 0.37 while between Australian and world real long bond rates, it is 0.41. Alternatively, deriving Australian real bond rates using past four-quarters inflation as an estimate of expected future inflation, gives correlations over the whole period of 0.43 with the Blanchard estimate of the US real bond rate and 0.59 with the estimated world real bond rate.
Turning to stockmarkets, Figure 18 shows the correlation between changes in the Australian stockmarket and two measures of the ‘world’ stockmarket (the US stockmarket and the GDP-weighted stockmarkets of the G7 countries). At each date, the figure plots the correlation between quarterly percentage changes in the Australian and foreign stockmarket indices over the previous three years. We focus on quarterly stockmarket changes because we presume that stockmarket changes over shorter spans of time are of less relevance for the macroeconomy.
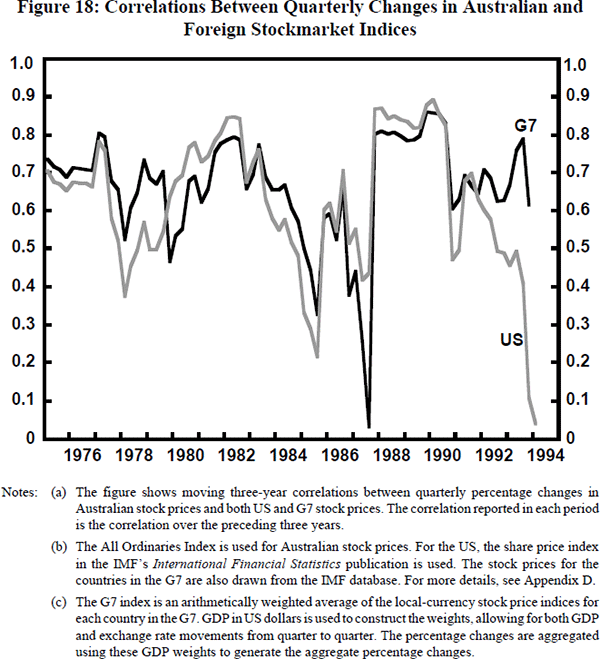
Australian and foreign stockmarket changes are strongly correlated. On average, a substantial part of any change in foreign stockmarkets translates into a change in the Australian stockmarket in the same quarter. As we will see in Table 3 below, the correlation between annual changes in foreign and Australian stockmarkets is even stronger than the correlation between quarterly changes. There are two further interesting aspects of these correlations. First, there is no evidence in these data that the US stockmarket is of disproportionate importance for Australia. The Australian/US correlation between quarterly stockmarket changes over the whole period from 1972:2 to 1993:4 is 0.67 while the Australian/G7 correlation is a slightly larger 0.71. Second, there is no convincing evidence that the correlation between the Australian and foreign stockmarkets has become stronger over time. While the strongest observed correlation in Figure 18 occurs in the late 1980s, this high correlation is explained by the world-wide stockmarket crash in the December quarter, 1987. Once this quarterly change disappears from the three-year correlations plotted in Figure 18 (which occurs in the December quarter 1990) the correlation falls substantially.
| Period | Australia/G7 | Australia/US | ||
|---|---|---|---|---|
| Quarterly | Annual | Quarterly | Annual | |
| 1972:2–1979:4 | 0.70 | 0.89 | 0.64 | 0.88 |
| 1980:1–1993:4 | 0.72 | 0.78 | 0.68 | 0.73 |
| 1980:1–1993:4 excluding the crash | 0.61 | 0.75 | 0.56 | 0.69 |
The results in Table 3 confirm those in Figure 18. The contemporaneous correlation between quarterly changes in the Australian and foreign stockmarkets is marginally stronger after 1980 than before 1980, but only because of the stockmarket crash. Excluding the December quarter, 1987, the contemporaneous correlation between the Australian and foreign stockmarkets is weaker after 1980 than before 1980. Table 3 also shows correlations between annual changes in Australian and foreign stockmarkets. While these are always stronger than the quarterly-change correlations, they have also become slightly weaker over time.
Finally, we turn to the movements of property market prices. Given data limitations, we restrict ourselves to examining the level of property prices rather than deriving time-varying correlations between them. Figure 19 shows commercial property prices deflated by consumer prices for Australia, the US and a GDP-weighted average of the G7.
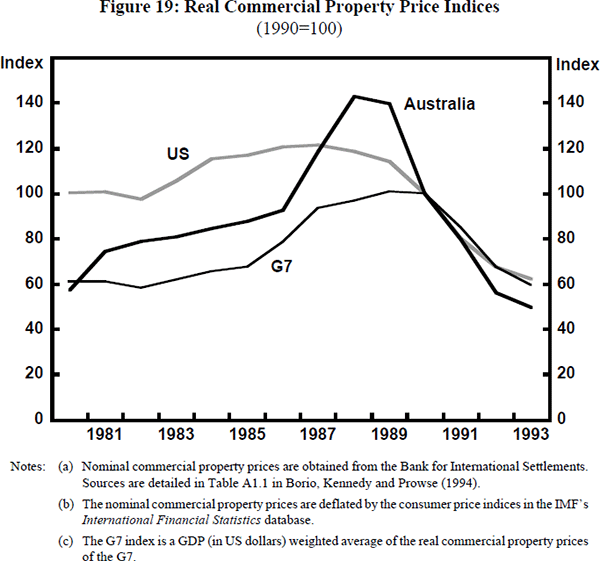
As is the case for stockmarkets, these real commercial property prices show quite strong correlations. Each series rises through the 1980s, peaks between 1987 and 1990 and falls for the rest of the sample. Over the whole sample, the correlation between the real commercial property prices in Australia and the US is 0.70 while between Australia and the G7, it is 0.83.
We turn to the relevance of these correlations between bond, share and property prices. While asset prices are clearly driven by changes in economic fundamentals, they also appear to be influenced by speculative market dynamics (Shiller 1989; Shleifer and Summers 1990). Further, at times, domestic and foreign asset prices may simply be responding to common contemporaneous changes (or shocks) in Australia and overseas (like, for example, financial deregulation). At such times, the asset price correlation does not imply causation. However, with open capital markets, there is also the possibility of transmission of foreign asset price shocks to Australian asset prices by asset trading and the flow of information. This was surely the case in both the stockmarket crash in 1987, and the sell-off of long bonds in 1994. It may also have contributed to both the formation and collapse of the speculative bubble in the Australian commercial property market in the late 1980s and early 1990s.
How does the rapid propagation of price shocks between asset markets translate into a strong contemporaneous correlation between the domestic and foreign business cycles? There are obvious ways in which changing bond, stock and property prices affect real activity. Changing real bond rates alter the real cost of borrowing, changing stock prices influence the cost of equity-financing for firms and changing property prices affect collateral, thus altering firms' and individuals' access to credit. If asset price shocks in different countries take a similar length of time to have an effect on their respective domestic real economies, then rapid transmission of asset price movements between countries will help to synchronise business cycles. Support for the important role of asset prices in general, and property prices in particular, in the boom of the late 1980s as well as the subsequent slow recovery from recession has been widely commented upon (see Blundell-Wignall and Bullock (1992), Lowe and Rohling (1993) and Borio, Kennedy and Prowse (1994)). This is at least suggestive evidence that international links between asset markets may now have an important influence on the domestic business cycle.
5. Policy Implications and Conclusions
Integration with the rest of the world has wide-ranging implications for the Australian macroeconomy. In this paper, we have examined some of these implications for both inflation and the business cycle.
Internationalisation affects domestic inflation in many ways, both by altering the incentives facing the public sector, and by increasing competition in the private sector. With increasing openness, more prices in the economy become sensitive to movements in the exchange rate. Given the importance of the terms of trade for the Australian exchange rate, our analysis concentrated on the changing inflationary impact of terms of trade shocks as the economy becomes more open and the export base is diversified.
The policy implications of terms of trade shocks were profoundly changed by the float of the Australian dollar. Before the float, macroeconomic policy making had great difficulty dealing with terms of trade shocks, particularly terms of trade rises. The problem, however, was one of political economy rather than a lack of understanding of the relevant links in the economy. With a fixed nominal exchange rate regime, it was very difficult for the Federal government to make an explicit decision to revalue the currency, even when the terms of trade were rising strongly. In the short run, such a decision generated a concentrated group of losers in export and import-competing industries. By contrast, the winners from the decision, who would have enjoyed cheaper imports and avoided the inflationary boom, were diffused throughout the wider community. Given this distribution of winners and losers, it is perhaps no surprise that the policy responses to large terms of trade rises were inadequate under a fixed exchange rate regime.[25]
With a floating exchange rate, however, a terms of trade rise leads to rapid nominal and real appreciation. Indeed, since the foreign exchange market is forward looking, the appreciation sometimes occurs in anticipation of future rises in the terms of trade. There may well be adverse micro-efficiency consequences arising from the substantial nominal appreciation that now accompanies terms of trade rises (see Ergas and Wright, this Volume). From a macroeconomic perspective, however, the fact that the appreciation is now delivered by the market seems to be a vital institutional improvement for dealing with terms of trade rises.
The rapid appreciation also implies that the expansionary effect on domestic real activity of the terms of trade rise is reduced substantially (by an estimated 70 per cent over the first two years). Finally, and surprisingly, the appreciation seems to be so large that the net effect of a terms of trade rise is to gradually reduce domestic inflation.
Thus, terms of trade rises now seem to have a favourable impact on both inflation and real activity. Allowing for the diversification of the Australian export base, the magnitude of these favourable impacts may remain roughly stable as internationalisation continues. Thus, terms of trade rises should be much less of a problem for Australian macroeconomic management in the future than they were under a fixed exchange rate regime. The other side of the coin, of course, is that falling terms of trade now appear to have both a contractionary effect on domestic output and an unfavourable impact on inflation. Thus, in contrast to the situation before the float of the Australian dollar, falling terms of trade may present the greater problem for macroeconomic management in the future.[26]
The strong link between the terms of trade and the Australian exchange rate is actually quite a puzzle. While shocks to the terms of trade are quite persistent, they do not seem to be permanent (Appendix C). It is, therefore, not clear why the floating exchange rate responds as much as it does to these shocks. An example makes the point. When the OECD economies slowed in the early 1990s, the Australian terms of trade fell significantly. There is presumably little doubt that the OECD economies will recover, and that, when they do, the Australian terms of trade should be expected to also recover. When this apparently predictable event occurs, the Australian dollar should be expected to appreciate in real terms by almost as much as the terms of trade rise.
Thus, at a time when the Australian terms of trade are low relative to trend, there appears to be an expected excess real return available on assets denominated in Australian dollars. This does not look like the behaviour of an efficient foreign exchange market.[27] Note, however, that it is between two and five years from a terms of trade peak to the next trough. Thus, to exploit this apparent foreign exchange market inefficiency, one must invest with such a time horizon in mind. It may be that central banks are among the few active portfolio managers in the market with an investment horizon this long.
We turn now to our examination of international influences on the domestic business cycle. The past thirty years have been characterised by increasing trade and financial integration between Australia and the world. We have solid evidence that this process of internationalisation has created strong links between Australian and foreign business cycles (Figure 13 and Table 2). Our evidence also suggests that the increasing foreign influence on domestic activity (along with financial market deregulation) has not weakened the influence of monetary policy on the business cycle. However, discovering how foreign influences are now transmitted to the domestic business cycle is far less straightforward. In fact, it is easier to find evidence against obvious channels of transmission than it is to find convincing evidence in favour of other channels!
Two of the most commonly discussed channels by which foreign influences are transmitted to the domestic business cycle are via the terms of trade and via changes in demand for Australian exports. Changes in both the terms of trade and demand for exports do appear to have an impact on domestic real activity in the expected direction. Nevertheless, it is worth summarising the evidence that these channels of transmission do not appear to be the dominant ones. We start with four pieces of evidence concerning the terms of trade.
First, terms of trade shocks now have a muted effect on domestic real activity for the same reason that they seem to have a perverse influence on domestic inflation, namely, because of the large and rapid adjustment of the floating exchange rate. Second, foreign influences on the domestic economy are poorly explained by changes in the terms of trade and the real exchange rate. Third, once foreign activity is explicitly allowed for, terms of trade and real exchange rate changes make no economically meaningful contribution to Australian growth. Fourth, our preferred model of Australian growth (model 3 in Table 2) includes OECD growth but not changes in the terms of trade or the real exchange rate. Nevertheless, this model does a good job of tracking Australian growth over the past fourteen years, including at the time of the big fall in the terms of trade in 1985/86 (Figure 15).
Turning to the second obvious transmission channel, there are two main pieces of evidence suggesting that changes in demand for Australia's exports are not the dominant foreign influence on the domestic business cycle. First, output growth in Australia's main export markets provides a substantially worse explanation for the Australian business cycle than does US or OECD output growth. Second, using our preferred model of Australian growth, shocks to OECD output are rapidly transmitted to domestic activity, with over two-thirds of the long-run impact of a shock on domestic activity occurring in the same quarter as the shock. Changes in demand for exports are unlikely to translate so rapidly into changes in Australian output growth.
Thus, we are left with a puzzle. Foreign output plays an important role in explaining the Australian business cycle since 1980, but we cannot be sure how. Neither terms of trade shocks nor changes in demand for Australian exports seem to be dominant foreign influences. A role for asset market links between Australia and the rest of the world is suggested by the speed with which changes in foreign output translate to Australian output. Further, these international asset links have been strengthened by deregulation and technological change.
To some extent, a process of elimination leads us to the possibility that trade and information flows between Australian and foreign asset markets (bond, share and property markets) may be important channels by which foreign shocks are now transmitted to the domestic business cycle. Strong correlations between these asset-market prices certainly support this suggestion. Further, there are clear ways in which changes in these prices affect real activity (by altering the cost of debt and equity as well as the value of collateral used to secure loans). Continuing international integration will only increase the importance of these asset market links for the domestic business cycle.
Glossary
The following symbols are used in the models in Appendices A and B:
| y | log real income (GDP) |
|---|---|
| yn | log real ‘full-employment’ income |
| ΔyI | impact effect on the log of Australian real income |
| d | log real domestic demand (GNE) |
| m | log real imports |
| n | log real non-traded goods |
| i | nominal short-term interest rate |
| π | expected inflation |
| q (qe) | actual (equilibrium) log real exchange rate (units of foreign currency per unit of domestic currency, adjusted for relative consumer prices) |
| tot | log terms of trade |
| A | domestic absorption |
| NX | net exports |
| Px, Pm, Pn | log prices of exportables, importables and non-traded goods |
| p | log consumer price level |
| β | the import share of GDP (assumed equal to the export share of GDP in the initial period and, except for the alternative model, also equal to the import share of domestic consumption) |
| y*, … | all foreign variables are denoted with a star |
Appendix A: The Australian Macro-Model
The first equation in the model determines domestic real income as a sum of domestic and net foreign demand:

The second equation determines the nominal interest rate. It replaces an equilibrium condition in the money market (the LM curve) in the Mundell-Fleming model:

The third equation determines the exchange rate. Expected returns on domestic and foreign interest-bearing assets are assumed to be equalised, with expected depreciation equal to the expected inflation differential plus some reversion of the real exchange rate to an expected equilibrium level:

The equilibrium real exchange rate is a function of the terms of trade, which are assumed exogenous to the Australian economy since Australia is a small open economy:

The model is completed with determination of domestic prices. The rate of inflation is governed by the combination of an expectations-augmented Phillips curve and the change in the domestic price of imports (note that a rise in q is a real appreciation):[28]

Finally, inflationary expectations adapt gradually towards actual inflation:

All the key parameters in the model, β, δ, φ, θ and λ, are positive.
Appendix B: The Demand and Price Effects of a Terms of Trade Shock
In this appendix, we use the Australian macro-model to analyse the effect of a 10 per cent rise in the terms of trade (though all the analysis applies, with the signs reversed, to a terms of trade fall). The terms of trade rise is:

where the second identity follows from assuming the law of one price for both exports and imports. We derive expressions for the two effects described in the text so that both the increase in demand for non-traded goods and the overall inflationary effect of the terms of trade rise can be quantified. We make the following simplifying assumptions:
- there are three goods in the economy: an import good, an export good, and a non-traded good;
- domestic production is confined to the non-traded and export goods, and, over the time span of interest, supply of the export good is fixed; and
- domestic demand is confined to the non-traded and import goods.
The economy is initially in an equilibrium characterised by:
- real income at its ‘full employment’ level, y = yn;
- the real exchange rate at its equilibrium level, q = qe;
- consumer price inflation at its expected value, Δp = π;
- the real interest rate, i – π, set consistent with full-employment output; and
- balanced trade, with the value of exports and imports both equal to a fraction β of nominal national income.
The terms of trade rise induces a real appreciation of:

which implies a change in the relative price of consumption goods to imports of:[29]

The impact effect on the log of Australian real income, ΔyI , is the product of the increase in the log of Australia's terms of trade and the export share of GDP:

which we assume is associated with a proportionate rise in domestic demand:

where χ is estimated econometrically. The associated rise in demand for imports is therefore:

where εy and εp are the income elasticity and the absolute value of the price elasticity of imports, respectively. By assumption, domestic demand falls on either imported or non-traded goods. The increase in demand for the non-traded good is therefore:[30]

Finally, the overall impact on domestic consumer price inflation is derived from equation (A5) in the Australian macro-model:
where φ* is the slope of the Phillips curve taking into account the change in variable from an increase in national income (Δy = y – yn in equation (A5)) to an increase in demand for the non-traded good, Δn.
We use the following parameter values:
δ = 0.885, from Blundell-Wignall et al. (1993) for the post-float period;
χ = 1.27 (see below);
εy = 1.55, εp = 0.42 from the ‘traditional model’ in Table 1 of Dwyer and Kent (1993); [31]
φ = 0.4 from Table 6 of Stevens (1992) (φ is the reciprocal of the GDP sacrifice ratio); and
φ* =  where
where  is the estimated
ratio of Δy to Δn for a 10 per cent terms of
trade rise at a given trade share. We assume = 1 (see below).
is the estimated
ratio of Δy to Δn for a 10 per cent terms of
trade rise at a given trade share. We assume = 1 (see below).
The cumulated two-year rises in GNE and GDP from a 10 per cent terms of trade rise are estimated in Appendix C. The point estimates (standard errors) are, for GNE, Δd = 2.26 (1.08) per cent-years and, for GDP, Δy = 0.03 (0.95) per cent-years.
To derive the estimate for χ, we use the estimated rise in GNE. It follows from equation (B5) that χ = Δd / (β*Δtot) = 2.26 / (0.178 × 10) = 1.27, because the average value of β over the estimation period 1980–93 is β* = 0.178.
Given the other parameter values, equation (B7) implies that Δn = 1.19 per cent-years for a 10 per cent terms of trade rise at
β = β*. Using the point estimate of Δy
above, implies that = 0.03 / 1.19 = 0.03.
Given the standard error, this point estimate of Δy is very
imprecise and it makes no sense that the boost to GDP is smaller than the
boost to the output of the non-traded sector. We therefore assume that = 1. Importantly,
the qualitative features of the results are not changed if the estimated
rise in GDP is assumed to be
Δy = 0.03 + (two standard errors) = 1.93
which would imply that = 1.93 / 1.19 = 1.62
and hence that 
B1. Alternative Model Assumptions
We again assume β is the trade share of GDP, but now λ1 is the share of imports and λ the share of importables (imports plus domestically-produced import substitutes) in domestic consumption. We assume, at present, with β ≈ 0.20, that:
- the share of imports in consumption (i.e., not re-exported) is λ1 = β(1 – β) = 0.16; and
- domestically-produced import substitutes form 10 per cent of total consumption implying that λ = λ1 + 0.10 = 0.26 (based on personal communication with Jacqui Dwyer, based on Dwyer (1992)).
Next, to characterise the change of the shares of both imports and importables as the trade share rises, we make the following two (arbitrary but plausible) assumptions:
- as the economy continues to open up (i.e., for β > 0.20), the share of importables in consumption rises only half as fast as the trade share of GDP; and
- the share of domestically-produced import substitutes in consumption falls from 0.10 (current estimate) to 0.05 as the trade share rises from 0.2 to 0.35.
It follows that λ1 = 0.16 + (β – 0.20) × 5 / 6 and λ = 0.26 + (β – 0.20) / 2 over the range 0.2 ≤ β ≤ 0.35. In this alternative model, equation (B7) becomes:

For the same reasons as before, we assume that = 1 and hence that
φ* = φ = 0.4. To model incomplete pass-through
of over-the-dock import price shocks to consumer prices, let Δpm
be over-the-dock import price inflation and  the importable
component of consumer price inflation. We assume
the importable
component of consumer price inflation. We assume  where
where  and α
= 1 represents complete pass-through and reduces to the original equation
and α
= 1 represents complete pass-through and reduces to the original equation
 Incomplete pass-through
does not alter the expression for the increase in non-traded demand (equation
(B9)) because εy and εp
are estimated using over-the-dock import prices which are unaffected by incomplete
pass-through. However, equation (B8) now becomes:
Incomplete pass-through
does not alter the expression for the increase in non-traded demand (equation
(B9)) because εy and εp
are estimated using over-the-dock import prices which are unaffected by incomplete
pass-through. However, equation (B8) now becomes:

The alternative model results presented in Figures 7 and 11 use equation (B10) with both α = 0.5 and α = 1.0 to estimate the range of inflation outcomes depending upon the extent of second stage pass-through.
Appendix C: Linking Australia to the World through the Terms of Trade
This appendix explores more fully the relationships between foreign activity and the terms of trade and between the terms of trade and domestic economic activity. It does so in three parts. First, the time series properties of the data are explored. Second, evidence is provided of the relationship between Australia's terms of trade and foreign activity. Finally, the appendix presents estimates of the impact of terms of trade shocks on both GDP and GNE. These models are used in Section 3 of the paper to provide estimates of the effects of a terms of trade shock on the domestic economy.
C1. Univariate Tests of the Data's Time Series Properties
This sub-section examines each series' time series properties. To this end, the following model is estimated for each time series zt:

The testing strategy is as follows. Initially, the null hypothesis β = ρ − 1 = 0 is tested. Rejecting this null implies that either the trend is significant or the series is stationary or both. Results for this test are reported in column 1 of Table C1. As can be seen, even at the 1 per cent level of significance this null can be rejected for Australia's terms of trade and for Australian GNE. If the null is rejected, we must determine if the series is integrated around a deterministic trend. To this end, column 2 of Table C1 reports tests of the null hypothesis ρ − 1 = 0. It can be seen that this null is again strongly rejected for both the terms of trade and GNE suggesting that both series are stationary around a deterministic trend.
| Null Hypotheses | Unit root and no trend(b) | Unit root given trend(c) | Unit root and no drift(d) | Unit root given drift(e) |
|---|---|---|---|---|
| Australian GDP(f) | 3.14 | −2.26 | 8.63** | −0.79 |
| Australian GNE | 9.64** | −4.21** | 3.56 | −0.99 |
| Terms of trade(f) | 8.96** | −3.70* | 0.68 | −1.03 |
| Real TWI | 7.14* | −3.53* | 2.10 | −1.86 |
| OECD GDP(f) | 1.77 | −1.75 | 11.99** | −0.27 |
| USA GDP(f) | 4.17 | −2.66 | 8.03** | −0.69 |
| Export markets GDP(f) | 2.82 | −2.12 | 13.94** | −0.74 |
|
Notes: (a) *(**) implies rejection of the null hypothesis at the 5%(1%) level of
significance respectively. (b) Critical values of 5.47, 6.49 and 8.73 at the 10 per cent, 5 per cent and 1 per cent levels respectively are tabled in Perron (1988) for the test statistic φ3. (c) Critical values of −3.16, −3.46 and −4.06 at the 10 per cent, 5 per cent and 1 per cent levels respectively are tabled in MacKinnon (1991) using 88 observations. (d) Critical values of 3.86, 4.71 and 6.70 at the 10 per cent, 5 per cent and 1 per cent levels respectively are tabled in Perron (1988) for the test statistic φ1. (e) Critical values of −2.58, −2.89 and −3.51 at the 10 per cent, 5 per cent and 1 per cent levels respectively are tabled in MacKinnon (1991) using 88 observations. (f) Enough lags of the dependent variable were retained to eliminate autocorrelation at the 5 per cent level of significance. For the series marked, this could not be achieved, even by including up to 8 lags. Thus, 8 lagged changes are used in these cases. |
||||
If we fail to reject the null that there is no trend and the series is integrated of order one then we move to a restricted model in which β is set to zero. Then the joint null α = ρ − 1 = 0 is tested. Rejection implies either a significant intercept or ‘drift’ or stationarity or both. Results given in column 3 of Table C1 indicate rejection for all of the GDP measures. It is interesting to note that the null is accepted for the terms of trade suggesting that the invalid omission of the deterministic trend reduces the power of the test for a unit root. This lack of power explains the evidence of terms of trade integration presented in Gruen and Wilkinson (1991) and Blundell-Wignall et al. (1993). Again, rejection of the joint null raises the question of whether rejection is caused by stationarity or by a significant drift (or both). Column 4 of Table C1 examines the final hypothesis that ρ − 1 = 0 given that β = 0. In all cases we fail to reject the null, even at the 10 per cent level of significance.
To summarise, we have reasonably strong evidence that the terms of trade, the real TWI and Australian GNE can be adequately represented as stationary series around a linear trend. The evidence for all of the GDP series suggests that they are integrated after allowing for a drift term.
C2. Modelling Australia's Terms of Trade
Given that the terms of trade appear to be stationary around a deterministic trend, it makes little sense to search for cointegrating relationships with foreign activity.[32] Instead, we estimate the following model, allowing foreign activity to enter in quarterly percentage changes.

Table C2 shows estimates with and without the foreign growth terms over the period March 1972 to December 1993 and March 1980 to December 1993. It is apparent that, over the shorter sample period, world activity is more significant and that the linear trend is less pronounced (though still significant).
| 1980:1–1993:4 | 1972:1–1993:4 | |||
|---|---|---|---|---|
| 1 | 2 | 3 | 4 | |
| Constant | 75.42** (5.30) |
72.64** (4.76) |
97.86** (5.08) |
81.75** (4.84) |
| Linear trend | −0.03* (−2.24) |
−0.02* (−2.43) |
−0.07** (−3.64) |
−0.06** (−3.68) |
| Terms of trade Lagged level |
−0.16** (−5.39) |
−0.15** (−4.81) |
−0.20** (−5.16) |
−0.17** (−4.91) |
| % change terms of tradet−1 | 0.16 (1.92) |
0.13 (1.52) |
0.18** (2.62) |
0.14 (1.88) |
| % change terms of tradet−2 | 0.37** (3.29) |
0.40** (3.27) |
0.27** (4.19) |
0.29** (4.27) |
| % change terms of tradet−3 | 0.32** (3.34) |
0.36** (3.77) |
0.27** (4.26) |
0.27** (3.47) |
| % change OECD GDPt | 0.75* (2.22) |
0.78 (1.32) |
||
| % change OECD GDPt−1 | −0.003 (−0.01) |
0.78 (1.02) |
||
| % change OECD GDPt−2 | −0.54 (−1.75) |
−0.84 (−1.88) |
||
| % change OECD GDPt−3 | −0.47 (−1.11) |
−0.22 (−0.52) |
||
| R2 | 0.38 | 0.43 | 0.35 | 0.41 |
|
0.32 | 0.32 | 0.31 | 0.34 |
| Autocorrelation AR(4) |
1.46 {0.83} |
5.34 {0.25} |
15.19 {0.00} |
19.04 {0.00} |
| Joint significance of Δwt to Δwt−3 | 12.32 {0.02} |
7.55 {0.11} |
||
| Note: Numbers in parentheses () are t-statistics. Numbers in brackets {} are p-values. *(**) implies that the coefficient is significant at the 5%(1%) level. Standard errors are estimated using a Newey-West correction allowing for fourth order residual correlation. | ||||
Note that while foreign activity is a significant determinant of Australia's terms of trade (at least over the more recent sample), it does not explain very much of the variation judging by the R2. Clearly foreign activity does not explain the secular decline in the terms of trade that probably arises from a gradual fall in the relative price of commodities to manufactures world-wide. Nor does it explain the magnitude of the terms of trade swings through the 1980s.
Also, while Table C2 suggests that terms of trade shocks are not permanent, the specification including OECD growth terms and estimated using data from 1980 (model 2) indicates that only 14 per cent of a shock has been eliminated after two years. The impulse response function in Figure C1, using model 2, suggests that the remaining shock is quickly eliminated thereafter.
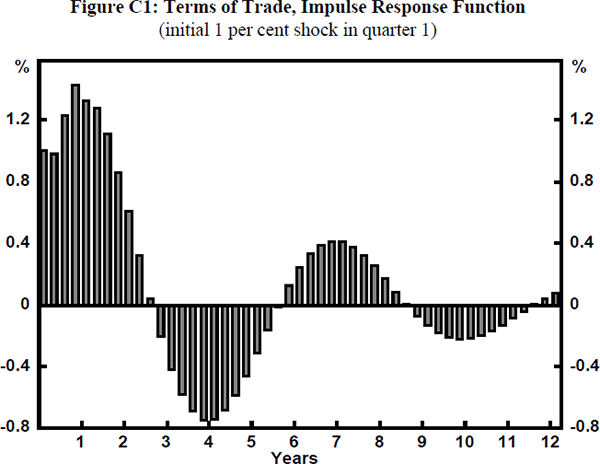
C3. GDP and GNE Responses to Terms of Trade Shocks
In Section 3 in the text, we estimate the inflationary impact of a terms of trade shock. To do so requires estimates of the ‘typical’ GDP and GNE responses to a ‘typical’ terms of trade shock. These can be obtained from a variant of the most general GDP model presented as equation (2) in Section 4. That model suggests that we must take foreign activity, the terms of trade, the real TWI, domestic monetary policy and the weather variable, SOI, into account. For our current purposes, it is not straightforward to use this model because it controls for both real TWI movements and changes in foreign activity. By contrast, in this Appendix we wish to estimate the GDP and GNE response to a terms of trade shock allowing the real TWI and foreign activity to change in their ‘typical’ way. We use a simpler version of this general specification that omits both foreign activity terms and the real TWI terms to arrive at equation (C3).

An alternative approach to estimating the GDP (or GNE) impact of a terms of trade shock would be to separately estimate the relationship between foreign activity and the terms of trade and the relationship between the terms of trade and the real TWI. These estimated relationships could then be used in equation (2) in Section 4 to determine the change in GDP associated with a ‘typical’ terms of trade shock.[33] The advantage of the approach outlined in this Appendix is that we can also estimate the standard errors of our estimates of the GDP and GNE responses to a terms of trade shock. For this reason, we prefer to work with the ‘misspecified’ model defined by equation (C3). Estimates of equation (C3) are reported in Table C3.
| Variable | y = Domestic output (GDP) | y = Domestic demand (GNE) |
|---|---|---|
| Constant | 1.76** (4.71) |
2.11** (5.67) |
| Real cash rateb | −0.032 {0.02} |
−0.043 {0.00} |
| SOIb | 0.009 {0.01} |
0.012 {0.00} |
| Terms of tradeb % Change |
0.002 {0.46} |
0.017 {0.14} |
| R2 | 0.41 | 0.59 |
|
0.19 | 0.43 |
| Rise in GDP/GNE over two years from a 10 per cent terms of trade rise (per cent-years) | 0.03 (0.03) |
2.26* (2.11) |
|
Notes: (a) Numbers in parentheses () are t-statistics. Numbers in brackets {} are
p-values. Statistics marked with *(**) imply that the coefficient or
the average of the coefficients is significantly different from zero
at the 5%(1%) level. Standard errors are estimated using a Newey-West
correction allowing for fourth order residual correlation. (b) The mean coefficient is reported for each of the real interest rate, the Southern Oscillation Index and the terms of trade to summarise the coefficients on their lags. The p-values refer to chi-squared tests of the joint significance of the lags. |
||
The per cent-years of GDP and GNE that are gained (lost) within two years of a positive (negative) terms of trade change are given by:

This formula cumulates the impact on the level of GDP(GNE) in each quarter over two years (for which we require coefficient estimates for quarterly lags 0 to 7). Dividing by 4 converts from per cent-quarters to per cent-years. This calculation implies that a 10 per cent rise in the terms of trade results in a estimated rise of 0.03 per cent-years of GDP and 2.26 per cent-years of GNE over two years. However, these are imprecise estimates, carrying standard errors of 0.95 and 1.08 respectively.
Appendix D: Data Sources
| Data | Source | Freq. | Sample |
|---|---|---|---|
| Real Output | |||
| Gross Domestic Product (Average) | ABS Cat. No. 5206.0, Table 1. | Q | 59:3–94:1 |
| Gross National Product | ABS Cat. No. 5206.0; calculated series. | Q | 59:3–94:1 |
| Gross National Expenditure | ABS Cat. No. 5206.0, Table 26. | Q | 59:3–94:1 |
| Prices | |||
| Consumer Price Indices | ABS Cat. No. 6401.0, Table 1. | Q | 59:3–94:1 |
| Underlying Consumer Price Indices | Treasury Series. | Q | 71:1–94:1 |
| Australian Exchange Rates | |||
| Nominal $US | RBA, Bulletin, Table F9. | M | 69:7–94:2 |
| Nominal TWI | RBA, Bulletin, Table F9. | M | 70:5–94:2 |
| Real TWI | RBA 22 country Real TWI. | Q | 70:1–93:4 |
| International Exchange Rates | |||
| Nominal Domestic Currency / $US | Datastream, **I..RF. | M | 72:1–94:2 |
| Export Shares Data | |||
| Export Shares | Currently obtained from ABS Cat. No. 5410.0. Previous data have been collected from ABS Cat. No. 5424.0 which ends in 92/93 and from ABS Annual Yearbooks and the ABS Overseas Trade Statistics. | A | 59–93 |
| Commercial Property Prices | |||
| All Countries | Bank for International Settlements, Internal Sources. | A | 80–93 |
| G7 Commercial Property Prices | Average commercial property price index for the G7 members, weighting by GDP expressed in $US. | A | 80–93 |
| Real Medium/Long Bond Yields | |||
| Australia | Nominal 5 year bond yield average for January in each year less the OECD December forecasts of inflation for the upcoming calendar year. | A | 77–94 |
| US, Japan, Germany, France, UK, Italy, Canada and the GDP weighted average of the G7 | Blanchard (1993), Table A2. | A | 78–93 |
| Stock Price Indices | |||
| Australia | Datastream, AUSTALL. All Ordinaries Price Index. | M | 70:1–94:3 |
| US | Datastream, USI62…F. IMF International Financial Statistics share prices of commons shares traded on national or overseas stock exchanges. Indices are base weighted arithmetic averages with market value of outstanding shares as weights. | M | 72:1–93:12 |
| Japan | Datastream, JPI62…F. See US source description. | M | 72:1–93:12 |
| Germany | Datastream, BDI62…F. See US source description. | M | 72:1–93:12 |
| France | Datastream, FRI62…F. See US source description. | M | 72:1–93:12 |
| UK | Datastream, UKI62…F. See US source description. | M | 72:1–93:12 |
| Italy | Datastream, ITI62…F. See US source description. | M | 72:1–93:12 |
| Canada | Datastream CNI62…F where possible. Otherwise Datastream TTOCOMP, which is a composite price index for the Toronto Stock Exchange has been spliced onto the data series. | M | 70:1–94:3 |
| G7 | Average stock price index for the G7 members, weighting by GDP expressed in $US. | Q | 72:1–93:4 |
| Interest Rates | |||
| Australian Cash Rate | RBA, Bulletin, Table F1. Unofficial market 11am call (official cash rate spliced on to generate observations before 1982:6). | M | 69:7–94:4 |
| Real Australian Cash Rate | Australian cash rate less underlying inflation over the previous 12 months. | Q | 72:1–93:4 |
| Nominal Australian 10 year Bond Yield | RBA Bulletin Table F2 10 year treasury bonds. | M | 69:7–94:4 |
| Foreign Activity Measures | |||
| US GDP | Datastream, USGDP…D. | Q | 60:1–94:1 |
| OECD GDP | Datastream, OCDGDP..D. | Q | 71:1–93:4 |
| IMF World GDP | International Financial Statistics Yearbook, 1993. | A | 64–91 |
| Export Markets GDP | This series has been constructed from quarterly GDP figures for Australia's major trading partners where available on Datastream. Quarterly percentage changes are constructed for each country and these are aggregated using an export share weighted arithmetic average. The GDP index is then derived from the weighted average growth rate. Up to 15 countries are included in the index. | Q | 60:1–93:4 |
| OECD Industrial Production | Datastream, OCDOCIPDG. | Q | 62:1–93:4 |
| Export Markets Industrial Production | Internal RBA Sources. Constructed using export shares to weight together percentage changes in the industrial production of up to 19 countries. | Q | 60:1–93:4 |
| Terms of Trade | |||
| Australian Terms of Trade | ABS Cat. No. 5206.0, Table 23. | Q | 59:3–94:1 |
| Import Unit Values | Datastream, **I75…F. | M or Q | 72:1–91:4 |
| Export Unit Values | Datastream, **I74…F. | M or Q | 72:1–91:4 |
| International Terms of Trade | Datastream. Where possible, the individual countries' national accounts terms of trade was used. Otherwise, the ratio of export unit values to import unit values was used. This was the case for Colombia, Finland, Greece, Ireland, South Korea, New Zealand, Norway, Philippines, Pakistan and South Africa. | Q | 72:3–91:4 |
| World Prices | |||
| Mineral Commodity Price Index | RBA Commodity Price Index. | M | 82:7–94:5 |
| Rural Commodity Price Index | RBA Commodity Price Index. | M | 82:7–94:5 |
| Aggregate Commodity Price Index | RBA Commodity Price Index. | M | 82:7–94:5 |
| Weights for Commodity Price Index | RBA Commodity Price Index from 82:7 onwards. Previous weights have been interpolated from aggregated export values of each main commodity type in the Monthly Bulletin of Overseas Trade Statistics that were calculated every five years. | A | 55–93 |
| Manufactures Price Series | Datastream, OCDCPPXF. Producer Price Index for manufactured goods for the OECD excluding Turkey. | M | 78:1–94:2 |
| Australian Trade Components | |||
| Rural Exports | ABS Cat. No. 5302.0, Table 11. | Q | 69:3–94:1 |
| Mineral Exports | ABS Cat. No. 5302.0, Table 11. | Q | 69:3–94:1 |
| Manufactured Exports | ABS Cat. No. 5302.0, Table 11. | Q | 69:3–94:1 |
| Service Exports (Credits) | ABS Cat. No. 5302.0, Table 24. | Q | 69:3–94:1 |
| Fuel Imports | ABS Cat. No. 5302.0, Table 12. | Q | 69:3–94:1 |
| Manufactured Imports | ABS Cat. No. 5302.0, Table 12. | Q | 69:3–94:1 |
| Service Imports (Debits) | ABS Cat. No. 5302.0, Table 25. | Q | 69:3–94:1 |
| Weather | |||
| Southern Oscillation Index | Bureau of Meteorology. The Southern Oscillation Index measures the sea level barometric pressure differential between Darwin and Tahiti. | M | 59:9–93:12 |
Footnotes
Our paper has benefited from detailed comments from Palle Andersen, Jacqui Dwyer, Phil Lowe and Rick Mishkin to whom we are very grateful. [*]
To contribute to the theory of gravitation, one must invoke Einstein's General Theory of Relativity while for most practical purposes (including guiding rockets to the moon) the older, more prosaic Newtonian Theory of Gravity suffices. Similarly, while rational expectations is de rigueur in modern theoretical macroeconomics, for many policy purposes, the older, more prosaic assumption of adaptive inflationary expectations is probably a good one, especially in goods and labour markets. [1]
The discipline of financial markets has a wider influence than monetary policy. Fiscal policy, market-based policy reforms and even changes in political leadership are regularly judged by the reaction of financial markets. Grattan (1994, p. 43) suggests that ‘the dollar's float and the consequent market signals gave impetus to other key policy changes. These included the new emphasis on competitiveness and on export orientation, the drive to microeconomic reform, and of course the push into Asia. In this way, taking a somewhat long bow, one could relate Australia's initiatives on the Cairns Group and on APEC to the policy stimulus given by the float.’ [2]
During the 1970s, the nominal exchange rate was not, in fact, fixed. Instead, it was revalued several times as the terms of trade rose, and devalued as the terms of trade fell. These currency realignments were insufficient, however, to insulate the economy from the big changes in the world price of commodities. [3]
We briefly mention a third effect of the terms of trade rise that is also relevant to the inflation outcome. As we have seen, a terms of trade rise is typically caused by a rise in the foreign price of Australian commodity exports. These commodities, particularly energy, are inputs into the domestic production process. Therefore, a rise in their prices adds to domestic costs which puts upward pressure on prices (particularly in the non-traded sector). While this effect is hard to quantify, we have the following reasons for expecting it to be small in general. First, we have an estimate of the indirect price effect of a rise in petrol prices (which seems particularly relevant since petrol and oil are important inputs). Each 1 per cent permanent rise in the domestic price of petrol raises underlying consumer prices by 0.06 per cent in the long r un (de Brouwer, Ericsson and Flood 1994). Second, commodity price rises are usually broadly-based and are associated with substantial exchange rate appreciation (see Figure 1). It follows that even a substantial rise in the foreign prices of commodities translates into a quite small rise in their domestic prices. Taken together, these two strands of evidence imply that, for a typical terms of trade rise, the direct effect of commodity input costs on the general price level should be small. We will not consider it further. [4]
Our focus for estimating the demand effect is on a time-span over which there is excess demand, and hence inflationary pressure, in the non-traded sector. Two years seems a plausible time-span for this. In the numerical work to follow, we therefore use the point estimates of these two-year rises to estimate the total inflationary impact on non-traded goods prices. Of course, changing this two-year cut-off changes our numerical estimates. However, it does not change the qualitative features of the results. We have also derived results assuming that the rise in domestic demand (and/or national income) is two standard errors either above or below the point estimate. Again, this does not overturn our conclusions about the inflationary impact of a terms of trade rise. [5]
A terms of trade rise has a positive impact effect on real domestic purchasing power over domestic and imported goods. For a given percentage increase in the terms of trade, this impact effect rises linearly with the trade share. The estimated effect on domestic demand shown in Figure 6 is derived assuming simply that it is proportional to this impact effect and hence also rises linearly with trade share (see Appendix B). [6]
We show results from two models because, especially when extrapolating future trends, there are several assumptions about which we can only guess. The results in Figure 7 do not include the effects of any monetary policy response to the changed inflationary environment. In the longer run, of course, the stance of domestic monetary policy determines the inflation rate. [7]
Results using the alternative model are shown only for trade shares higher than the current trade share of the Australian economy (β ≈ 0.2). The first refinement is introduced because some imports are used in the production of exports, rather than being either consumed domestically, or used in the production of domestically-consumed goods. This alternative use of imports becomes increasingly important as the trade share rises. (In some countries like Singapore, both export and import shares of GDP are larger than 100 per cent while the import share of domestic consumption is clearly less than 100 per cent.) We assume the same degree of pass-through for both imports and domestically-produced import substitutes. For further details on each of the refinements, see Appendix B. Finally, we use the terms ‘over-the-dock’ and ‘free-on-board’ interchangeably. [8]
‘Manufactures’ should be thought of as a composite of manufactures and services. [9]
We use disaggregated data on the ten rural and seven mineral commodities in the Reserve Bank commodity price index to estimate the variance-covariance matrix for the relative prices of a composite rural commodity to a composite manufacture, and a composite mineral commodity to a composite manufacture. (Details of the calculation are available on request.) [10]
This probably overstates the extent of the fall in terms of trade volatility, for two reasons. First, we have assumed no contribution to volatility from non-commodity exports which become more important as the trade share rises. As Barry Hughes highlights in his comments on the paper, this may not be a good assumption. Second, the fall in the rural share of commodity exports as the trade share rises, although very clear in Figure 2, is statistically insignificant. If this effect is ignored, there is again a smaller fall in estimated volatility as the trade share rises. [11]
OECD output is available on a quarterly basis while a measure of the output of the whole world (from the IMF) is available only on an annual basis. For our econometric analysis to follow, we need the extra degrees of freedom afforded by quarterly data, which explains the focus on OECD output. Given available data, the number of countries in our measure of the output of Australia's export markets rises over time. Over the period 1960–93, it is the output of an average of 11 countries (which together make up an average of 60 per cent of Australia's exports) weighted by Australian export shares. Our econometric analysis to follow uses the estimation period 1980–93, over which time the coverage is 15 countries and an average of 70 per cent of Australia's exports. These 15 countries are, by region: Canada and US; France, Italy, Netherlands, Sweden, Switzerland, UK and West Germany; Hong Kong, Japan, New Zealand, Singapore, South Korea, and Taiwan. [12]
For Keynesian reasons, ‘contractionary’ fiscal policy probably worsens a recession, while at a different stage of the business cycle, it may add to private sector confidence and lead to little or no reduction in output growth. This makes it difficult to estimate empirically the influence of fiscal policy on growth. (During the long expansion of the 1980s, the six countries in the OECD which reduced their general government fiscal deficits by the largest fraction of GDP, experienced output growth only slightly slower than the OECD average. See Alesina, Gruen and Jones (1991)). Likewise, although there is good evidence that the Prices and Incomes Accord reduced real wage outcomes and thereby contributed to real growth in the 1980s (Chapman 1990; Stevens 1992) it is not easy to include the effects of the Accord in an empirical model. [13]
We are faced with the common difficulty in econometrics that we require a time-span of data long enough to generate meaningful results but not so long that the underlying economic relationships change substantially during the estimation period. With this in mind, we omit the more financially-regulated 1970s, and estimate from the beginning of 1980 to the end of 1993, giving fourteen years of data. For these regressions, the float was not an important regime change, because, between 1980 and 1983, the exchange rate was still fairly flexible (it was adjusted daily via a crawling peg with the $US). [14]
For the real short-term interest rate, we use the cash rate set by the Reserve Bank deflated by underlying consumer price inflation (Treasury series) over the past four quarters. Changing the lag structure makes minimal difference, with one exception. If the first lag of the real cash rate is included, it is of the wrong sign and significant, which we presume is a consequence of policy reaction to domestic growth shocks. As a check of robustness, we also repeated all the regressions in the table using the yield spread (the cash rate minus the 10-year bond rate) instead of the real cash rate to control for the influence of monetary policy (we again used lags 2 to 6). The results are qualitatively similar, although both the significance of these variables and the explanatory power of the regressions are mostly reduced. [15]
For reasons we will come to, model 3 is our preferred model. For this model, the first lag of the SOI is significant, the second lag is border-line significant, while further lags and the contemporaneous variable are jointly insignificant. We therefore include the first and second lags of the SOI in each model. [16]
We examined an alternative specification including lags 0 to 11 on the quarterly change in both variables. With this specification, the coefficients on the longer lags are larger in magnitude than those on shorter lags; a result sufficiently at variance with our priors that we rejected this alternative specification. [17]
One must distinguish between the longer-run trend of the real exchange rate, and its shorter-run behaviour. Relatively strong productivity growth in the domestic traded-goods sector is associated with both an appreciating real exchange rate and strong output growth in the longer run. However, a shorter-run real exchange rate appreciation (an appreciation above trend) reduces demand for net exports, and hence, reduces growth. In our regression, the former correlation is captured by the constant term, while the latter one is relevant for the coefficients on the real exchange rate variables. On another point, for both variables, individual lags are mostly of the correct sign (although mostly insignificant). Together, all the lags on Δtot and Δrtwi are jointly highly significant (see the table). There is no evidence of a co-integrating relationship between the log levels of Australian GDP and the terms of trade and/or the real exchange rate (not shown). [18]
The evidence suggests that these log levels of GDP are stochastically non-stationary I(1) variables (see Appendix C). For each measure of foreign growth, lags of both Australian and foreign growth are not statistically significant and the reported specifications are the preferred ones. In each regression, the t-statistic on the lagged log level of Australian GDP can be used to test for cointegration, although it has a non-standard distribution somewhere between the N(0,1) and Dickey-Fuller distributions (Kremers, Ericsson and Dolado 1992). [19]
The numerical estimates are derived from model 1 in Table 2. The real appreciation associated with a floating exchange rate is assumed to occur immediately. Dynamic simulation of the Blundell-Wignall et al. (1993) post-float exchange rate equation implies that this is quite a good approximation. The forward-looking foreign exchange market may sometimes induce a real appreciation in anticipation of a terms of trade rise, which is the widespread interpretation of the real appreciation in early 1994 (see Figure 1). If the appreciation occurs before a terms of trade rise, this further offsets the rise in domestic output growth associated with the terms of trade rise. With a fixed nominal exchange rate, a terms of trade rise still leads to real appreciation, but the timing is different. The terms of trade rise then leads to domestic inflation which, in turn, implies real appreciation. However, with domestic prices adjusting sluggishly, the real appreciation occurs significantly after the terms of trade rise. (With a fixed exchange rate, the central bank must also sterilise any accompanying capital inflow or the domestic money supply will increase, adding to the domestic boom and the accompanying inflation.) [20]
The relevant regressions are 2, 4 and 6. In 2 and 4, the average coefficients on both the terms of trade and the real TWI are quite significant but of the wrong sign, while in 6, they are very small in magnitude. [21]
In the model, the effect of monetary policy on the real economy is temporary provided monetary policy can change the short-term real interest rate only temporarily. This is the usual assumption. [22]
This is a non-linear function of the model coefficients and we have not estimated the associated standard errors. [23]
This ratio is estimated using a Bewley (1979) transformation. The results of Inder (1991) suggest that the associated standard errors are approximately valid. [24]
At the time of the two large terms of trade shocks before the float, mainstream economic advice put the case for an appropriate macroeconomic response. In a memo to the Treasurer in May 1950, the governor of the central bank, H.C. Coombs, argued that: ‘to prevent Australian prices rising dangerously it would be necessary to limit public development works, to budget for a substantial surplus, to free interest rates and to tighten the supply of bank loans, and to increase the flow of imported goods by reductions in the protective tariff, by dollar borrowing and by an appreciation of the Australian pound’ (Coombs 1981, p. 149). Twenty years later, when the terms of trade were again rising, the OECD reported that: ‘…there was intense public discussion of foreign exchange policy in Australia [in late 1971]. Export and import-competing industries (rural, mining and manufacturing) urged devaluation with the US dollar. A group of academic economists urged substantial appreciation relative to the US dollar, primarily to exert downward pressure on domestic prices. … In December, the Australian Government decided [on] an appreciation against the US dollar of only 6.3 per cent [which implied] an overall devaluation of about 2 per cent against the weighted average of currencies of Australia's main trading partners’ (OECD 1972, pp. 52–55, italics added). [25]
One should not overstate the problem of coping with terms of trade falls. Given slow pass-through to consumer prices, the inflationary impact takes some time to appear and should therefore be easier to cope with. Further, the associated real depreciation substantially cushions the real economy from the terms of trade fall. [26]
Of course, to examine this issue carefully, one should also look at foreign/domestic real interest differentials. At the relevant times, these have been in Australia's favour, which only deepens the puzzle. Finally, risk premia could explain the phenomenon if, for some reason, Australian interest-bearing assets are much more risky when the terms of trade are low relative to trend (but expected to improve) and much less risky when the terms of trade are high (but expected to fall). [27]
To derive this equation, start with the more intuitive equations: Δp = (1 − β) Δpn + β Δpm and Δpn = π + φ(y − yn). Then assume the law of one price for imports and that the world price of imports rises at the world inflation rate, π*. Finally, with Δe defined as the change in the nominal exchange rate, the change in the real exchange rate is Δq = Δe + Δp − π*. [28]
Assuming the law of one price, that the world price of imports rises at the world
inflation rate and given the definition Δq = Δe + Δp −
π*, it follows that  . Hence, Δ(p
−
pm) = Δq = δ Δtot.
We use the relative price of consumption goods to imports because it most
closely matches the relative price used in estimation of the income and price
elasticities of imports. (In estimation, the relative price is the difference
between the log GNE deflator and the log import deflator – see below).
[29]
. Hence, Δ(p
−
pm) = Δq = δ Δtot.
We use the relative price of consumption goods to imports because it most
closely matches the relative price used in estimation of the income and price
elasticities of imports. (In estimation, the relative price is the difference
between the log GNE deflator and the log import deflator – see below).
[29]
Real domestic demand D satisfies  where M
and N are levels of demand for real imports and for the non-traded
good and PM and
PN are the respective price levels. It follows that
N
= DRβ − MR where R
= PM /
PN. Taking logs and the total derivative of this expression
and noting that in the initial equilibrium, MR = β DRβ
by assumption, gives the first equality in equation (B7).
[30]
where M
and N are levels of demand for real imports and for the non-traded
good and PM and
PN are the respective price levels. It follows that
N
= DRβ − MR where R
= PM /
PN. Taking logs and the total derivative of this expression
and noting that in the initial equilibrium, MR = β DRβ
by assumption, gives the first equality in equation (B7).
[30]
While these are long-run elasticities, the evidence from Wilkinson (1992) for both income and price elasticities is that most of the effect occurs within two or three quarters. [31]
If one omits a deterministic trend one can find weak evidence of cointegration. However, the sign is perverse, implying that increases in foreign activity are associated with declines in Australia's terms of trade. This spurious relationship appears to be generated by the secular decline in Australia's terms of trade and the steady growth of foreign activity. [32]
We could also obtain estimates of the GDP effect of a 10 per cent terms of trade rise from model 1 of Table 2 which includes the terms of trade and the real TWI but excludes foreign activity. If we assume that the terms of trade rise generates an immediate real TWI response of 8.85 per cent (based upon the estimate in Blundell-Wignall et al. (1993)), we estimate that the shock results in a 1.0 per cent years increase in GDP cumulated over two years which lies within 2 standard deviations of the estimate derived in this appendix. [33]
References
Alesina, A., D.W.R. Gruen and M.T. Jones (1991), ‘Fiscal Adjustment, The Real Exchange Rate and Australia's External Imbalance’, The Australian Economic Review, 95(3), pp. 38–51.
ACTU (1987), Australia Reconstructed, Australian Council of Trade Unions and the Trade Council, Canberra.
Australian Financial Review, Sydney, 17th February 1989, p. 1.
Australian Financial Review, Sydney, 11th October 1993, p. 22.
Bewley, R.A. (1979), ‘The Direct Estimation of the Equilibrium Response in a Linear Model’, Economic Letters, 3(4), pp. 357–361.
Blanchard, O.J. (1993), ‘Movements in the Equity Premium’, Brookings Papers on Economic Activity, 2, pp. 75–138.
Blundell-Wignall, A. and M. Bullock (1992), ‘Changes in the Characteristics of the Australian Business Cycle: Some Lessons for Monetary Policy from the 1980s and Early 1990s’, Reserve Bank of Australia Research Discussion Paper No. 9212.
Blundell-Wignall, A., J. Fahrer and A.J. Heath (1993), ‘Major Influences on the Australian Dollar Exchange Rate.’ in A. Blundell-Wignall (ed.), The Exchange Rate, International Trade and the Balance of Payments, Reserve Bank of Australia, Sydney, pp. 30–78.
Borio, C.E.V., N. Kennedy and S.D. Prowse (1994), ‘Exploring Aggregate Asset Price Fluctuations Across Countries: Measurement, Determinants and Monetary Policy Implications’, Bank for International Settlements, Monetary and Economic Department, Economic Paper No. 40.
Chapman, B. (1990), ‘The Australian Labour Market in the 1980s’, in S. Grenville (ed.), The Australian Macroeconomy in the 1980s, Reserve Bank of Australia, Sydney, pp. 7–65.
Coombs, H.C. (1981), Trial Balance, Macmillan Co. of Australia, Sydney.
de Brouwer, G., N. Ericsson and D. Flood (1994), ‘Modelling and Forecasting Inflation in Australia’, Reserve Bank of Australia, mimeo.
Dwyer, J.A. (1992), ‘The Tradeable Non-Tradeable Dichotomy: A Practical Approach’, Australian Economic Papers, 31(59), pp. 443–459.
Dwyer, J.A. and C. Kent (1993), ‘A Re-examination of the Determinants of Australia's Imports’, Reserve Bank of Australia Research Discussion Paper No. 9312.
Dwyer, J.A., C. Kent and A. Pease (1993), ‘Exchange Rate Pass-Through: The Different Responses of Importers and Exporters’, Reserve Bank of Australia Research Discussion Paper No. 9304.
Grattan, M. (1994), ‘The Float: An Economic and Political Discipline’, Economic Papers, 13(1), pp. 41–44.
Gruen, D.W.R. and J. Wilkinson (1991), ‘Australia's Real Exchange Rate: Is it Explained by the Terms of Trade or Real Interest Differentials?’, Reserve Bank of Australia Research Discussion Paper No. 9108.
Helpman, E. and P. Krugman (1989), Trade Policy and Market Structure, MIT Press, Cambridge, Massachusetts.
Henderson, G. (1990), Australian Answers, Random House, Sydney.
Inder, B. (1991), ‘Estimating Long Run Relationships in Economics: A Comparison of Different Approaches’, Monash University, Department of Econometrics Working Paper No. 18/91.
Kremers, J.J.M., N.R. Ericsson and J.J. Dolado (1992), ‘The Power of Cointegration Tests’, Oxford Bulletin of Economics and Statistics, 54(3), pp. 325–348.
Krugman, P. (1991), ‘Has the Adjustment Process Worked?’, Institute for International Economics Occasional Paper, Washington, DC.
Krugman, P. (1993), ‘What Do We Need to Know About the International Monetary System?’, Essays in International Finance, No. 190, International Finance Section, Department of Economics, Princeton University.
Levinsohn, J. (1993), ‘Testing the Imports-as-Market-Discipline Hypothesis’, Journal of International Economics, 35(1/2), pp. 1–22.
Lowe, P. (1992), ‘The Term Structure of Interest Rates, Real Activity and Inflation’, Reserve Bank of Australia Research Discussion Paper No. 9204.
Lowe, P. and T. Rohling (1993), ‘Agency Costs, Balance Sheets and the Business Cycle’, Reserve Bank of Australia Research Discussion Paper No. 9311.
Macfarlane, I. (1994), ‘The Exchange Rate, Monetary Policy and Intervention’, Economic Papers, 13(1), pp. 4–16.
MacKinnon, J.G. (1991), ‘Critical Values of Cointegration Tests’, in R.F. Engle and C.W.J. Granger (eds), Long-Run Economic Relationships: Readings in Co-integration, Oxford University Press, Oxford, pp. 267–276.
McTaggart, D. and T. Hall (1993), ‘Unemployment: Macroeconomic Causes and Solutions? or Are Inflation and the Current Account Constraints on Growth?’, Bond University Discussion Paper No. 39.
OECD (1972), Economic Survey of Australia 1972, OECD, Paris.
Perron, P. (1988), ‘Trends and Random Walks in Macroeconomic Time Series: Further Evidence from a New Approach’, Journal of Economics, Dynamics and Control, 12(2/3), pp. 197–332.
Rogoff, K. (1985), ‘Can International Monetary Policy Cooperation be Counterproductive?’, Journal of International Economics, 18(3/4), pp. 199–217.
Romer, D.H. (1991), ‘Openness and Inflation: Theory and Evidence’, NBER Working Paper No. 3936.
Shiller, R. J. (1989), Market Volatility, MIT Press, Cambridge, Massachusetts.
Shleifer, A. and L.H. Summers (1990), ‘The Noise Trader Approach to Finance’, Journal of Economic Perspectives, 4(2), pp. 19–33.
Stevens, G. (1992), ‘Inflation and Disinflation in Australia: 1950–91’, in A. Blundell-Wignall (ed.), Inflation, Disinflation and Monetary Policy, Reserve Bank of Australia, Sydney, pp. 182–244.
Wilkinson, J. (1992), ‘Explaining Australia's Imports: 1974–1989’, Economic Record, 68(201), pp. 151–164.