RDP 2022-09: Estimating the Effects of Monetary Policy in Australia Using Sign-restricted Structural Vector Autoregressions 5. Robustness Exercises
December 2022
- Download the Paper 1.84MB
This section explores the sensitivity of the results obtained under Restriction (6) to selected changes in the modelling assumptions.
5.1 Model in first differences
Typical monetary policy rules embedded in macroeconomic models assume that the central bank responds to inflation and some measure of economic activity, such as the output gap or real GDP growth. In contrast, the monetary policy reaction function underlying the restrictions imposed in Section 3 is specified in the levels of prices and output. As a robustness exercise, I re-estimate the reduced-form VAR with all variables in first differences with the exception of interest rates and the TWI. I impose a variation of Restriction (6). I assume that the coefficients on GDPt and CPIt in the equation for CASHt are non-positive and the coefficient on TWIt is non-negative. I continue to impose the proxy-based restrictions alongside restrictions on the impulse responses of CASHt, CPIt and TWIt (i.e. there are sign restrictions on the cumulative impulse response of CPIt). The restrictions are therefore largely consistent with the restrictions imposed when the model is estimated in levels.
The response of output to the shock is qualitatively similar to that obtained when all variables enter the model in levels (Figure 8). In contrast, the robust credible intervals include positive price responses at horizons beyond one year, so price puzzles are no longer necessarily assigned low posterior probability.
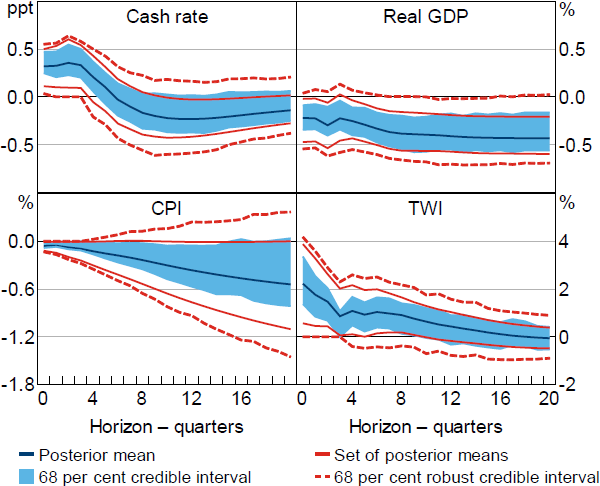
Notes: Estimates obtained under a version of Restriction (6) modified to account for some variables entering the model in differences. Impulse responses are to a positive, standard deviation monetary policy shock.
5.2 Inflation-targeting period
The baseline specification uses an estimation sample that starts in the March quarter 1984 and ends in the December quarter 2019. This sample period is chosen with the objective of maximising the number of observations, which should improve the precision of the estimates, subject to limiting the amount of structural change that is likely to have occurred during the period. One concern with this sample period is that it includes a change in the monetary policy regime; the RBA began to target consumer price inflation in the early-to-mid 1990s. I therefore consider estimating the model over a shorter sample period in which the monetary policy regime was more plausibly constant.
It is difficult to be precise about the exact start of explicit inflation targeting by the RBA. However, there appears to be a rough consensus that inflation targeting was undertaken from at least 1993 (and possibly earlier). For example, speeches by the Governor at the time, Bernie Fraser, in 1992 and 1993 contain references to the practice of inflation targeting by the RBA (Fraser 1992, 1993a, 1993b). I therefore consider an estimation sample that begins in the March quarter 1993, although other choices of starting date could also be reasonable.
Under the shorter estimation sample, the robust credible intervals for the responses of output and prices include zero at most horizons (Figure 9). The evidence that output and prices fall following a monetary policy shock is weaker than that obtained using the full estimation sample; for example, the posterior lower probability that the output response is negative after two years is only about
40 per cent and the posterior lower probability that the response of prices is negative after three years is about 70 per cent. The sensitivity of the results to estimating the model over the inflation-targeting period is consistent with the idea that, because monetary policy has been conducted more systematically over this period, it is more difficult to identify monetary policy shocks and their effects (e.g. Ramey 2016).[25] Although the robust credible intervals are narrower in the inflation-targeting period (compare Figures 6 and 9), this seems to largely reflect that the impact response of the cash rate is more precisely estimated (or more tightly identified).
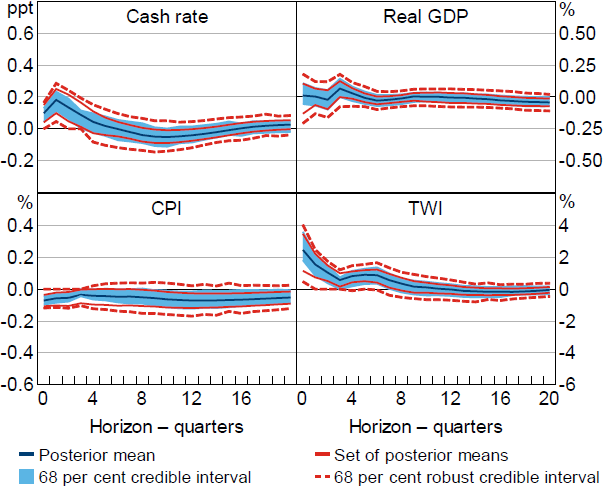
Notes: Estimates obtained under Restriction (6). Estimation sample begins in the March quarter 1993. Impulse responses are to a positive, standard deviation monetary policy shock.
5.3 Credit spreads
Beckers (2020) finds evidence to suggest that the cash rate responds to contemporaneous developments in credit conditions, as measured by credit spreads, even after controlling for the response of the cash rate to forecasts of economic conditions. Accordingly, I investigate the robustness of my results to adding a measure of money market spreads, MMSt, to the reduced-form VAR.[26] This variable is available from the September quarter 1992, but I set the estimation sample to be consistent with the exercise in Section 5.2 (i.e. the sample begins in the March quarter 1993). I also impose additional identifying restrictions related to credit spreads. Specifically, in addition to Restriction (6), I impose that the response of MMSt+h is non-negative for h = 0,1,2,3, so credit spreads cannot decline immediately following a positive monetary policy shock. Additionally, the coefficient on MMSt in the equation for CASHt is restricted to be non-negative, so the central bank does not increase the cash rate in response to higher credit spreads.
The results obtained under these restrictions are broadly similar to those obtained when estimating the model over the inflation-targeting period (Figure 10). One notable difference is that the robust credible intervals for the response of prices now exclude zero at many intermediate horizons. Consistent with this, the posterior lower probability that prices decline is around 90 per cent at horizons beyond one year. The difference in the responses of prices relative to the previous model reflect both the inclusion of credit spreads in the model as well as the additional identifying restrictions related to credit spreads. The posterior lower probability that output declines following the shock is fairly low at horizons shorter than around four years.[27]
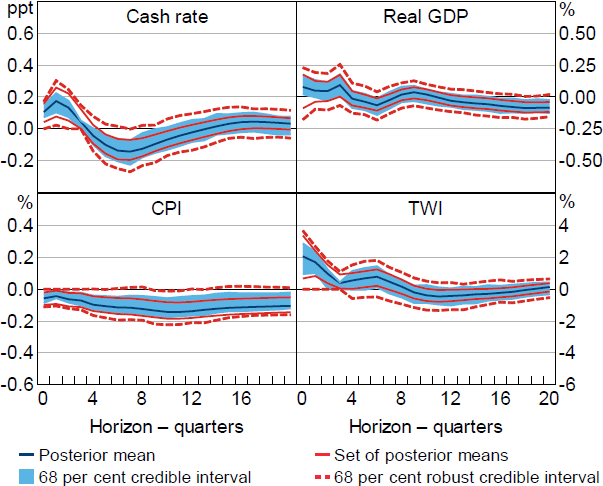
Notes: Estimates obtained under a version of Restriction (6) augmented to account for credit spreads entering the model. Estimation sample begins in the March quarter 1993. Impulse responses are to a positive, standard deviation monetary policy shock.
5.4 Unemployment
Given the RBA's mandate to pursue price stability and full employment, it may be more natural to impose restrictions on the systematic response of the cash rate to unemployment rather than to output. Additionally, given this mandate, the response of unemployment to a monetary policy shock is of interest. I therefore consider replacing GDPt in the VAR with the unemployment rate, URt. I impose that, all else equal, monetary policy is not tightened in response to higher unemployment. The restrictions are otherwise the same as in Restriction (6) and the response of the unemployment rate is left unrestricted.
Under these restrictions, the unemployment rate appears to increase in response to the shock (Figure 11); the posterior lower probability that the response of the unemployment rate is positive after two years is around 90 per cent. In response to a 100 basis point shock, the posterior lower probability that the response of the unemployment rate exceeds 0.25 percentage points is around 50 per cent and the lower probability that it exceeds 0.5 percentage points is less than 20 per cent. In comparison, the point estimates in Beckers (2020) suggest that the unemployment rate increases by a maximum of around one-third of a percentage point. The peak response of the unemployment rate in the MARTIN model is smaller than this, at a bit less than 0.15 percentage points. My estimates imply that there is a reasonably high posterior probability that the response of the unemployment rate is larger than in the MARTIN model; the posterior lower probability that the response of the unemployment rate two years after the shock exceeds the peak response in MARTIN is around 80 per cent.
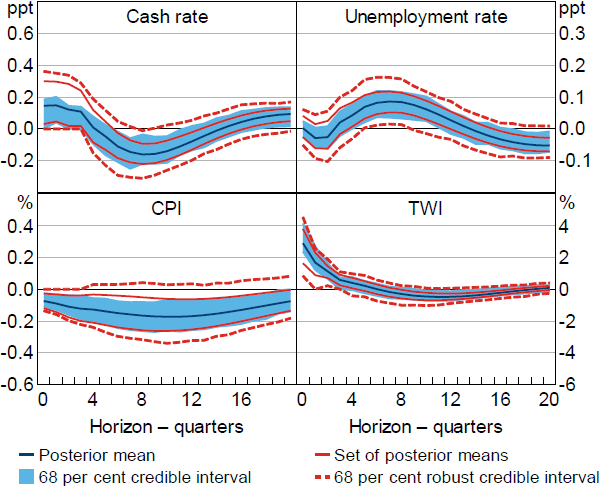
Notes: Estimates obtained under a version of Restriction (6) modified to account for the unemployment rate replacing real GDP in the model. Impulse responses are to a positive, standard deviation monetary policy shock.
Footnotes
Estimating the model in first differences using the inflation-targeting sample (e.g. combining the exercises in Sections 5.1 and 5.2) yields even weaker evidence that output and prices fall. [25]
The measure of money market spreads follows that constructed in Beckers (2020). See Appendix B for details. [26]
The observation that the proxy appears to contain useful identifying information in this model suggests that the apparent informativeness of the proxy-based restriction is not purely due to the VAR omitting relevant information about credit spreads; see the discussion in footnote 19. [27]