RDP 9314: The Demand for Money in Australia: New Tests on an old Topic 4. Cointegration
December 1993
- Download the Paper 135KB
In this section, we use the Engle-Granger procedure and the Johansen procedures to test for the existence of cointegration (see Appendix 2 for a summary of the procedures). The Engle-Granger procedure is a static, single-equation, residual-based test for cointegration. Critical values are drawn from Phillips and Ouliaris (1990). The Johansen procedure is a general dynamic systems technique, where the variables are parameterised in terms of lagged first differences and the lagged level of the systems variables. Johansen and Juselius developed a maximum likelihood procedure to decompose the coefficient matrix on the lagged level variables into a matrix of cointegrating vectors and a matrix of ‘speed of adjustment’ vectors, which is interpreted analogously to the coefficient on the error-correction variable in the Engle-Granger error-correction representation. They also developed two likelihood ratio tests to determine the number of stationary combinations of the variables under consideration. Critical values are drawn from Osterwald-Lenum (1992). Since the data are quarterly, the lag length for the Johansen procedure is set at four.
The findings of cointegration are summarised in Table 3, where ‘E’ and ‘J’ stand for rejection of the null hypothesis of no cointegration at the 5 per cent level using the Engle-Granger and Johansen procedures respectively, and ‘NO’ means no cointegration. Using the Johansen technique, there was at most one cointegrating vector for each money-income relationship, and these are presented in Tables 4 to 7, along with restrictions on the real income elasticities and nominal interest rate semi-elasticities. The restrictions on the long run parameter estimates are tested using the coefficients obtained from a Bewley (1979) transform of the autoregressive distributed lag model (which are virtually identical to the coefficients estimated using the Johansen procedure). The restrictions tested are whether the income elasticity and the interest semi-elasticity are different from zero. While the standard errors from a Bewley transform are not asymptotically normal, Inder (1991) shows that inferences drawn from such dynamic specifications are not misleading (see also Lim and Martin (1992)).[8]
| Regressors Money Aggregates | GDP | GDP O/R | GDP BILL | GDP 2yr | GDP 10yr | GNE | GNE O/R | GNE BILL | GNE 2yr | GNE 10yr | PFD | PFD O/R | PFD BILL | PFD 2yr | PFD 10yr | Outcome |
|---|---|---|---|---|---|---|---|---|---|---|---|---|---|---|---|---|
| E = cointegration at the 5 per cent critical level using
the Engle-Granger Procedure. J = cointegration at the 5 per cent critical level using the Johansen Procedure. |
||||||||||||||||
| CURRENCY | NO | – | NO | E/J | E/J | NO | – | NO | E/J | NO | NO | – | J | J | NO | 8/24 |
| MB | NO | – | NO | E | NO | NO | – | NO | NO | NO | NO | – | NO | NO | NO | 1/24 |
| MB-SRD | NO | – | NO | J | NO | NO | – | NO | J | NO | NO | – | NO | NO | NO | 2/24 |
| MB-AMMD | NO | – | NO | NO | NO | NO | – | NO | NO | NO | NO | – | NO | NO | NO | 0/24 |
| MB-SRDAMMD | NO | – | NO | J | NO | NO | – | NO | J | NO | NO | – | NO | J | NO | 3/24 |
| NC-MB | NO | – | NO | NO | NO | NO | – | NO | NO | NO | NO | – | NO | NO | NO | 0/24 |
| NC-MB-SRD | NO | – | NO | J | NO | NO | – | NO | J | NO | NO | – | NO | NO | NO | 2/24 |
| NC-MB-AMMD | NO | – | NO | NO | NO | NO | – | NO | NO | NO | NO | – | NO | NO | NO | 0/24 |
| NC-MB-SRDAMMD | NO | – | NO | J | NO | NO | – | NO | J | NO | NO | – | NO | J | NO | 3/24 |
| M1 | NO | NO | NO | NO | NO | NO | NO | NO | NO | NO | NO | NO | NO | NO | NO | 0/30 |
| M3 | NO | J | NO | J | NO | NO | NO | NO | NO | NO | NO | NO | NO | J | NO | 3/30 |
| M3-BA | NO | J | NO | NO | NO | NO | NO | NO | NO | NO | NO | NO | NO | NO | NO | 1/30 |
| BROAD MONEY | NO | NO | NO | NO | NO | J | NO | J | J | J | NO | NO | E | NO | NO | 5/30 |
View full Table 3: Summary of Cointegration Results
We now discuss the results for each of the aggregates, and then proceed to draw these together in a general discussion.
4.1 Currency
Of a possible 24 combinations between currency, activity and interest rates, we found 8 cases of cointegration. Both procedures produce results which are very similar, indicating the importance of GDP/GNE and the two/ten-year bond yields in identifying a long-run relationship. The Johansen procedure also suggests that PFD is a relevant scale variable in explaining currency. The cointegrating vectors estimated using the Johansen procedure are set out in Table 4.
| Equation | GDP | GNE | PFD | BILL | 2YR | 10YR |
|---|---|---|---|---|---|---|
| Currency | 1.1019 (25.11)* |
−0.0104 (−4.07) |
||||
| Currency | 1.1632 (16.20)* |
−0.0180 (−4.75)* |
||||
| Currency | 1.2118 (15.92)* |
−0.0203 (−4.45)* |
||||
| Currency | 1.0559 (29.31)* |
−0.0086 (−3.48)* |
||||
| Currency | 1.3129 (8.68)* |
−0.0255 (−2.83)* |
||||
| * indicates significance at the 1 per cent level, t-statistic in parentheses. | ||||||
While the incidence of cointegration is small, the equations themselves produce plausible results. The elements of the cointegrating vectors are statistically significant and ‘correctly’ signed, and indicate a greater than unitary real income elasticity of demand for real currency balances and a low negative interest sensitivity. The result of Lim and Dixon (1991) that currency and GNE alone are cointegrated in real terms is not replicated for either procedure on our longer data set and for different measures of activity.[9]
4.2 Money Base
Given eight definitions of the real money base, three definitions of real activity, three definitions of nominal interest rates and two estimating procedures, there are 192 feasible combinations. Evidence supporting cointegration was found in only 11 of these. Only 1 cointegrating vector was found using the Engle-Granger procedure: a relationship between the real money base, as conventionally defined, and real GDP and the two-year bond yield.
Using the Johansen procedure, there are 10 cointegrating vectors out of a possible 96. In this case, the SRD-adjusted money base measures are the only ones which exhibit a long-run relationship with activity and interest rates. The cointegrating vectors are set out in Table 5.
| EQUATION | GDP | GNE | PFD | 2YR |
|---|---|---|---|---|
| MB-SRD | 0.9623 (4.10)* | −0.0570 (−3.67)* | ||
| MB-SRD | 0.9920 (5.19)* | −0.0627 (−4.97)* | ||
| MB-SRDAMMD | 1.1983 (5.22)* | −0.0676 (−4.65)* | ||
| MB-SRDAMMD | 1.2633 (5.93)* | −0.0756 (−5.47)* | ||
| MB-SRDAMMD | 1.2952 (5.59)* | −0.0770 (−5.18)* | ||
| NC-MB-SRD | 0.6331 (1.02) | −0.1129 (−3.21)* | ||
| NC-MB-SRD | 0.7054 (1.51) | −0.1201 (−4.12)* | ||
| NC-MB-SRDAMMD | 1.3234 (3.02)* | −0.1343 (−4.69)* | ||
| NC-MB-SRDAMMD | 1.4545 (3.46)* | −0.1458 (−5.15)* | ||
| NC-MB-SRDAMMD | 1.4721 (3.05)* | −0.1459 (−4.66)* | ||
| * indicates significance at the 1 per cent level, t-statistic in parentheses. | ||||
It is unclear to what extent the money base result is driven by currency or by the non-currency components. There is a high degree of correspondence between the results for the SRD-adjusted money base and the results for currency, which suggests that the money base is driven by currency. For example, the real income elasticity of real money base is similar to that of real currency (that is, unity). This is hardly surprising since currency constitutes 80 per cent of the money base.
On the other hand, in the cases where cointegration holds, it also does so for the non-currency component of the money base, though the income elasticity of demand for money is statistically insignificant in two of the five instances. There is only a separate meaningful long-run relationship between the non-currency component of the money base, income and the two-year bond yield when the non-currency component of the money base is defined as SRD-adjusted reserves plus loans to dealers.
4.3 M1
There is no evidence of cointegration between real M1, real activity and interest rates using either technique. This is consistent with de Haan and Zelhorst's (1991) result of no cointegration. While the results are not reported, there are cointegrating relationships between real M1, the own-rate of return on M1, the two-year bond yield and activity on all three measures. The coefficients on the activity variable and the two-year bond yield, however, are signed inconsistently with theory, which renders the result of little practical use. Including the inflation rate does not change this outcome.
4.4 M3
Using the Engle-Granger procedure, there is no evidence of cointegration between either M3, real activity and interest rates. Using the Johansen procedure, 4 out of a possible 60 estimations yielded cointegration, and these are presented below in Table 6.
| Equation | GDP | PFD | Own Rate | 2YR |
|---|---|---|---|---|
| M3 | 3.2730 (0.27) | −0.1924 (−0.15) | ||
| M3 | 1.7101 (2.24)# | −0.0542 (−1.71) | ||
| M3 | 2.0141 (5.48)* | −0.0705 (−3.58)* | ||
| M3-BA | 2.8185 (0.21) | −0.1592 (−0.18) | ||
| * indicates significance at the 1 per cent level, t-statistic in parentheses. # indicates significance at the 5 per cent level, t-statistic in parentheses. |
||||
In general, the M3 results are ambiguous and difficult to interpret. First, in two of the cointegrating equations, none of the coefficients are significantly different from zero. Second, the reported M3 series would be expected to be conceptually inferior to the break-adjusted, since it is a less accurate measure of the aggregate, but it is only the reported series which contains significant coefficients in the cointegrating equation. Third, if the principal use of money is to fund transactions, then the long-run income elasticity would be expected to be around one. For those cointegrating vectors which are significant, however, the income elasticity is about 2, which is apparently distorted by rapid M3 growth in the latter half of the 1980s, reflecting increased demand for monetary assets. Furthermore, the coefficient on the own-rate (where included) in these equations is negative and hence ‘wrongly’ signed, and including the inflation rate as a measure of opportunity cost reverses the finding of cointegration. Overall, evidence of cointegration between M3, activity and interest rates is very weak.
4.5 Broad Money
There are 5 cointegrating relationships out of a possible 30 in this case. Using the Engle-Granger procedure, there is only one cointegrating vector – relating broad money, PFD and the bill rate. Using the Johansen procedure, there are 4 cointegrating relationships with GNE the only cointegrating scale variable. The vectors are set out in Table 7.
| Equation | GNE | Bill Rate | 2 Year Bond | 10 Year Bond |
|---|---|---|---|---|
| Broad Money | 1.3523 (32.16)* | |||
| Broad Money | 1.3521 (38.04)* | −0.0040 (−1.18) | ||
| Broad Money | 1.3495 (34.41)* | −0.0045 (−1.34) | ||
| Broad Money | 1.3211 (39.09) | −0.0023 (−0.73) | ||
| * indicates significance at the 1 per cent level, t-statistic in parentheses. | ||||
The elements of the cointegrating vectors are signed as expected, but the semi-elasticities on the interest rate variables are all statistically insignificant. The broad money own-rate does not contribute anything to the analysis. It is worth noting that the sample size of broad money is considerably smaller than for the other monetary aggregates, and this may have an effect on estimation bias and the confidence with which a result of cointegration can be accepted as depicting a long-run relationship (Juselius (1991)).
4.6 Some General Observations
The results are not particularly supportive of the proposition that there is a long-run linear relationship between money, income and interest rates in Australia. Of a total of over 300 feasible combinations of real money, real income and nominal interest rates, we found cointegration only in 28 cases, or 8 per cent of the total. As expected, there were more cases of cointegration when money and income were defined in nominal values, due to a common price trend, but this was insubstantial, with cointegration occurring only in 40 cases, or 12 per cent of the total.[10]
The results vary to some extent with the monetary aggregate under consideration. One would expect that broad money would have a more reliable relationship with activity than M3 or M1, for example, since it is less distorted by regulation, deregulation and technological change (though its composition would be heavily affected by such factors). This appears to be the case, although there is not much in it. The results for broad money, moreover, are sensitive to the choice of the activity variable. The evidence of cointegration for M1 and M3 is particularly weak. The evidence of cointegration is much weaker for the Engle-Granger procedure than for the Johansen procedure (see below).
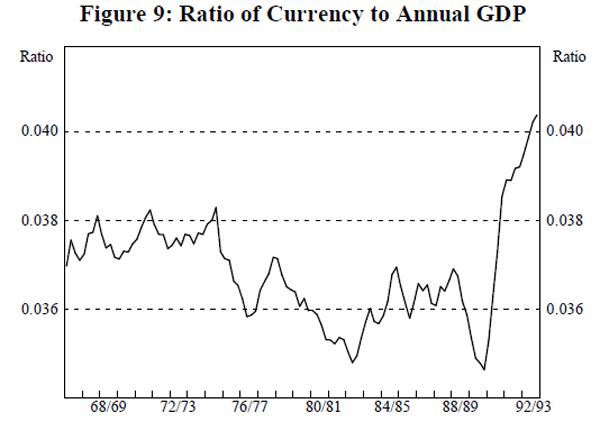
Currency is the aggregate which exhibits the most consistent relationship with activity and interest rates, in the sense that the results are least sensitive to the choice of activity variable or interest rate. This relationship is not as strong now, however, as it was over the sample period used in the formal tests since, as shown in Figure 9, the ratio of currency to income shifted markedly from 1990/91, in response to a number of factors.[11]
Since the money base is mostly currency, we anticipated that the results for the money base estimations would be similar to those for currency. Given that the evidence of cointegration between M3 and activity is weak, we expected that the relationship between bank reserves and activity would also be weak. As it turned out, there are proportionally fewer cases of cointegration with the money base (including currency) than for currency itself and those cases that do occur do so only with the Johansen procedure.
There are two alternative (but not mutually exclusive) explanations of why the Johansen technique may uncover more cases of cointegration than the Engle-Granger procedure:
- the Engle-Granger test for cointegration imposes a common factor restriction on the variables which is only appropriate when there are no short-run dynamics or when short-run and long-run adjustment is the same. If this restriction is invalid, the power of the test in identifying cointegration is low (Kremers, Ericsson and Dolado (1992)). The Johansen procedure, on the other hand, is a dynamic modelling procedure which does not impose the restriction. Both procedures produce similar results with regard to currency, giving rise to the inference that the public adjusts its currency balances to the desired level fairly rapidly. On the other hand, the Engle-Granger procedure uncovers few, if any, relationships between the other aggregates – money base, M1, M3 and Broad Money – and activity, giving rise to the inference that the restriction is not valid for them. Changes in income do not have the same effect on deposits with financial institutions in the short-run as in the long-run: it takes time for the public to adjust the portfolio composition of its assets. Since deposits are not adjusted instantaneously to changes in income, neither are required reserves; and
- Monte Carlo experiments by Gregory and Nason (1991) indicate that adjusted Dickey-Fuller residual-based tests for cointegration, such as the Engle-Granger procedure, fail to reject the null hypothesis of no cointegration in the presence of structural breaks in the cointegrating relations between the series. The unit root tests indicated that the reserves components of the money base and M1 contained at least one major trend break, and this may also be expected to hold for the putative cointegrating relation with income.
Overall, the results are sensitive to the definition of both the activity variable and the interest rate. Gross domestic product is the activity variable which occurs most frequently in the cointegrating vectors, twice as often as private demand (twelve times to six). The two-year bond yield is the key rate, appearing in 19 of the 28 cointegrating vectors. Such sensitivity of the results to fairly arbitrary changes in the definition of the variables curtails the policy relevance of monetary aggregates.
The prevalence of the two-year bond yield suggests that people look to medium-term interest rates in determining their long-run real demand for money. It has the further implication that a policy of controlling the medium-term growth of a nominal variable such as the money stock through short-term interest rates would only be effective if the short-term rate changes were expected to endure, such that they affected rates further out on the yield curve.
Finally, it is one thing to be able to say that there is a long-run relationship between money and income, but it is quite another to be able to exploit that relationship for policy purposes. This raises a raft of issues, including causation between money and income, stability and speed of adjustment to equilibrium, and whether substitutes for money can be readily created to avoid control of the money supply. Consider actual real demand for currency and the equilibrium implied by one of the cointegrating relationships in Table 4 (chosen at random), as shown in Figure 10. The actual value can deviate from the estimated equilibrium value for up to two years at a time, and the deviation from equilibrium has been neither systematic nor of regular duration. There also appears to be a tendency for growth in actual real demand for currency to overshoot rises and falls in growth of equilibrium real demand.
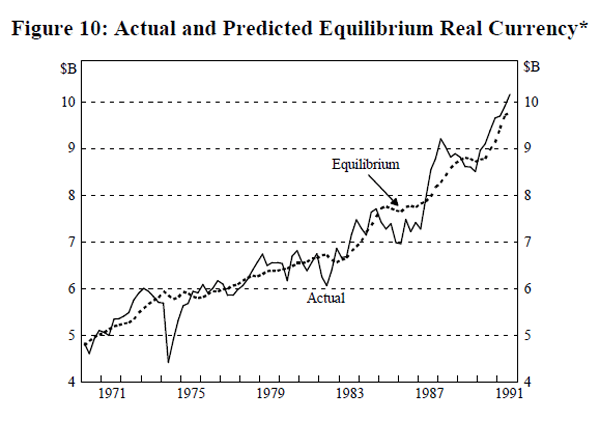
* The equilibrium value is based on the estimated long run equation: log real currency = − 4.68 + 1.3129 log real PFD − 0.0255 bill rate. The long-run constant is calculated as the average value of the log of real currency less 1.3129 times the average of the log of real PFD plus 0.0255 times the average bill rate from the first quarter of 1970 to the third quarter of 1991.
Footnotes
The critical statistics are drawn from the standard t-statistic tables with a critical value for 60 degrees of freedom of 2.00 at the 5 per cent level and 2.66 at the 1 per cent level. [8]
Lim and Dixon (1991) test for the long-run relationship using twelve years of data but have stated in correspondence that this result holds for the sample period used in our paper in both log and natural number form. They use seasonally-unadjusted data without seasonal dummies and argue that the periodic or seasonal patterns of transactions dominate the relationship between currency and expenditure. The difficulty with this is that seasonal patterns net out over a year and should be stationary over time. [9]
There were 16 cases of cointegration for all the money base measures, 8 for currency, 3 for M3, 3 for break-adjusted M3, and 10 for broad money. [10]
The velocity of currency had been relatively stable over the past few decades until 1990/91 when currency holdings rose sharply in response to changes to taxation arrangements and crises in the Victorian non-bank financial sector. See ‘Recent Trends in Money and Credit’, Reserve Bank Bulletin, December 1991. [11]