RDP 9311: Agency Costs, Balance Sheets and the Business Cycle 4. Some Empirical Evidence
November 1993
- Download the Paper 115KB
4.1 Previous Empirical Research
Although research on the linkages between firms' financial structure and investment or output is in its infancy, a number of empirical studies have attempted to determine the strength and nature of the relationship. One of the most frequently tested implications of agency cost theory is that financing patterns vary across firms according to differences in the agency costs they face. A series of tests using data for US manufacturing firms, finds that investment is sensitive to financial factors, especially for firms that a priori are expected to face large agency costs.
Fazzari, Hubbard and Petersen (1988)[15] divide firms into those that retain a large part of their income, and those that pay-out large dividends. Their results show investment is particularly sensitive to cash flow for the group of firms that retain most of their income. Also, the inclusion of a ‘collateral’ variable has a significant positive effect on investment for small pay-out firms, but not for large pay-out firms. This is consistent with the importance of collateral reducing the agency cost problems for those firms that find outside funds difficult to obtain. Using the same data and methodology, Gertler and Hubbard (1988) find that these effects are asymmetric over the business cycle; changes in cash flow have a larger impact on investment in recession years. In a similar spirit to Fazzari, Hubbard and Petersen, Whited (1992) shows that financial distress variables are significant factors in explaining investment, especially for firms without a corporate bond rating.
Similarly, Oliner and Rudebusch (1989) find that young firms' cash flow has a stronger effect on investment than is the case for mature age/low agency cost firms. They also suggest that firms whose managers have relatively little equity in the firm face higher agency problems. However, contrary to expectations, regression results do not indicate such a relationship.
Whited (1991) examines whether a firm with poor financial health will postpone investing until it can rebuild its financial asset base. Eckstein and Sinai (1986) have labelled this process ‘reliquefication’ and suggest that it occurs during recessions and early in recoveries. In terms of the multi-period model developed by Gertler (1992), the firm, by retaining earnings, increases its collateral and thus reduces the agency cost premium on external funds. The model developed in Section 3 suggests that demand factors are also important. As the firm becomes more financially fragile, risk averse managers become increasingly concerned about bankruptcy. Consequently, managers attempt to ‘reliquefy’ before initiating investment projects. Results using data from a panel of manufacturing firms show that for the sub-sample of firms that rely on external funds for investment, there is a significant positive relationship between lagged financial assets and investment. Also, the accumulation of financial assets tends to last approximately 2 years before investment occurs.
Other papers have examined the role of credit market imperfections in the monetary transmission mechanism. Gertler and Gilchrist (1991) suggest that small manufacturing firms are more likely to experience financial constraints than large manufacturing firms. They find that following a tightening of monetary policy, the sales of small manufacturing firms decline at a faster pace than those of large firms. Kashyap, Stein and Wilcox (1991) suggest that changes in the mix on bank loans and commercial paper are a proxy for credit supply. During recessions, tight monetary policy causes banks to decrease loan supply. Some businesses substitute towards the commercial paper market, but this substitution is imperfect, and thus the shift towards commercial paper predicts a fall in investment. Regression results confirm this prediction. Bernanke (1990) finds that the interest rate spread between the commercial paper rate and the rate on treasury bills is a good indicator of monetary policy. Consistent with this finding, Gertler, Hubbard and Kashyap (1990) derive a model of capital market imperfections and argue that interest rate spreads can proxy agency costs. An investment equation, modified for inclusion of the interest rate spread, is estimated and shows that the spread is important in explaining investment. Finally, Bernanke and Campbell (1988), Bernanke, Campbell and Whited (1990), and Warshawsky (1991) document the large rise in corporate indebtedness in the US over the 1980s, and express concern about the potential financial distress of many corporations in the event of recession.
4.2 Some Empirical Evidence for Australia
Compared to the US, relatively little work has been undertaken in Australia on the relationship between corporate equity and the business cycle. While there is considerable anecdotal evidence supporting the notion that both supply and demand factors have contributed to the recent slow growth in credit, it is difficult to find any empirical evidence on this issue.
In an attempt to redress this imbalance, we empirically investigate factors that influence the supply of finance. We begin by reviewing changes in the balance sheets of banks and corporations, and the effect that these changes have had on the cost of funds and on corporate bankruptcies. We then address the question of whether changes in corporate equity effect the availability of finance.
4.2.1 Debt, Balance Sheets and Asset Inflation
As in the US, Australian corporations experienced a significant increase in their debt to asset ratios over the 1980s. Graph 1 illustrates this increase in gearing using two different definitions of debt and two different data sets. The line beginning in 1973 uses data from Lowe and Shuetrim (1992), and presents the aggregate debt to asset ratio for 66 listed and unlisted companies. Here, the definition of debt is quite broad, as it includes all non-equity sources of finance. The line beginning in 1982 shows the debt-asset ratio for 80 companies calculated from the STATEX database where debt has been defined as the sum of short term securities, long-term securities, loans and bank overdraft.[16] Both measures show significant increases in leverage over the 1980s.
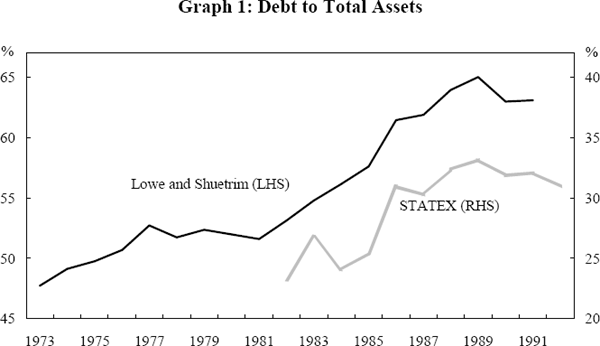
There are now numerous studies that attempt to explain why corporate debt increased to this extent.[17] Lowe and Shuetrim (1992) suggest that, on the supply side, the rise in corporate indebtedness was associated with financial deregulation and a desire by banks to increase market share, and a relaxation of credit control standards. On the demand side, increasing real asset prices and a growing economy meant that firms were keen to take advantage of the increased ability of banks to lend.
Since 1988/89, the debt to asset ratio appears to have fallen. In fact, Mills, Morling and Tease (1993a) find that firms have been restructuring their balance sheets to reduce their debt exposure since 1989/90. Debt raisings have been declining since 1989/90, and were negative in 1991/92.
As mentioned, the increased corporate indebtedness coincided with increasing real asset prices. In particular, the price of shares and property increased significantly. To some extent, corporations may have increased their borrowings on the basis of increased real asset values. The relationship between debt and asset prices can be seen in Graph 2. It shows the real share price index and a real property price index over the period from December 1976 to September 1992. In addition, it shows an index of business credit outstanding scaled by population.[18] All indices are based in 1984/85=100.
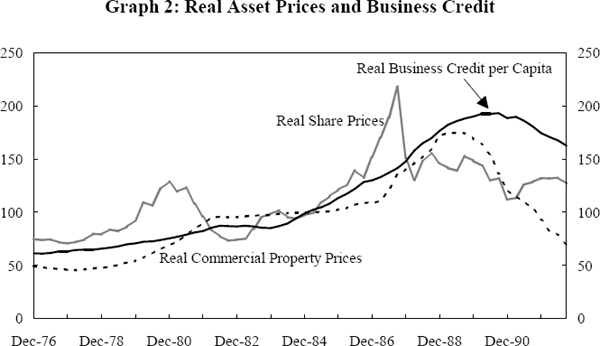
During the period from 1983 to 1989, real business credit per capita grew much faster than had previously been the case. This was associated with increases in the real price of commercial property and the real price of shares. This increase in asset values meant that in many cases the book value of equity was considerably less than the market value of equity. As a consequence, the growth of debt broadly matches the growth of equity, and thus the ratio of debt to assets, measured at market value, does not show an upward trend.[19]
In contrast, the period since 1989 has seen real business credit per capita, real share prices and real property prices fall. The decline in commercial property prices has been particularly pronounced; our real price index has fallen to the level of the early 1980s. For firms that had considerable commercial property assets, this fall in prices has represented a dramatic reduction in equity. For firms that borrowed heavily on the basis of expected asset price increases similar to those of the 1980s, this fall in asset prices has been particularly burdensome.
The increased debt to asset ratios need not make firms financially fragile if they are able to raise equity finance. However, Mayer (1990), using financial flow data for the US, Canada, France, Germany, Japan, UK, Italy and Finland, observes that in none of these countries do firms raise a substantial amount of funds from security markets. Security raisings as a share of total finance range from a high of 19 per cent in Canada, to a low of 3 per cent in Germany. Retained earnings are by far the predominant source of finance for capital expenditure and bank finance is the dominant source of external finance for firms in most countries. Also, Mayer notes that small companies are more reliant on bank finance than are large companies. This is also the case in Australia. The Bureau of Industry Economics (1991) surveyed a number of small business firms and found that approximately 35 per cent of firms nominated existing or new shareholders or partners as a source of funds. The lack of equity finance could be related to the cost of issuing equity. Woo and Lange (1992) estimate that the transaction cost of an equity float for a raising of less than $500,000 is about 17.4 per cent, but for raisings in excess of $100 million is only 3.75 per cent. Equity constraints appear to be significant for many firms, and are especially important for many smaller firms.
Given these equity constraints, lower cash flows, arising from (say) an economy wide reduction in demand, reduce internal funds available to meet the debt obligations, and cause a deterioration in firm collateral. The higher the initial debt-equity ratio, the greater the probability that this deterioration will lead to bankruptcy. That this has been the case in Australia is suggested by Graph 3 that shows corporate liquidations and growth in real GDP per capita over the last two decades.[20]
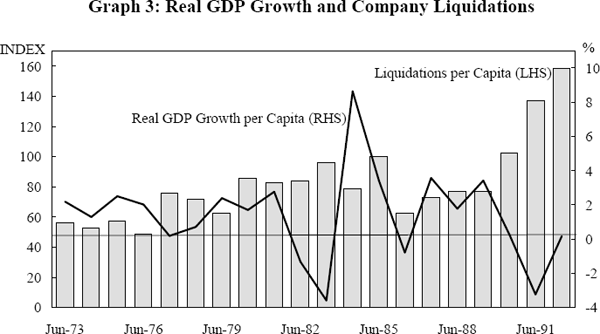
Although the recessions of 1982–83 and 1990–91 appear to be of about the same degree of severity, the number of corporate liquidations in the current recession is about 80 per cent higher than the liquidations in the recession of 1982–83. Measured on a per capita basis, the number of liquidations is roughly 60 per cent higher. To some extent, the increase in the number of liquidations reflects the higher debt levels at the beginning of the 1990/91 recession compared to the 1982/83 recession.
This relationship between debt levels and defaults is not peculiar to Australia. Davis (1992) tests directly for the effects of debt ratios on bankruptcy in a number of countries. For the US, Canada, UK and France, he finds a positive and significant relationship between corporate debt levels and defaults. Germany shows a positive but insignificant correlation, while Japan shows a negative relationship. Also, there are strong cyclical effects on defaults for all countries except Japan.
The increased probability of financial failure has led companies to restructure their balance sheets to reduce debt levels.[21] Given the equity market is not a source of funds for many companies, this requires using cash flow and retained earnings. As a consequence, funds available for investment are reduced. Some commentators have indicated that this is a factor in limiting investment during the current cycle. Stutchbury (1992) comments that in Australia, as in the US, there has been an ‘expansion hesitancy’ by borrowers who want to reduce their gearing, and lenders who want to minimise their bad loan portfolio. In terms of the model developed in Section 3, managers are hesitant to undertake new investment projects when the firm has high debt levels, because the risk of bankruptcy is relatively high. The fact that equity markets are a limited source of finance for many firms means that managers must rely on the firm's retained earnings to rebuild their balance sheets. As discussed in Section 3, this delays investment decisions.
The counterpart of the rise in corporate liquidations during the current recession is the rise in bank bad and doubtful debts. Total non-performing loans in June 1990 were roughly $15 billion, and rose to $28.5 billion in June 1991; a rise of 90 per cent. In terms of a share of total assets, non-performing loans amounted to 2.9 per cent of assets in June 1990 and rose to a maximum of 5.9 per cent in March 1992. Since then, there has been a slight decline in non-performing loans.[22]
As outlined in Section 2.2, the banks' financial health has implications for the macroeconomy. Shocks to banks' net worth can lead to a reduction in lending and, because some firms are equity constrained, ultimately to a reduction in investment. Graph 4 presents the ratio of total debt of Australian banks (measured by total liabilities) to the banks' total domestic assets over the period January 1973 to October 1992.
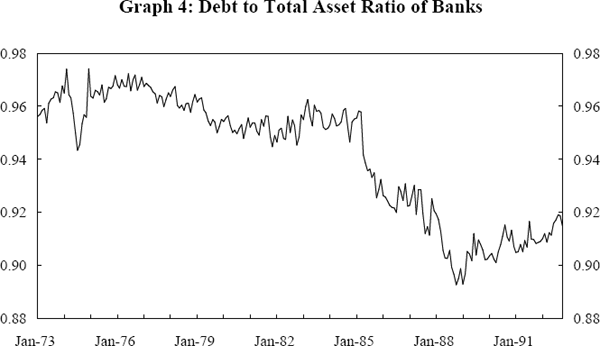
Between 1973 and 1983, the ratio of debt to total assets averaged approximately 96 per cent. However, over the 1980s, when corporations were increasing their level of indebtedness, the banking sector was decreasing its indebtedness. As a whole, banks engaged in large capital raisings, largely to fund balance sheet expansion but also in response to the BIS risk-based standards. Levonian and Gizycki (1992) point out that part of the decline in the debt to asset ratio during the mid 1980s can also be attributed to the entry of new banks with low ratios of debt to assets.
Since 1989, there has been a slight rise in the debt to asset ratio. However, the Reserve Bank (1993) notes that if a risk-weighted measure of assets is used, along with the banks' global balance sheets, then the trend in the capital ratio since September 1989 has generally been upward. In short, there does not appear to be a bank capital shortage in Australia. In contrast, Bernanke and Lown (1991) argue that the most important factor in the reduction of loan supply in the US. during the 1990/92 recession is the shortage of bank equity capital, arising from a write down of loans.
4.2.2 The Cost of Funds
The theory of asymmetric information outlined in Section 2.1 suggests that a firm's internal net worth may become a critical determinant of the terms under which it can borrow. That is, the firm's net worth, or collateral value, is important for reducing agency costs arising from incomplete information between lender and borrower. At the beginning of the current recession, debt-equity ratios were high by historical standards. While many companies have reduced gearing over recent years, improvements in firm collateral have been hampered by falling real asset prices. High debt-asset ratios, coupled with falling asset prices, are exactly the conditions under which agency costs are predicted to be the most severe. These costs should be reflected in a leftward shift of banks' supply curve of funds.
In addition, the model presented in Section 3 suggests that after a firm makes a considerable loss, management is less willing to undertake risky investment. The insights of this model can also be applied to the banking industry. Following losses, bank management may be less willing to undertake risky projects (ie., commercial lending). Instead, they may prefer to undertake safer projects (ie., housing lending) to reduce the variance of future expected returns.
One way of capturing the premium on corporate loan rates is to compare the corporate loan rate with the banks' marginal cost of funds. Following Lowe and Rohling (1992), we use the large business indicator rate on variable rate loans as a measure of the lending rate and the certificate of deposit rate as a measure of the banks' marginal cost of funds. The interest rate margin shown in Graph 5 is the difference between these two rates.
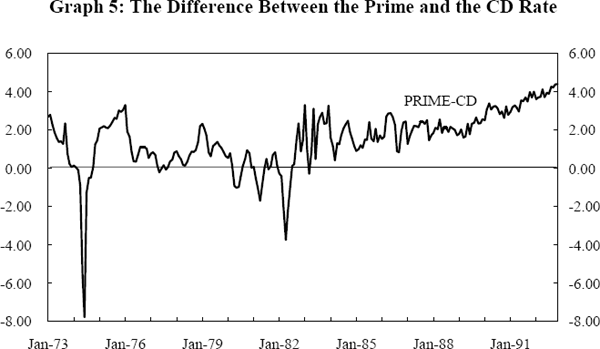
This difference between the prime rate and the CD rate is now higher than at any time since deregulation. In January 1993, the margin was approximately 4.5 per cent, considerably higher than it was in the 1982–83 recession, when the margin reached its maximum of 3.3 per cent. This increase in margins has coincided with falling asset prices, which is consistent with models presented in Section 2. While there is little evidence to support the hypothesis that reductions in bank share capital have reduced loan supply, the occurrence of increasing margins and falling asset prices suggests some support for the view that reduced collateralization has made external funding relatively more expensive. If this hypothesis is correct, a sustained recovery, associated with some recovery in asset prices, should see the margin narrow.
Blundell-Wignall and Gizycki (1992) point out that the interest rate margin is an imperfect measure of the risk premium, as it may be affected by other factors. Among these factors is the increase in the cost of traditional deposits following deregulation. As the average cost of deposits has increased, the margin between lending rates and the wholesale deposit rate might be expected to widen if banks are to maintain the same return on capital. In addition, changes in interest margins are affected by changes in operating costs and fee income. Thus, to gain further insight into shifts of the supply of credit curve, we now turn to alternative measures.
4.2.3 The Difficulty of Obtaining Finance
Blundell-Wignall and Gizycki (1992) examine the determinants of credit supply in the Australian economy. They estimate a simultaneous supply and demand model for Australian business credit and find that the market for credit was roughly in equilibrium since 1984. They conclude that there is no evidence of credit rationing, but do find that corporate net worth is an important factor in the supply function.
Another measure of supply can be obtained from the Australian Confederation of Commerce and Industry and Westpac Banking Corporation (ACCI-Westpac) survey of manufacturers. The quarterly survey asks respondents two pertinent questions related to credit supply. The first is ‘What single factor is most limiting your ability to increase production?’. The second question asks, ‘Do you find it is now harder, easier, or the same as it was three months ago to get finance?’ Although these questions do not measure credit supply directly, they provide some information about conditions under which firms feel credit is being made available. The response to the first question is shown in Graph 6. It shows the percentage of firms that report that finance is the single most important factor limiting current production. It also shows the percentage that answer labour, orders and ‘other’.
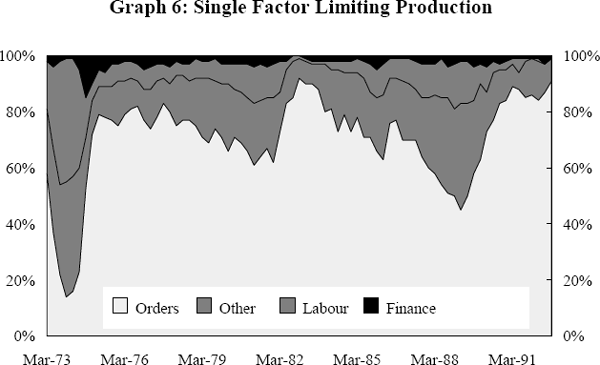
The ‘availability of finance’ is dominated by other factors as the principal factor constraining current production. Generally, orders are the most important single constraint on current production. The maximum share of firms that report that finance is the major limiting factor is only 15 per cent. This was during the ‘credit crunch’ period of 1974. On average, over the 1980s, only 2.2 per cent of firms said that finance was the major factor limiting production.
However, any supply constraints might be expected to impact more severely on investment than working capital used to finance current production. The response to the second question is more general, and may reflect the availability of credit for a number of purposes. Before examining this question, it is important to note that the survey has a number of limitations. First, the respondents are only manufacturing firms, and thus capture only part of total investment. Second, there is no way of measuring the degree of difficulty of obtaining finance: the question only asks whether it is easier or more difficult, not how much easier or more difficult. Third, since large firms receive the same weight as small firms, the response to this question can potentially be dominated by a large number of small firms. However, even with these shortcomings, the question does address potential supply side constraints on obtaining finance.
The share of managers that responded that finance was easier to obtain than it was three months ago, as well as the share that reported ‘no change’ and ‘harder’ is shown in Graph 7, along with the 90 day bank bill rate.
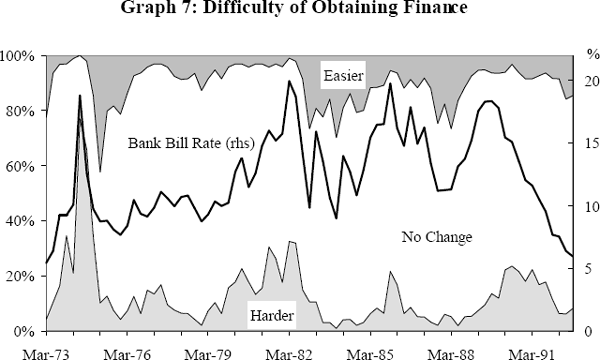
In the majority of quarters, most firms reported no change in their ability to obtain finance. However, there were periods when a significant number of managers found finance more difficult to obtain. For example, during the credit squeeze of 1974, the share of managers that found credit harder to obtain rose to 74 per cent while no managers found credit easier to obtain. This contrasts with managers' reactions to the first question, where only 15 per cent of respondents felt finance was the single most important factor limiting production during this period.
The relationship between the perceived availability of finance and the 90 day bank bill rate is quite close through the 1980s. Periods of perceived increasing credit tightness correspond closely to periods of high interest rates. However, as noted by the Bureau of Industry Economics (1991), the relationship between interest rates and the availability of finance deteriorates towards the end of the 1980s. As interest rates were reduced, business did not report any easing of credit supply conditions. One factor that may explain this deterioration in the relationship is the increased importance of corporate net worth in credit supply decisions. The increased indebtedness of firms at the outset of the recession may have led to an inward shift of the supply curve as the economy began to slow and asset prices fell.
Macfarlane (1990) notes that banks were willing suppliers of credit during the years when asset prices were rising, as this was proving profitable for both borrowers and lenders. Conversely, in periods when asset prices are falling, the willingness of lenders to supply funds may be reduced. In order to gauge the importance of asset prices on credit supply, we utilise the aggregate asset price index constructed by Blundell-Wignall, Lowe and Tarditi (1992). The index is a weighted average of three asset price indices; the share market index, the housing price index and commercial property price index. Further details can be found in the Data Appendix. Annual percentage changes in the index are graphed along with the ACCI/Westpac survey ‘net balance’ measure of changes in the availability of credit. The net balance is the difference between the share of respondents that report credit is harder to obtain and the share that reports that credit is easier to obtain.
The relationship between the availability of finance and asset prices might be expected to have changed following financial deregulation. Before deregulation, it is likely that credit constraints were induced by regulations rather than considerations of corporate net worth. Financial deregulation occurred gradually over a number of years, and there is no natural break between the regulated period and the deregulated period. We arbitrarily choose the first quarter of 1983 to denote the change in regime. Graph 8 shows the relationship between asset price inflation and the difficulty in obtaining finance.[23]
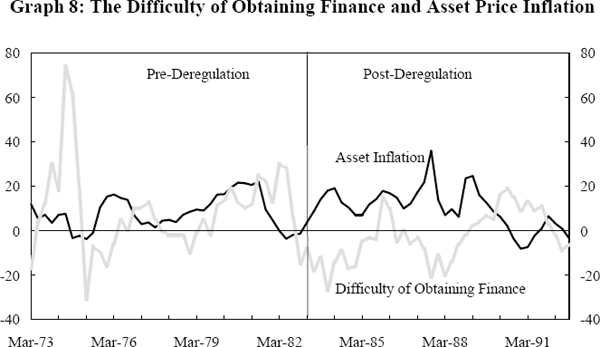
Prior to financial deregulation, the relationship between the difficulty of obtaining finance and asset inflation was positive for the most part; that is, stronger asset growth was associated with tighter credit conditions. At first glance this seems to be counter-intuitive, as agency cost theory suggests strong asset growth should be associated with easier credit. One explanation is that asset price inflation often occurs in periods of economic expansion. Prior to deregulation, when the economy was growing strongly, the demand for credit rose. However, because of disequilibrium credit rationing, credit became more difficult to obtain. Regulations during this time put quantitative restrictions on banks' lending. Explicit ceilings on the growth of trading bank credit were imposed as were controls on interest rates that could be paid and received. In this environment, banks became ‘passive allocators of the funds which depositors put with them’ (Grenville 1990). When asset prices increased, the queue of borrowers simply lengthened.
A strikingly different relationship is evident after deregulation. Asset price inflation now appears to be negatively correlated with the difficulty of obtaining funds. As agency theory predicts, periods of strong asset growth are associated with easier credit conditions, as financial institutions perceive investment projects to be backed by a higher value of actual and expected collateral.
The above suggests that interest rates and asset price inflation influence managers' perceptions of the difficulty of obtaining finance. However, agency cost theory predicts another potential influence on the supply of credit. As described in Section 2.2, Gertler (1992) points out that in a multi-period setting, the availability of finance is also determined by expected general business conditions. This is because expected business conditions affect the expected ability of the firm to service its debt. If conditions are expected to be good, agency costs will be lower than otherwise, and banks will be willing to extend finance on more favourable terms. The ACCI-Westpac survey attempts to measure the expected economic outlook with the question, ‘Do you consider that the general business situation in Australia will improve, remain the same, or deteriorate during the next six months?’
Graph 9 shows the relationship between the availability of finance and expected general business conditions, also measured as the net balance (the proportion of respondents that believe conditions will improve less that proportion that believe they will deteriorate).
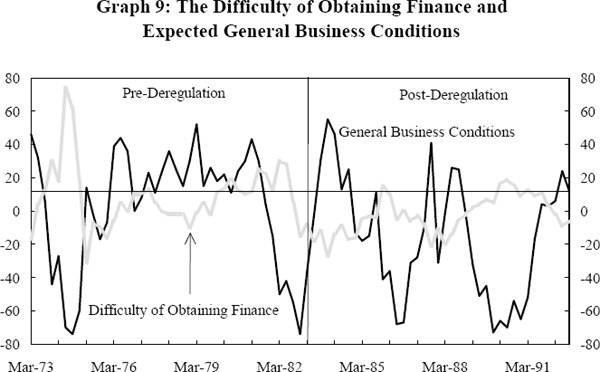
In the period before deregulation, the relationship was for the most part positive; the one notable exception was the 1974 credit crunch. As for the relationship of asset inflation and the availability of finance, this positive relationship suggests that credit rationing became more severe as economic conditions improved. In the period since deregulation, the relationship changes; the difficulty of obtaining finance is now negatively related to expected general business conditions. It seems clear that when the economy is expected to improve, finance is perceived to be easier to obtain. This provides some support for the theoretical prediction of the multi-period contract model of agency costs developed by Gertler (1992).
4.2.4 Estimation Results
The above graphs suggest that interest rates, asset price inflation and general business conditions each have an impact on the difficulty of obtaining finance. However, as these three variables are likely to be correlated, it is not possible to determine their individual independent effects from the graphs. Perhaps the important factor determining both the availability of finance and asset price inflation is expected business conditions, since an expected improvement in business conditions might make finance easier to obtain and increase asset prices. In an attempt to isolate the independent effect of each of the variables, we use regression techniques. Specifically, we regress the difficulty of obtaining finance on the prime interest rate, asset price inflation and expected general business conditions. This allows us to determine whether an increase in asset prices, independent of a change in expected business conditions, has an impact on the availability of obtaining finance.
The ACCI-Westpac survey is conducted over a three week period ending in the middle of the last month of the quarter. For example, the survey for the June quarter is conducted over the last week in May and the first two weeks of June. Given this timing, it is not possible to include, as a regressor, asset price inflation through the end of June, as this variable may be endogenous. It is possible that easier credit conditions over the months of April and May may themselves result in an increase in asset prices. To remove any possibility of endogeneity, we use the rate of asset price inflation lagged one quarter.
To gauge the robustness of the effect of collateral on the availability of finance, we also examine whether corporate net worth affects firms' perception of the availability of finance. Our proxy for net worth is the ratio of the market capitalisation of listed equities on the Australian Stock Exchange to business credit. A priori, agency theory predicts that the higher the firm's equity to debt ratio, the easier the availability of credit. The regression using this variable is estimated over a smaller sample since business credit is available only from December 1976. This variable is also lagged one quarter. The regressions are also conducted separately using the nominal and real prime rate. The regression results for the pre-deregulation period are reported in Table 1 and those for the deregulated period in Table 2.
| Sample | 75:1–83:1 | 76:4–83:1 | 75:1–83:1 | 76:4–83:1 |
|---|---|---|---|---|
| Constant | −15.47 (−0.74) |
−43.95 (−2.77) |
4.87 (2.01) |
−33.54 (−3.47) |
| Real Asset Inflation (Lagged) |
1.11 (4.01) |
… |
0.90 (3.04) |
… |
| Equity/Debt Ratio (Lagged) |
… |
32.95 (3.44) |
… |
36.87 (4.13) |
| Prime Rate | 1.84 (1.20) |
1.32 (0.99) |
… |
… |
| Real Prime Rate | … |
… |
1.36 (2.09) |
0.76 (0.59) |
| General Business Conditions (6 months) |
−0.07 (−0.49) |
−0.02 (−0.14) |
−0.08 (−0.70) |
−0.07 (−0.70) |
 |
0.44 | 0.36 | 0.50 | 0.35 |
| Number of Observations | 33 | 26 | 33 | 26 |
| Note: t statistics are reported in parentheses below coefficient estimates. The standard errors have been calculated using the Newey-West estimator using 3 lags. | ||||
| Sample | 83:2–92:3 | 84:2–92:3 | ||||||
|---|---|---|---|---|---|---|---|---|
| Constant | −17.27 (−1.54) |
2.52 (0.16) |
−30.03 (−9.22) |
−20.61 (−2.64) |
−33.11 (−3.03) |
13.04 (0.92) |
−34.17 (−5.57) |
−15.07 (−0.76) |
| Real Asset Inflation (Lagged) | −0.48 (−3.21) |
… |
−0.45 (−4.01) |
… |
−0.70 (−4.37) |
… |
−0.44 (−2.63) |
… |
| Equity/Debt Ratio (Lagged) | … |
−10.40 (−2.37) |
… |
−6.45 (−1.80) |
… |
−20.14 (−4.33) |
… |
−7.49 (−1.18) |
| Prime Rate | 0.85 (1.19) |
0.29 (0.39) |
… |
… |
2.36 (4.23) |
1.73 (2.93) |
… |
… |
| Real Prime Rate | … |
… |
3.08 (7.25) |
2.74 (4.50) |
… |
… |
4.20 (7.76) |
3.75 (3.48) |
| General Business Conditions (6 months) | −0.19 (−4.14) |
−0.21 (−4.08) |
−0.09 (−3.09) |
−0.10 (−2.67) |
… |
… |
… |
… |
| Forecast of Non-farm GDP (5 years) | … |
… |
… |
… |
−1.05 (−0.52) |
−5.69 (−2.61) |
−1.68 (−0.84) |
−4.12 (−1.81) |
|
|
0.59 | 0.55 | 0.79 | 0.72 | 0.47 | 0.49 | 0.70 | 0.62 |
| Number of Observations | 38 | 38 | 38 | 38 | 34 | 34 | 34 | 34 |
| Note: t statistics are reported in parentheses below coefficient estimates. The standard errors have been calculated using the Newey-West estimator using 3 lags. | ||||||||
The results of the regressions in Table 1 confirm a number of observations that were suggested in the previous section. First, in all four regressions, the ‘collateral’ variable (asset inflation or the equity to debt ratio) is positively and significantly related to the difficulty in obtaining finance. As suggested by Graph 8, prior to deregulation, increases in asset prices were associated with an increase in the perceived difficulty of obtaining finance. This again suggests that disequilibrium credit rationing was taking place. As asset prices increased, or corporate net worth improved, the queue of borrowers became longer and finance became more difficult to obtain.
Second, the prime rate is positively related to the difficulty in obtaining finance in all regressions, whether measured in nominal or real terms. However, it is statistically significant only in the regression using the real prime rate and asset price inflation. Third, there is no significant relationship between the expectation of improvements in general business conditions and the difficulty of obtaining finance.
The results for the post-deregulation period are reported in Table 2.
The first four columns of Table 2 report the results estimated over the post-deregulation period using the same model specifications as for the pre-deregulation period. In all four regressions, the difficulty of obtaining finance is negatively and significantly related to the various measures of corporate net worth.[24] This implies that increases in asset prices, or increases in equity, generate perceptions that credit is easier to obtain. Note that this is the case even when we control for expectations concerning business conditions. It suggests that if asset prices increase for reasons not associated with the business cycle, finance becomes easier to obtain. This provides some support for the models that link collateral to the conditions under which finance is made available.
As in the period before deregulation, the coefficients on the nominal and real prime rates are positive, indicating that as interest rates rise, business perceives that finance is more difficult to obtain. However, the coefficient is not statistically significantly different from zero in the regressions using the nominal prime rate, but is significant in the regressions using the real prime rate.
In contrast to the pre-deregulation period, the coefficient on the expectation of improvements in general business conditions is negative and statistically different from zero. As business conditions improve, firms find that finance is easier to obtain.
One potential problem with using the ACCI-Westpac ‘expected general business conditions’ variable in the above regression equations, is that the forecasts relate only to the next 6 months. If managers believe that the economy is going to improve in the medium term, this may not be reflected in the forecasts for the next two quarters but may be reflected in asset prices; in particular share prices. In an attempt to control for longer-run expectations, we use the quarterly SYNTEC five year forecast of non-farm GDP. Since the five year forecasts are only available from June 1984, the sample period is restricted to 1984:2 to 1992:3. The regression results are reported in the last four columns of Table 2.
Overall, the fit of the regressions deteriorates somewhat when the 6 month forecasts
are replaced by the 5 year forecasts. For example, in the regression that uses
asset inflation as the collateral variable and the nominal prime rate, the
falls from 0.59 to 0.47. This suggests that
expected business conditions over the next six months have a more important
role in influencing credit supply conditions than expected longer-run business
conditions. Despite this, all variables retain their signs shown in the regressions
using the 6 month forecasts. The nominal prime rate, while insignificant in
the previous regressions, becomes significantly different from zero when the
five year forecasts are used as the measure of expected general business conditions.
Nevertheless, the fit of the equations using the real prime rate is considerably
better than those using the nominal prime rate.
The ‘collateral’ variable is negatively related to the difficulty of obtaining finance in all four regression equations using the 5 year forecasts, although the equity to debt ratio is insignificantly different from zero in the equation that includes the real prime rate. Even after controlling for improvements in general business conditions over the next five years, the difficulty of obtaining finance is negatively related to the net worth of firms. An increase in asset inflation or an increase in the equity to debt ratio, leads managers to report a decline in the difficulty of obtaining finance one quarter later. As in the previous regressions using the 6 month forecast, this result provides some support for the agency cost models that link collateral to the conditions under which finance is made available.
The coefficient on the five year forecast of economic conditions is negative in all three regressions, suggesting that as longer-run economic conditions are expected to improve, managers report finance is less difficult to obtain. However, this coefficient is only statistically significant in the regressions using the equity to debt ratio as the ‘collateral variable’.
Footnotes
See Mills, Morling and Tease (1993b) for a similar study using Australian data. [15]
Further details on these series can be found in the Data Appendix. [16]
See Dempster, Howe and Lekawski (1990), Stevens (1991), Macfarlane (1989, 1990) and Mills, Morling and Tease (1993a). [17]
Deriving business credit per capita abstracts from scale effects. [18]
This is noted in Lowe and Shuetrim (1992) and Dempster, Howe and Lekawski (1990). [19]
The construction of the corporate liquidation series is discussed in the Data Appendix. [20]
See Mills, Morling and Tease (1993a) for evidence. [21]
See the January 1993 Reserve Bank Australia Bulletin for more details. [22]
A positive value indicates finance is more difficult to obtain, negative values indicate finance is easier to obtain. [23]
The coefficient on the equity to debt ratio in the regression using the real prime rate is significant only at the 7 per cent level. [24]