Statement on Monetary Policy – May 2018 4. Inflation
Inflation remains low and stable
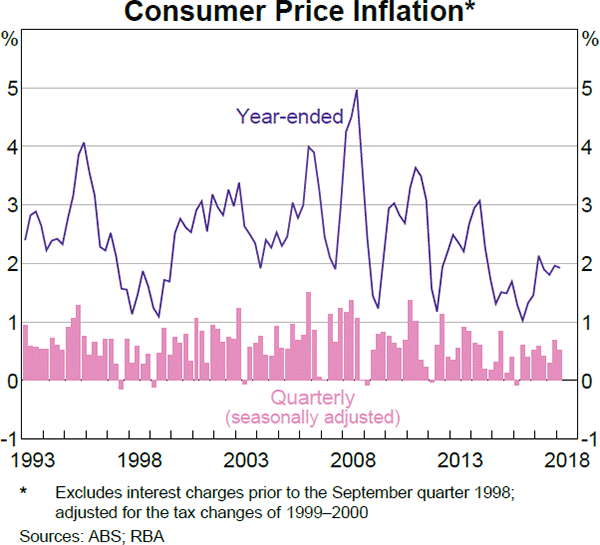
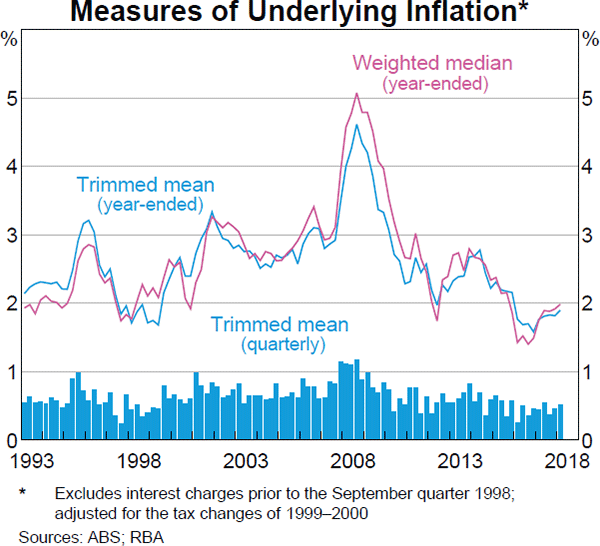
The March quarter inflation outcomes were broadly in line with the forecast in the February Statement on Monetary Policy and confirmed that inflation remains low but stable. The low inflation outcomes reflect spare capacity in the economy and the associated low wages growth, as well as the ongoing downward pressure on retail prices due to increased competition in the sector. Headline inflation was 0.5 per cent (seasonally adjusted) in the March quarter and steady at 1.9 per cent over the year (Table 4.1; Graph 4.1). Underlying inflation increased a little to be ½ per cent in the quarter and close to 2 per cent over the year (Graph 4.2).
| Quarterly(a) | Year-ended(b) | |||
|---|---|---|---|---|
| March quarter 2018 | December quarter 2017 | March quarter 2018 | December quarter 2017 | |
| Consumer Price Index | 0.4 | 0.6 | 1.9 | 1.9 |
| Seasonally adjusted CPI | 0.5 | 0.6 | ||
| – Tradables | 0.2 | 0.6 | −0.5 | −0.3 |
| – Tradables (excl volatile items)(c) | 0.0 | −0.6 | −0.9 | −1.0 |
| – Non-tradables | 0.8 | 0.7 | 3.1 | 3.1 |
| Selected underlying measures | ||||
| Trimmed mean | 0.5 | 0.4 | 1.9 | 1.8 |
| Weighted median | 0.5 | 0.5 | 2.0 | 2.0 |
| CPI excl volatile items(b) | 0.5 | 0.3 | 2.0 | 1.9 |
|
(a) Except for the headline CPI, quarterly changes are based on
seasonally adjusted data; those not published by the ABS are
calculated by the RBA using seasonal factors published by the
ABS Sources: ABS; RBA |
||||
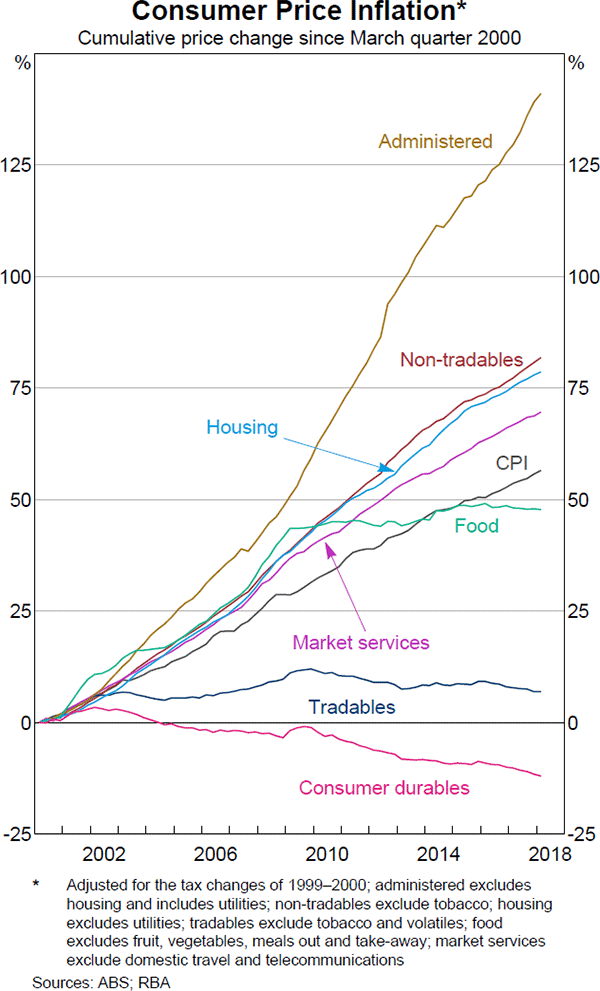
Over the inflation-targeting period, inflation in tradable items has tended to be lower and more volatile than inflation in the price of non-tradable items (Graph 4.3). Tradables inflation is heavily influenced by world prices and the exchange rate, whereas inflation in non-tradable items (such as housing, education and household services) is mainly driven by domestic developments. Over the longer run, the different inflation dynamics between the two also reflects productivity growth differences as well as a shift in consumer demand towards services (which tend to be non-tradable).
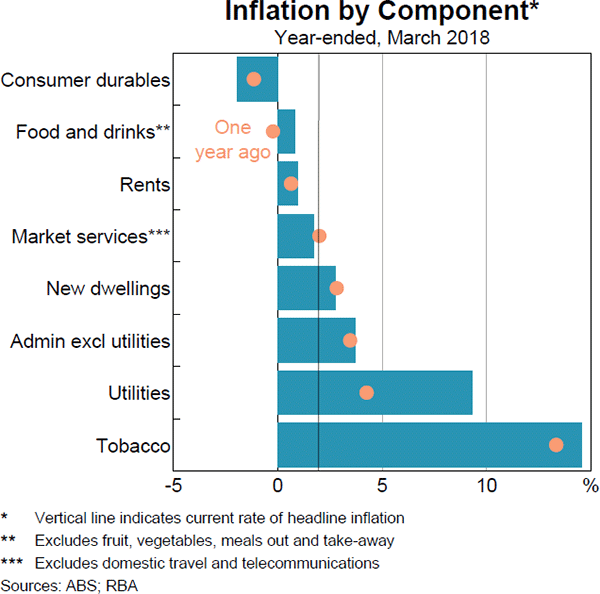
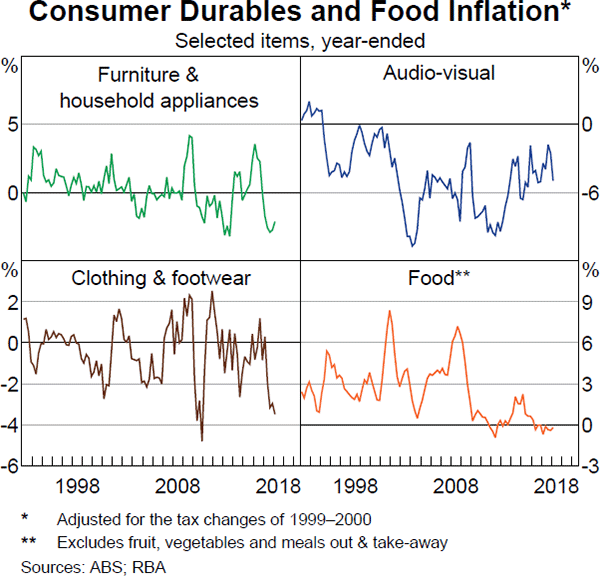
In recent years, the prices of tradable items have declined a little. The prices of grocery food (excluding fruit & vegetables) have been largely unchanged while the prices of consumer durables have declined (Graph 4.4). Non-tradable inflation has been a little lower than its long-run average, largely as a result of spare capacity in the economy and the associated low growth in labour costs (which are the largest component of business costs). However, it has increased over the past two years as a result of higher inflation in such components as tobacco, electricity and new dwelling costs. Over the past year, the share of items for which inflation has increased has been a little higher than the share of items for which inflation has declined.
Domestic price pressures remain subdued
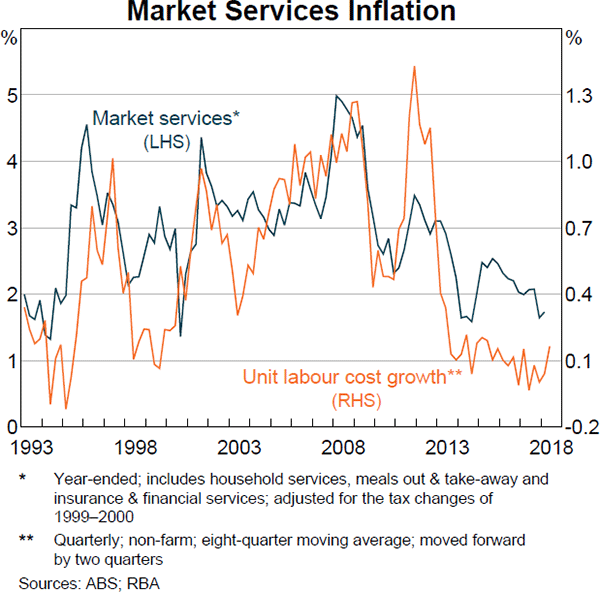
An important determinant of non-tradable inflation is growth in labour costs, which has been low in recent years (see below). This has contributed to the slowing in market services inflation (Graph 4.5). A number of one-off factors had also lowered market services inflation in recent quarters, such as the removal of ATM withdrawal fees and reforms to state-based compulsory third-party insurance schemes. Since 2014, there have been technology-driven price declines for telecommunications equipment & services.
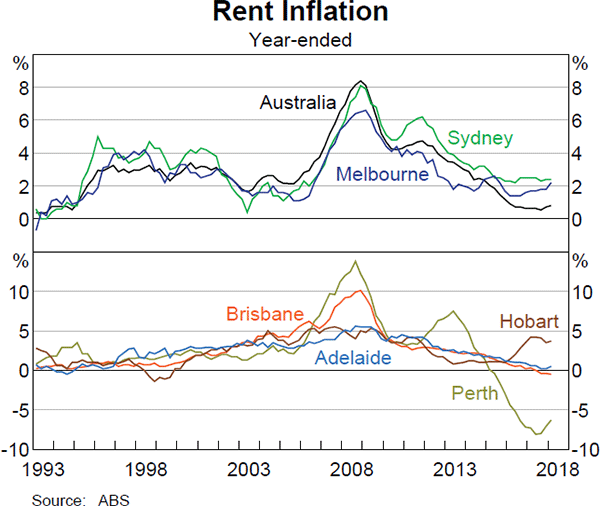
Other domestic price pressures remain subdued. Rent inflation, which is 7 per cent of the CPI basket, has increased a little over the past six months but remains low (Graph 4.6). Rents have been falling in Perth alongside low population growth and weaker economic conditions than in the other capital cities. However, rent deflation in Perth has slowed over the past year. Meanwhile, rent inflation remained steady in Sydney and has risen a little in Melbourne, because substantial additions to the dwelling stock have been absorbed by strong population growth.
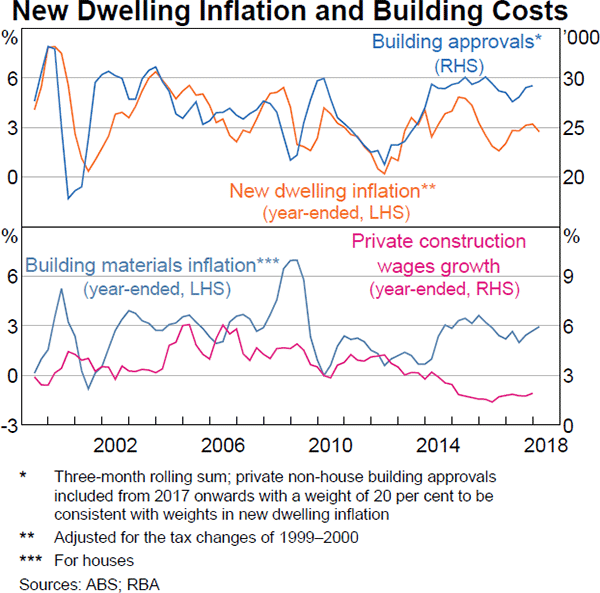
Price pressures in the costs of building a new dwelling have eased a little since early 2017 (Graph 4.7). Price growth has tended to be strongest in the eastern capital cities, where most of the new residential construction is occurring. The cost of building apartments has grown at a slower pace than the cost of building a house. Overall construction wages growth remains low, although reports from the Bank's liaison program indicate that shortages of specialised labour have translated into stronger price pressures for some firms.
Utilities price inflation has increased over the past year, contributing 0.4 percentage points to year-ended headline inflation (Graph 4.8). The increase in gas and electricity prices reflects the pass-through of an increase in wholesale prices, which rose over the past year in response to a decline in electricity generation capacity. In the March quarter, there were sizeable increases in Victorian electricity and gas prices. There is little evidence that businesses have passed on high utilities prices to consumers. Wholesale electricity prices have declined from the high levels reached in 2017.
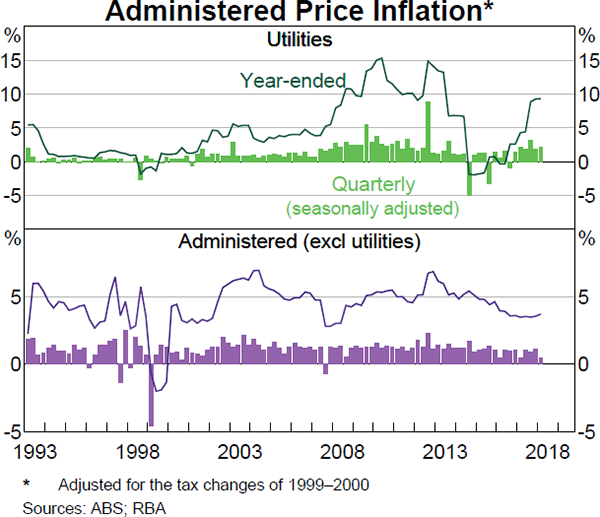
Inflation in other administered prices has been little changed over the past year. Labour costs are about two-thirds of the final price for the items in this group, which includes the price of health, transport, education and childcare services. Tobacco inflation remained elevated in the March quarter due to ongoing increases in the tobacco excise. After 2020, legislated tobacco excise increases will be smaller in size.
Retail competition continues to put downward pressure on consumer prices
The prices of tradable items (excluding volatile items) have declined by around 1 per cent over the year. Over the period, there was little change in the prices of grocery food (excluding the volatile fruit & vegetables component), while price falls in consumer durables have accelerated (Graph 4.9).
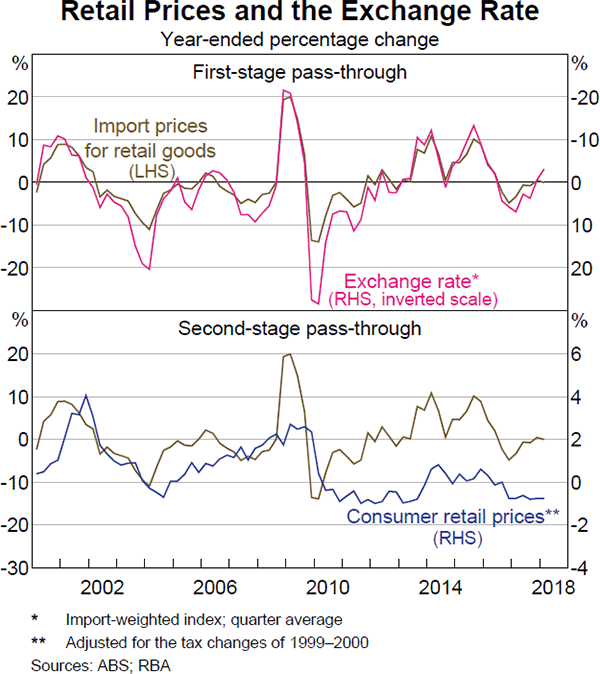
A couple of factors are contributing to ongoing retail price deflation. Firstly, firms have continued to adjust their pricing strategies in response to constrained retail spending and intense competitive pressures in the retail industry over recent years. Many retailers report they are transitioning to ‘everyday low price’ strategies, whereby prices are permanently lowered on a range of goods in an attempt to increase sales volumes. In addition, reports from liaison suggest that the frequency of discounting periods has increased and a larger number of products are being discounted than previously. Secondly, with the exception of higher utilities prices, retail input cost pressures have been low. Retail rent growth remains low, except for moderate rises in retail rents in the CBDs of Sydney and Melbourne. As discussed below, subdued labour cost growth is not contributing to a build-up of price pressures at present. Despite a modest depreciation of the import-weighted exchange rate over the past year, import prices have been little changed (Graph 4.10).
Wages growth has picked up a little, but remains low
Low wages growth over recent years has contributed to subdued inflation outcomes because wages are the largest component of business costs. There are a number of reasons for low wages growth: spare capacity remains in the labour market; inflation has been low and most parties expect it to remain so; and the economy has been adjusting to the end of the mining investment boom and the earlier terms of trade decline. Broader compositional changes in the labour market have also affected growth in labour costs. The Australian experience of low wages growth is common with a number of advanced economies, including some with tighter labour markets. This points to similar factors weighing on wages growth across a range of countries, such as changes in relative bargaining power and the effects of technological change and globalisation. Real wages in Australia have been relatively unchanged for a number of years.
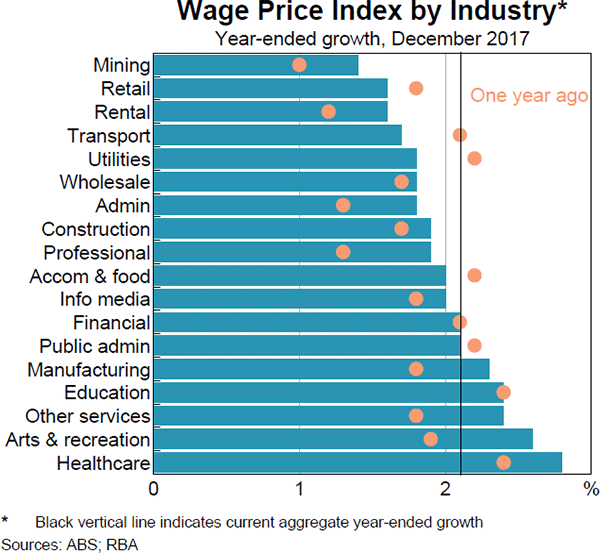
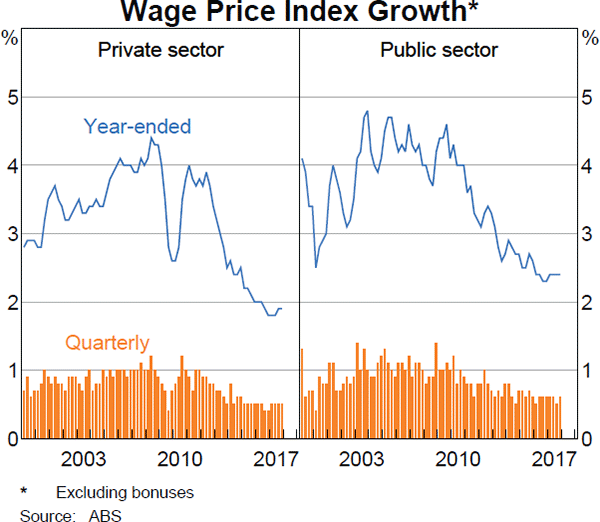
Growth in the wage price index (WPI) edged up to 0.6 per cent in the December quarter and 2.1 per cent over the year (Graph 4.11). Aggregate wages growth was boosted by the Fair Work Commission's decision to increase award and minimum wages by 3.3 per cent, effective from 1 July 2017. This flowed directly to around 20 per cent of all employees. However, even in industries with a relatively high share of employees on individual agreements, wages growth also picked up a little over the year. In particular, wages growth in mining-exposed industries stabilised or moved a little higher after a period of very low wages growth (Graph 4.12).
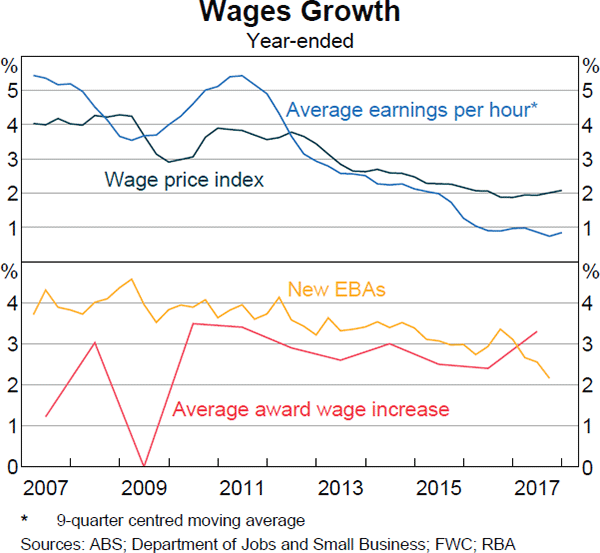
Public sector wages grew faster than in the private sector over the past year (Graph 4.13). This reflects the higher wages growth in industries such as health and education that have a higher share of public sector employment. The public sector also has a larger share of employees on enterprise bargaining agreements (EBAs). EBAs have an average duration of a little over three years. Average wages growth in new EBAs has declined over the year.
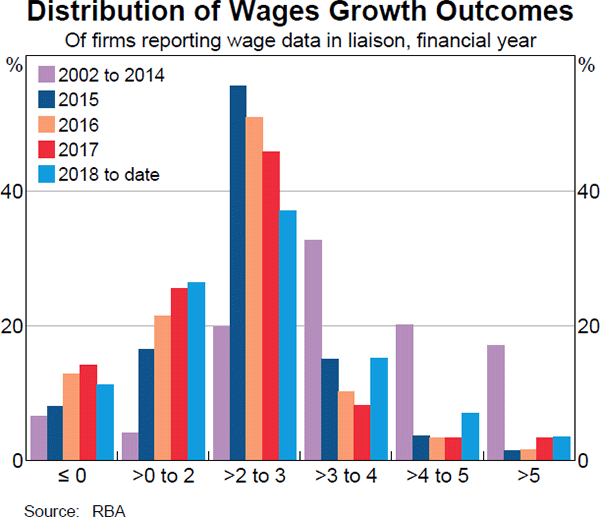
The majority of firms surveyed in the Bank's liaison program expect wages growth to remain broadly stable over the year ahead. This is also consistent with a survey of union officials. However, the share of surveyed firms that expect stronger wages growth in the period ahead has slowly trended higher. Around one-third of all firms reported wages growth of less than 2 per cent (including wage cuts) over the past year (Graph 4.14). A large share of reported wages growth outcomes remain around 2–3 per cent, which continues to suggest some anchoring around CPI outcomes and the Bank's inflation target. However over the past year, there has been a pick-up in the share of firms indicating wages growth outcomes in excess of 3 per cent. This reflects the increase to award and minimum wages during the year, as well as the impact of labour shortages in select occupations. Previous Bank research using micro WPI data showed that changes in the share of ‘large’ wage rises (more than 4 per cent) can have had a significant effect on aggregate wages growth.[1]
The share of workers changing employers has been at a low level in recent years, and the boost to earnings from changing jobs appears to have declined since the mining boom. However, more recently, there has been a small increase in the share of people who are expecting to voluntarily change or seek another job over the year ahead. There has also been an increase in the share of firms who are finding it difficult to find suitable workers.
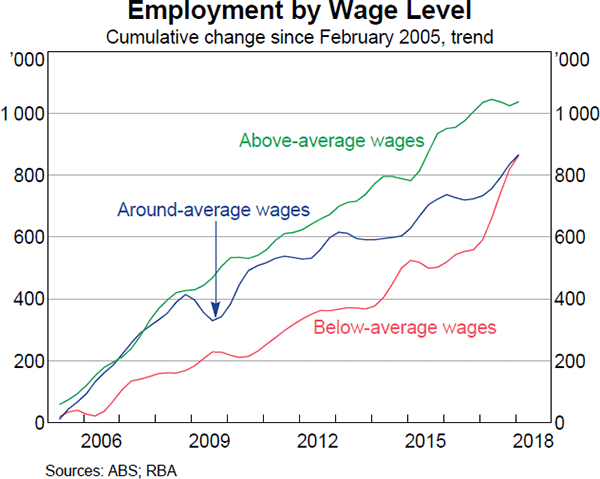
A broader measure of labour cost growth is average earnings per hour in the national accounts (AENA). AENA captures a wider range of labour earnings (non-wages costs) than the WPI, including allowance, superannuation and redundancy payments, as well as changes in the composition of employment. Growth in AENA has been weaker than in the WPI over recent years, in both goods-related industries such as construction, as well as in the household services sector. Within construction, this may reflect the slowing demand for construction workers on large-scale mining projects. Broader compositional changes in the labour market appear to also be weighing on AENA. For example, over the past year or so, employment growth has been strongest in those occupations with below-average rates of pay (Graph 4.15).
Inflation expectations are generally consistent with the inflation target
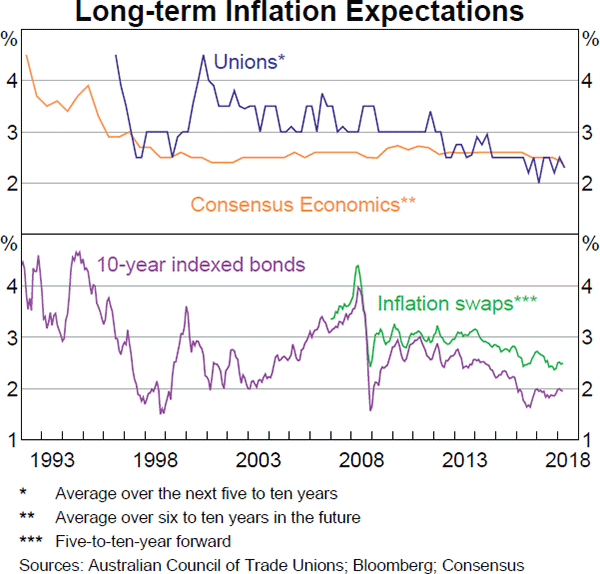
Measures of short-term inflation expectations are low, though they are higher than they were in 2016 (Graph 4.16). Market economists and unions expect inflation to be around 2¼ per cent over the next year. Survey measures of longer-run inflation expectations have edged a little lower but remain around 2½ per cent (Graph 4.17)

Footnote
See Bishop J and N Cassidy (2017), ‘Insights into Low Wage Growth in Australia’, RBA Bulletin, March, pp13–20. [1]