Statement on Monetary Policy – February 2018 3. Domestic Economic Conditions
Domestic economic conditions improved during 2017, supported by low interest rates and continued strength in the global economy. Mining activity added to growth, as did private non-mining business investment and spending on public infrastructure. In contrast, consumption grew only modestly, weighed down by slow income growth. Household income growth was weak despite rapid employment growth and a decline in the unemployment rate, because growth in average wages has remained low.
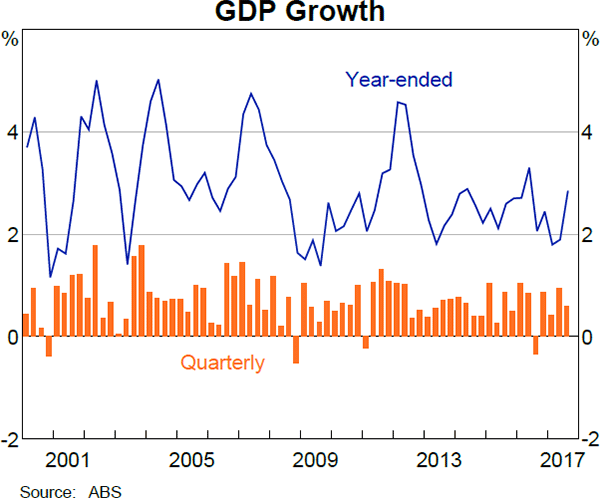
GDP growth was 0.6 per cent in the September quarter, and increased to be close to estimates of potential in year-ended terms (Table 3.1; Graph 3.1).
| September quarter 2017 |
June quarter 2017 |
Year to September quarter 2017 |
|
|---|---|---|---|
| GDP | 0.6 | 0.9 | 2.8 |
| Domestic final demand | 0.6 | 0.8 | 3.2 |
| – Consumption | 0.1 | 0.8 | 2.2 |
| – Dwelling investment | −1.0 | −0.5 | −2.3 |
| – Mining investment | 0.0 | −0.7 | 2.0 |
| – Non-mining investment | 2.7 | 0.9 | 9.5 |
| – Public consumption | 0.2 | 1.2 | 2.4 |
| – Public investment | 5.0 | 2.5 | 12.9 |
| Change in inventories(a) | 0.2 | −0.5 | −0.2 |
| Exports | 1.9 | 3.3 | 6.4 |
| Imports | 1.9 | 0.5 | 7.7 |
| Mining activity(b) | 0.8 | 1.5 | 4.4 |
| Non-mining activity(b) | 0.6 | 0.9 | 2.7 |
| Nominal GDP | 0.6 | 0.0 | 5.9 |
| Real gross domestic income | 0.5 | −0.4 | 5.0 |
| Terms of trade | −0.4 | −6.0 | 9.7 |
|
(a) Contribution to GDP growth Sources: ABS; RBA |
|||
Growth in business and public investment picked up in the quarter, but consumption growth was weak. The economy looks to have expanded at a broadly similar rate in the December quarter. Current indicators point to a recovery in consumption growth, but mining investment and net exports are expected to decline in the quarter. Over 2018, growth is expected to increase to be above potential. This should further reduce spare capacity in the economy and place some upward pressure on wage growth and inflation.
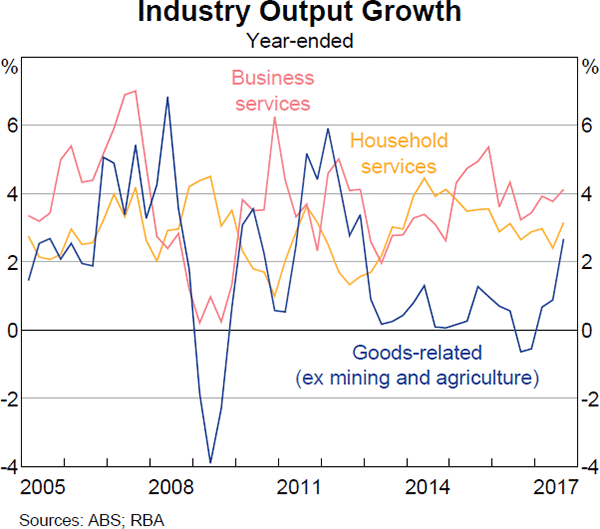
By industry, the pick-up in year-ended growth was largely attributable to the recovery of growth in goods-related industries, including construction and manufacturing (Graph 3.2). Both the recent increase in public infrastructure spending and stronger global demand for certain manufactured goods played a role here.
Over the past year, the economic performance of the states has tended to converge. In particular, conditions have improved in Western Australia, Queensland, South Australia and Tasmania, narrowing the difference with New South Wales and Victoria (see ‘Box B: The Recent Economic Performance of the States’ for details).
Mining Activity
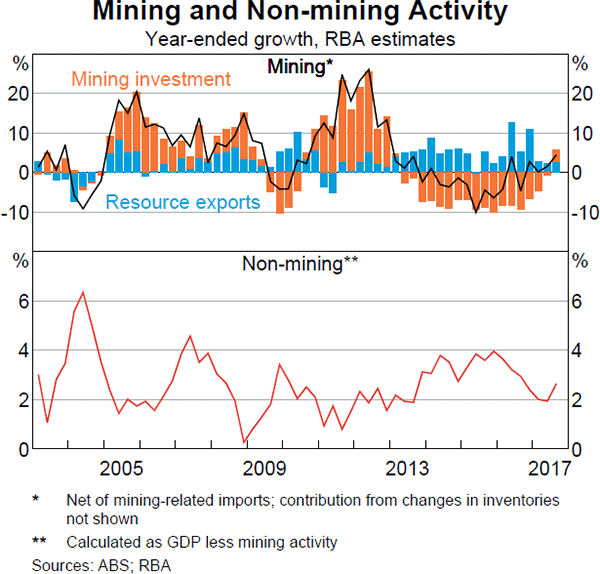
The mining sector has contributed positively to GDP growth over recent quarters (Graph 3.3). Over the past year, mining investment was not as weak as earlier expected, while resource exports increased further.
The ABS capital expenditure (Capex) survey of investment intentions and Bank liaison both point to declines in mining investment in coming quarters (although much smaller than the declines seen in previous years). Very few new projects are expected to commence in the period ahead and the construction phase of large liquefied natural gas (LNG) projects is close to completion. The level of mining investment is therefore expected to decline in the first half of 2018, before stabilising as major mining firms undertake investment to maintain existing productive capacity.
As more productive capacity has come on line over recent years, resource export volumes have grown strongly (Graph 3.4). The increase over the past year was driven largely by LNG production, and LNG exports are expected to increase strongly again over 2018 as existing projects ramp up production and other projects are completed.
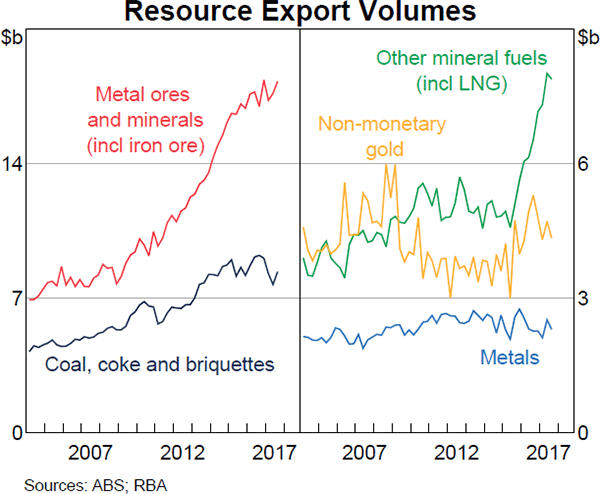
Iron ore export volumes remain at high levels and are expected to increase a little further over the next couple of years as productivity improvements from Australia's major producers yield incremental increases in production. Coal export volumes have been volatile during the past year reflecting a number of temporary production disruptions, including from Cyclone Debbie. Coal exports are expected to have declined in the December quarter because maintenance shutdowns and industrial action have affected production and export capacity.
Non-mining Business Investment and Trade
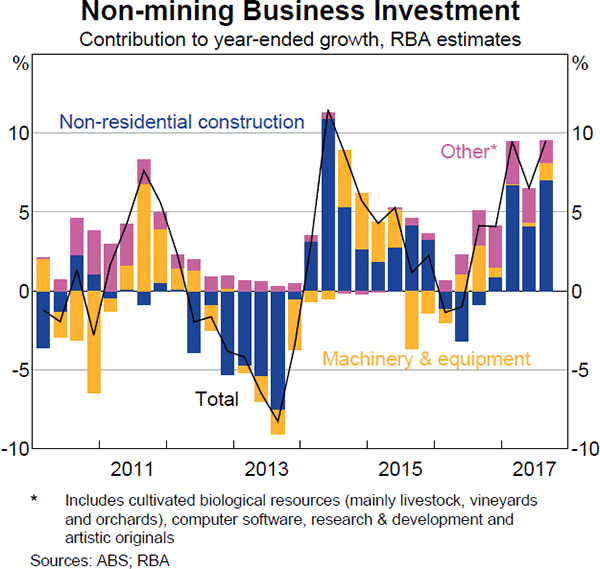
Non-mining business investment has been rising over the past few years and increased by almost 10 per cent over the year to the September quarter 2017. The pick-up in non-mining investment has been strongest in non-residential construction, while ‘other’ investment (which includes computer software and herd restocking by farmers) has also grown strongly (Graph 3.5).
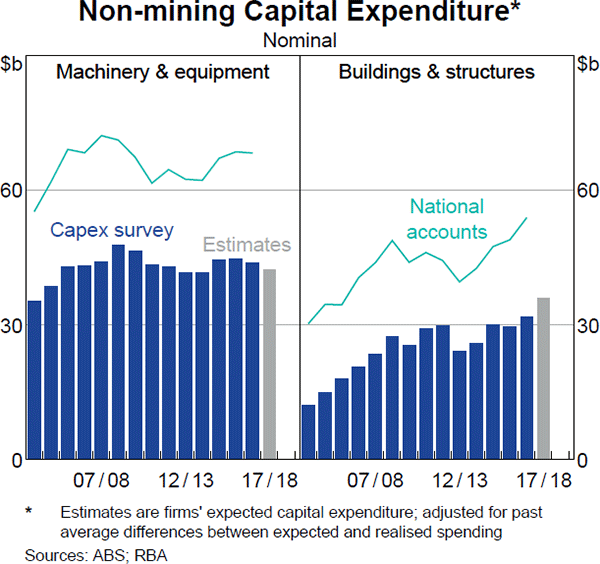
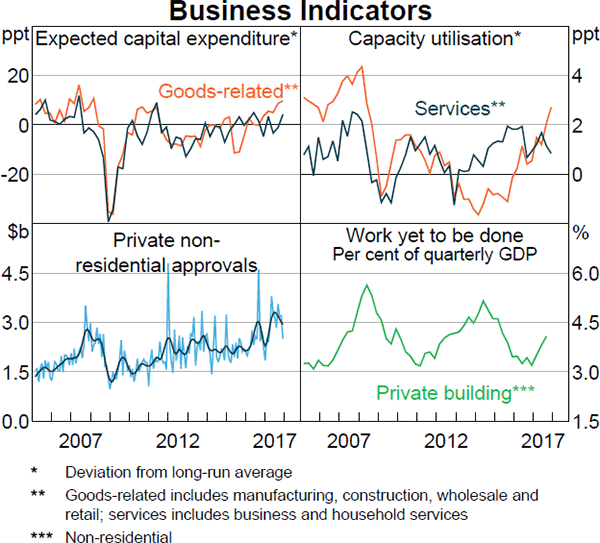
The outlook for non-mining business investment remains positive. Investment intentions for 2017/18 reported by firms in the ABS Capex survey were revised higher in the most recent survey and point to solid growth in building & structures investment (Graph 3.6). In the NAB survey, investment intentions and capacity utilisation – particularly for the goods-related sector – have risen and remain above average (Graph 3.7). Similarly, private non-residential building approvals are at a high level in trend terms and the stock of private non-residential building work yet to be done has risen over the past year from a low level, supported by growth in new office building projects. Liaison with businesses suggests that the strength in public infrastructure investment, particularly in New South Wales and Victoria, has also had a positive effect on private sector business conditions and that this is expected to continue (See ‘Box C: Spillovers from Public Investment’).
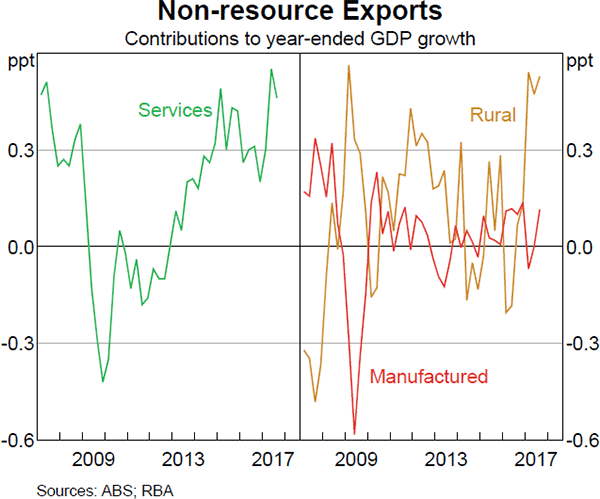
Non-resource exports have contributed strongly to economic growth since the exchange rate peaked in 2013 (Graph 3.8). Service exports have contributed around ½ a percentage point to year-ended GDP growth in recent quarters, largely driven by education. Rural exports also made a sizeable contribution to GDP over the year to the September quarter. Exports of cereals supported growth earlier in 2017 following the record winter crop harvest but appear to have declined towards the end of the year because of less favourable weather. Manufactured exports have been more volatile over the past year or so but liaison reports suggest that conditions in the manufacturing industry have improved recently, particularly for firms producing more specialised goods such as medical & pharmaceutical products.
Government Sector
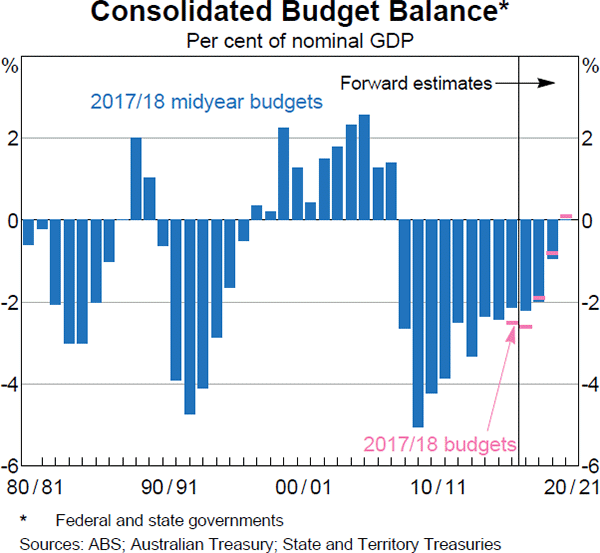
The strength of public investment in infrastructure has supported overall public demand over the past couple of years. Improved business conditions are expected to support taxation revenues in 2017/18, although weak wage growth is expected to limit growth in income tax receipts. Federal and state budget updates point to a slightly smaller consolidated deficit for 2017/18 than projected earlier in 2017 (Graph 3.9). Beyond 2017/18, the forecast for the consolidated budget deficit is little changed and continues to imply a narrowing of the deficit.
Household Sector
Household consumption increased only modestly in the September quarter, weighed down by a decline in goods consumption. Retail sales volumes have since rebounded, suggesting that goods consumption is likely to recover in the December quarter. Some of the volatility in recent quarters may reflect changing seasonal patterns that are not yet fully accounted for, such as the increasing popularity of online promotions in November, which boosted retail sales in the December quarter. More up-to-date information from liaison with retailers suggests moderate growth in sales over the past year, while strong competitive pressures have persisted. Measures of consumer sentiment have improved of late to be well above their long-run averages.
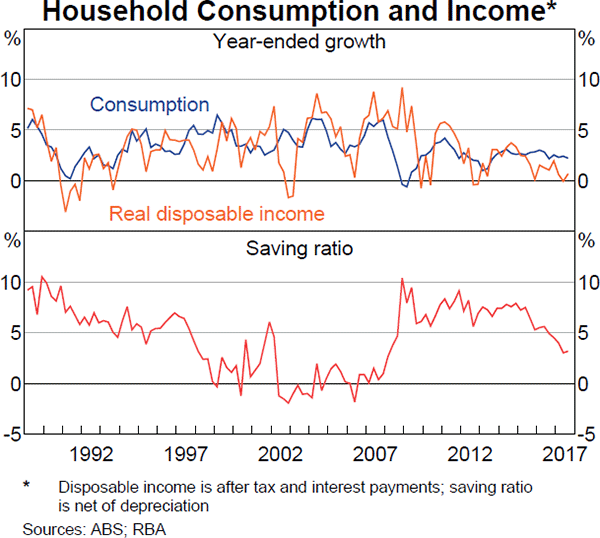
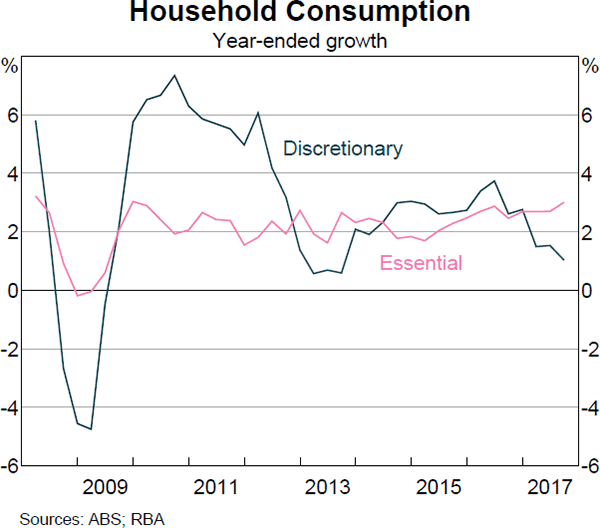
In year-ended terms, consumption growth has been slower than previously expected, but is still somewhat faster than the relatively low household income growth; the household saving ratio has declined over the year as a result (Graph 3.10). Strong employment growth over the December quarter should boost incomes and thus consumption in the short term. Looking forward, employment growth is expected to slow, which will limit the pick-up in income growth unless there is stronger wage growth for incumbent workers. The decline in the growth in expenditure on discretionary categories, such as hotels, cafes & restaurants and recreation & culture, could indicate some increased pressure on household finances (Graph 3.11).
In the September quarter, the growth rate of household net wealth was well below average. The slowing in growth from the June quarter was largely caused by slower growth in housing prices, while growth in financial assets remained steady. Although there was a moderation in household debt growth over the year, income growth declined by more, resulting in a small rise in the household debt-to-income ratio.
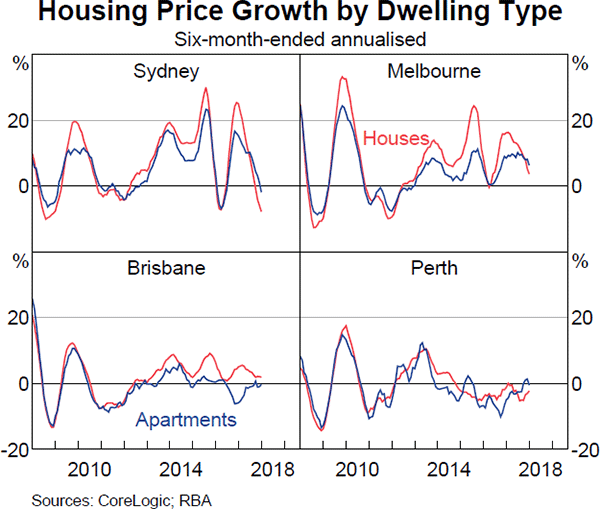
Conditions in established housing markets continued to ease in the second half of 2017. This was most evident in Sydney, where housing prices have declined and auction clearance rates are below their decade average (Graph 3.12). In Melbourne, housing price growth has declined and auction clearance rates have trended lower in recent months. In Perth, housing prices were flat in the last quarter of 2017. In Brisbane, apartment prices have been relatively stable, following earlier price falls, while detached house prices have increased slightly.
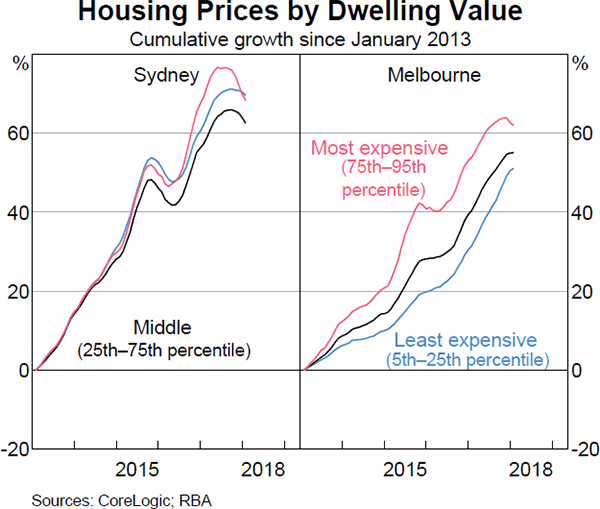
In Sydney and Melbourne, the decline in established housing price growth has been most pronounced for detached houses and for the most expensive properties; prices in both of these categories tend to have larger cycles than other market segments (Graph 3.13). The increased supply of housing and an apparent reduction in demand from foreign buyers for newly built properties are likely to be placing downward pressure on prices in Sydney, Melbourne and Brisbane though this is being offset to some extent by increased population growth, especially in Melbourne. The value of housing loan approvals has been broadly stable in aggregate since the end of 2016, though the composition has shifted towards owner-occupiers and away from investors (see ‘Domestic Financial Markets’ chapter).
Overall, growth in advertised rents picked up in the second half of 2017 due to increases in Sydney and Melbourne. Rents in Brisbane appear to have stabilised following earlier declines. Advertised rents in Perth have continued to decline, consistent with the ongoing high vacancy rate, but to a lesser extent than previously.
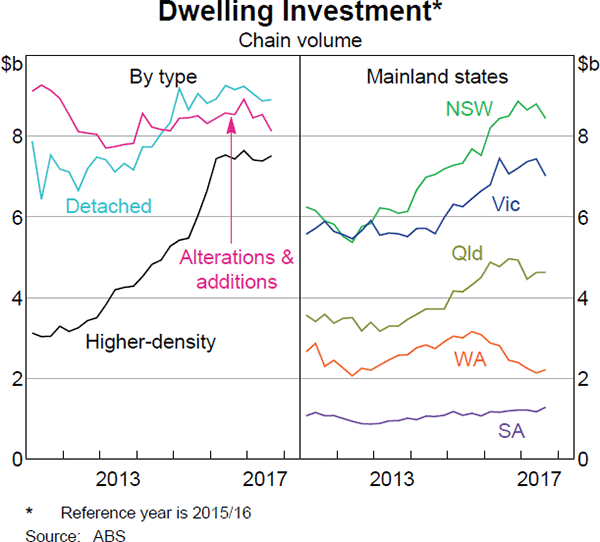
Strong population growth and higher housing prices have encouraged a high level of new dwelling construction in recent years, particularly in the eastern states (Graph 3.14). The increase in residential construction activity has been mainly concentrated in higher-density housing, which differs from previous cycles when most construction was for detached dwellings. Alterations and additions have been less responsive than in previous periods of strong dwelling investment.
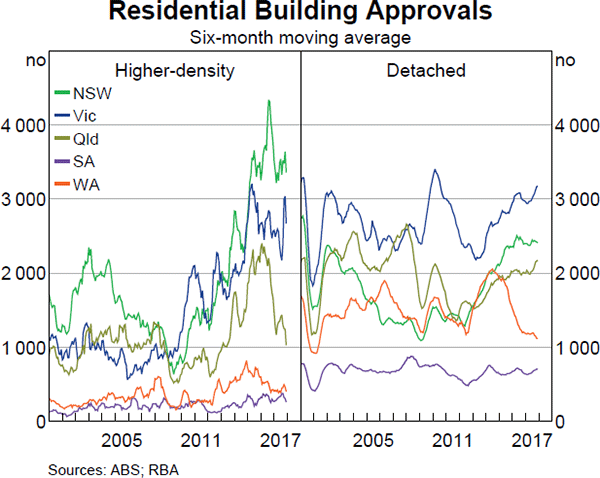
Higher-density residential building approvals picked up towards the end of 2017 due to increases in Victoria and New South Wales (Graph 3.15). In Victoria, the increase was underpinned by four large apartment projects and approvals seem unlikely to remain at this level in the coming months. Liaison with developers suggests that demand for new apartments from both domestic investors and foreign buyers has fallen. This suggests that it is likely to take longer for developers to reach a minimum level of pre-sales, which is typically needed before finance for the project is available. Nevertheless, the increase in building approvals has added to the pipeline of work that is already approved or underway, indicating that dwelling investment is likely to remain at a high level for some time yet. Approvals for new detached dwellings and alterations and additions also trended up in most states over the past year, most notably in Victoria.
Labour Market
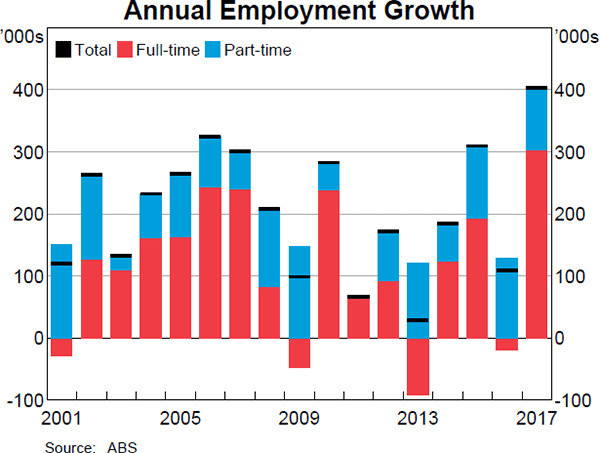
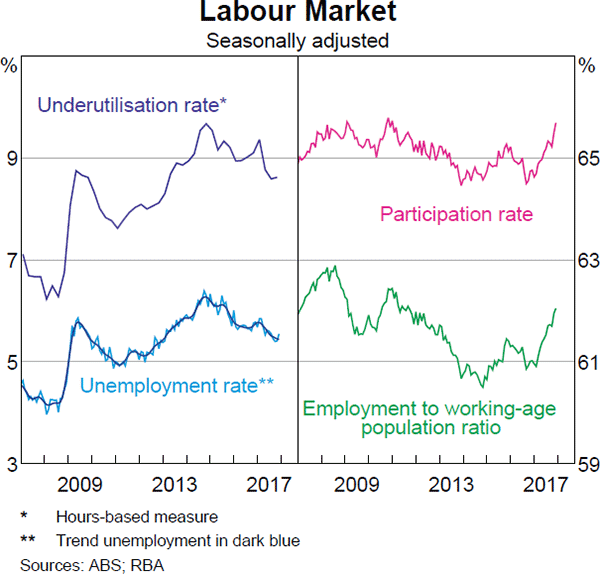
Labour market conditions improved by considerably more than expected over 2017. Employment continued to grow significantly faster than the working-age population over the December quarter, to be 3.3 per cent higher over the year. Full-time employment accounted for three-quarters of the growth over 2017, a strong rebound after declining slightly over 2016 (Graph 3.16). Strong growth in full-time employment over the past year has been accompanied by an increase in the net flow of workers from part-time to full-time employment and from ‘not in the labour force’ to employment. Consistent with the latter, the participation rate has risen sharply this year to be at its highest level since the record high in 2011 (Graph 3.17). Average hours worked were more or less stable over 2017; this went against the usual pattern of declines flowing from the trend towards part-time work and reflects both the particular strength in full-time employment growth and a pause in the trend towards lower average hours for full-time workers. Leading indicators of labour demand continue to point to solid growth in employment over the next six months, though not as strong as seen over the past year.
The unemployment rate has declined by ¼ percentage point over 2017, to 5.5 per cent. Broader measures of labour market underutilisation, which capture the additional hours that underemployed people would like to work as well as hours of work sought by the unemployed, have also declined. The Bank's assessment is that, while conditions improved significantly over 2017, spare capacity remains in the labour market.
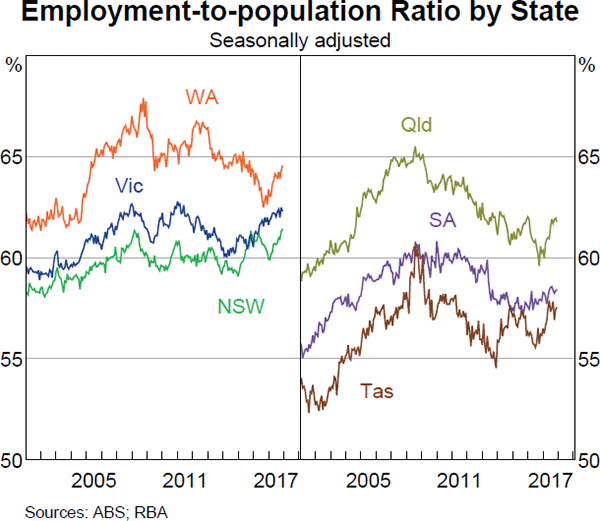
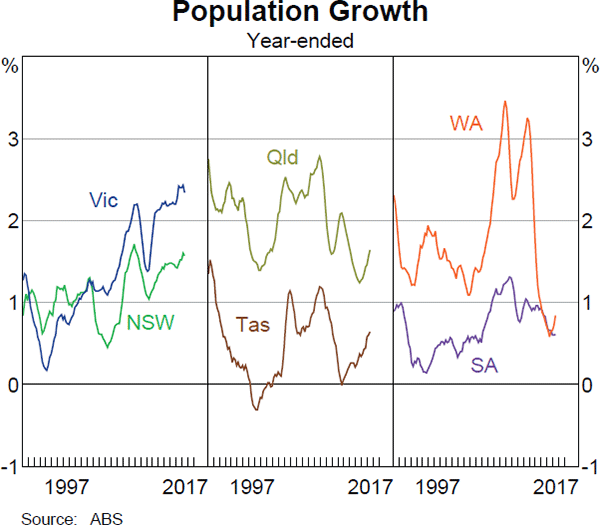
The improvement in labour market conditions over 2017 was apparent across the country. In trend terms, employment rose and the unemployment rate declined in all states (Graph 3.18). Participation rates increased in all states. Labour market conditions were strongest in the eastern states. Annual average employment growth in Victoria has been around 3½ per cent over the past two years, and the unemployment rate in New South Wales has reached its lowest level since mid 2008. Consistent with these strong conditions, population growth last year was particularly strong relative to history in Victoria and New South Wales (Graph 3.19). In part, this reflects stronger net overseas migration flows to these states.
Employment growth was strongest in the household services sector over 2017, particularly in the health care & social assistance industry, which alone accounts for around one-quarter of aggregate employment growth over the year. Much of the recent strength in health industry employment has been in hospital jobs. The rollout of the National Disability Insurance Scheme is likely to boost employment in this industry over the next few years.
Construction employment grew rapidly last year, consistent with the elevated level of residential and infrastructure building activity in the eastern states. Construction employment is estimated to have reached its highest share of total employment since the early 1900s. Employment growth was more subdued in other parts of the goods-related sector. In the business services sector, employment has declined over the past year while job vacancies have increased, making it difficult to gauge labour market conditions. Information from the Bank's liaison program points to strength in demand for workers with specialised IT skills and some other occupations within the business services sector.
Labour Costs
Wage growth remains low but stable across most aggregate measures (Graph 3.20). Despite strong employment growth over the past year, spare capacity in the labour market continued to weigh on wage growth. Low wage growth was particularly prevalent in the industries and regions adjusting to the decline in mining investment. A number of other factors are also likely to be contributing to subdued wage pressures, including compositional changes in the labour market, changes to employee bargaining power and sluggish productivity growth.
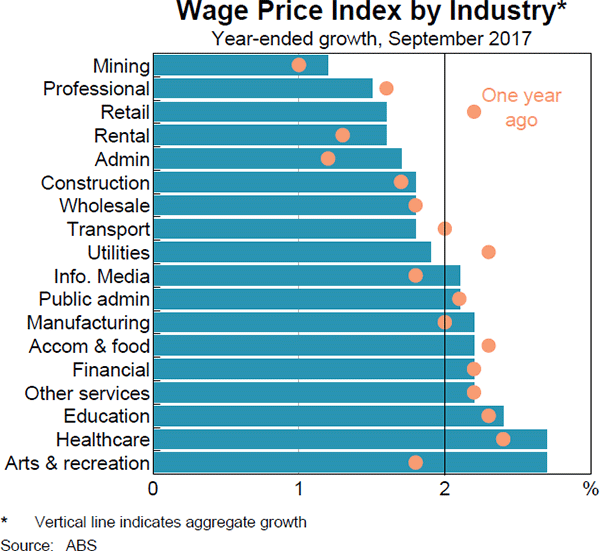
The wage price index (WPI) grew by 0.5 per cent in the September quarter and by 2 per cent over the year. This was a little lower than expected given the boost to wage growth from the 3.3 per cent increase in award and minimum wages in the quarter. Nonetheless, wage growth picked up over the year in a number of industries (Graph 3.21). Wage growth outcomes in household service industries, such as health and education, were higher than in industries such as mining and professional, scientific & technical services. This reflects strong demand for labour in household service industries as well as the higher share of workers on enterprise bargaining agreements (EBAs). Average annualised wage increases for new EBAs have declined notably over the past year. As EBAs have an average duration of a little over three years, it is expected that average wage growth for those on EBAs will slow as current agreements are replaced by new agreements that have lower average wage growth outcomes.
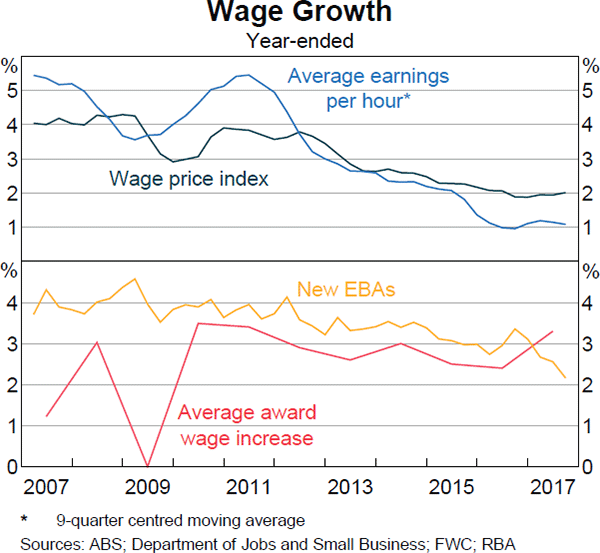
Growth in average earnings from the national accounts (AENA) remains subdued and noticeably weaker than growth in the WPI. AENA includes a broader range of labour earnings than WPI, such as allowances and redundancy payments, and captures any compositional changes in the labour market. The weakness in average earnings was particularly pronounced in goods-related industries such as construction (Graph 3.22).
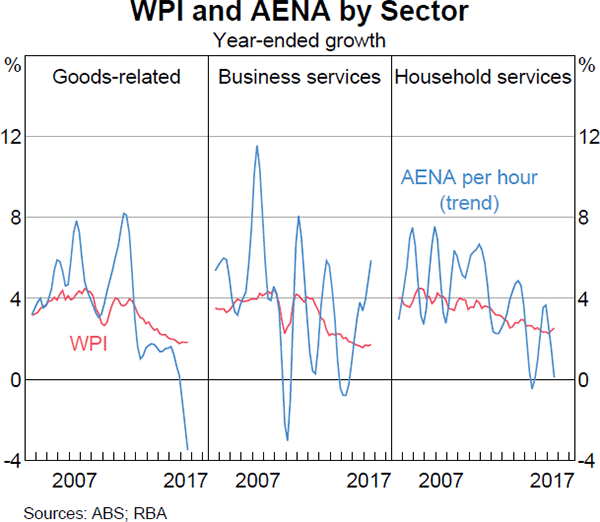
Within construction, this may reflect the slowing demand for construction workers on large-scale mining projects.
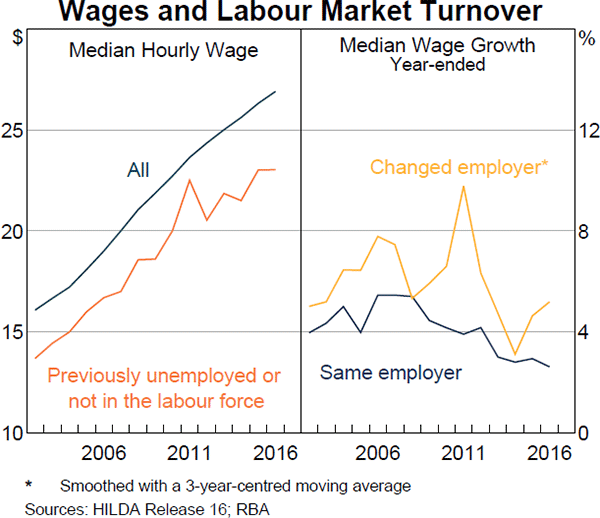
Broader compositional changes in the labour market also appear to be weighing on average earnings. Analysis of data from the Household, Income and Labour Dynamics in Australia (HILDA) Survey shows that there have been broad-based declines in wage growth outcomes for the majority of workers who have remained with the same employer in recent years (Graph 3.23). The gap between the lower wages of those entering into employment and those already working has widened. The share of workers changing employers has been at a low level in recent years and the boost to earnings from changing jobs has declined since the mining boom.