Research Discussion Paper – RDP 2016-05 Trade Invoicing Currency and First-stage Exchange Rate Pass-through
1. Introduction
The depreciation of the Australian dollar over the past few years has renewed interest in understanding the pass-through of exchange rate changes to consumer prices (e.g. RBA 2014). Exchange rate pass-through can be divided into two stages: first-stage pass-through from exchange rate changes to across-the-docks Australian dollar import prices; and second-stage pass-through from import prices to consumer prices. Recent evidence using aggregate time series data has found that first-stage pass-through in Australia is around 80 per cent, much of which occurs immediately (Chung, Kohler and Lewis 2011). We investigate whether and how the currency in which goods imports are invoiced affects first-stage pass-through.
For homogenous goods traded in perfectly competitive markets (e.g. commodities), deviations from the law of one price are small, and trade invoicing currency is irrelevant: first-stage pass-through is immediate.[1] But for differentiated goods (e.g. manufactures), prices are typically sticky in their currency of invoice, and thus currency invoicing mechanically affects short-run pass-through: it is 100 per cent for foreign currency-invoiced trade and zero for local currency-invoiced trade. Local currency invoicing dampens the short-run impact of exchange rate changes on consumer prices and reduces the expenditure-switching role of a flexible exchange rate (Devereux and Engel 2003).
While currency invoicing mechanically affects pass-through over the period for which prices are fixed, pass-through is the same for local and foreign currency-invoiced trade when prices are changed in standard models. This is because the invoicing currency is typically assumed to be exogenous, or unrelated to desired pass-through. However, Gopinath, Itskhoki and Rigobon (2010) estimate that long-run pass-through of exchange rate changes into US dollar import prices is only 17 per cent for imports invoiced in US dollars. Using price-level data, they show that even following a price change pass-through for US dollar-denominated goods imports is just 25 per cent. In contrast, for non-US dollar-invoiced goods, Gopinath et al (2010) estimate long-run pass-through to be 98 per cent. This implies that pricing-to-market behaviour is important, resulting in mark-up variation and persistent deviations from the law of one price.
Gopinath et al (2010) develop a model of endogenous currency choice that can explain why their estimates show long-run pass-through to be related to invoicing currency. In their model, firms choose whether to invoice in the local or the producer currency based on the magnitude of their desired pass-through over the duration that prices are fixed. Firms with low desired pass-through choose to invoice in local currency, while those with high desired pass-through will tend to invoice in producer currency. Critically, firms with low desired long-run pass-through are likely to also have low desired short-run pass-through, and so choose to invoice in local currency. Similarly, firms with high desired long-run pass-through are likely to also prefer high desired short-run pass-through, and so invoice in foreign currency. Thus, trade invoicing currency may serve as a sufficient statistic for desired long-run pass-through of exchange rate changes into import prices.
With endogenous choice of trade invoicing currency, the proposition that local currency pricing generates inefficient price dispersion over the duration that prices are fixed is weakened, because firms choosing to invoice in local currency are those that would absorb a large share of exchange rate changes in mark-ups even in a flexible price world. Desired pass-through is likely to be low for overseas exporters competing against local producers whose costs may vary relatively little with the exchange rate. Local currency invoicing mimics desired mark-up variation in response to exchange rate changes.
Existing Australian work either ignores the role of trade invoicing currency, or has implicitly assumed that invoicing currency is unrelated to firms' desired pass-through, in which case long-run pass-through is unrelated to invoicing currency. There are important differences between the structure of trade invoicing in Australia and the United States, suggesting that the findings of Gopinath et al (2010) may not apply. Firstly, in the United States around 90 per cent of imports are invoiced in local currency (US dollars) whereas in Australia only around 30 per cent of imports are invoiced in local currency (Australian dollars). Secondly, third-country invoicing is prominent in Australia but not in the United States: over 50 per cent of Australia's imports are invoiced in US dollars, despite only around 11 per cent of imports arriving from the United States.
Despite differences in the structure of invoicing between Australia and the United States, our results are consistent with Gopinath et al (2010). We estimate first-stage pass-through for foreign currency-invoiced goods to be immediate and complete, while pass-through for Australian dollar-invoiced imports is initially close to zero and is estimated to be only about 14 per cent after two years. The confidence intervals around our estimates are wide, but we can reject there being more than 50 per cent pass-through for Australian dollar-invoiced goods at a 95 per cent confidence level. These findings indicate that pass-through over a two-year period is close to bimodal, being approximately complete for foreign currency-invoiced trade and close to zero for Australian dollar-invoiced trade.
Our findings contribute to the Australian literature along several dimensions. First, the low degree of exchange rate pass-through for Australian dollar-invoiced trade provides evidence of large and persistent deviations from the law of one price. The aggregate import price series is the denominator in the terms of trade, so the less than one-for-one response of aggregate import prices to exchange rate changes implies that exchange rate changes caused by factors such as the stance of monetary policy can have a long-lived effect on the goods terms of trade. Second, our findings indicate that short- and long-run exchange rate pass-through is similar. Our findings of highly persistent deviations from the law of one price imply a very slow speed of adjustment in aggregate error correction models (ECMs) of import prices. Third, we show that invoicing currency serves as a sufficient statistic for firms' desired pass-through. Thus, variation in the share of Australian dollar-invoiced imports can be used to infer time-varying exchange rate pass-through to aggregate import prices.
Our paper relates most closely to Gopinath et al (2010), but also fits into a burgeoning literature studying variable mark-ups and international relative prices; see, for example, Knetter (1993) and Atkeson and Burstein (2008). This literature builds on seminal works by Dornbusch (1987) and Krugman (1987), who document the existence of pricing-to-market behaviour and identify imperfect competition and dynamic pricing considerations as explanations for incomplete pass-through. Our work also contributes to a large body of Australian evidence on first- and second-stage exchange rate pass-through, although to the best of our knowledge none of the previous work has investigated the role of currency invoicing. The most recent work is by Chung et al (2011), who estimate first-stage pass-through to be around 80 per cent, most of which occurs immediately.[2]
The remainder of the paper proceeds as follows: Section 2 outlines the data we use; Section 3 explains our regression framework and reports our main findings; Section 4 investigates whether an invoice-share-weighted exchange rate index is preferable to a trade-weighted exchange rate index for modelling import prices; Section 5 discusses implications of our findings; and Section 6 concludes.
2. Import Invoicing Currencies in Australia
We construct time series of import invoicing currencies at the two-digit Standard International Trade Classification (SITC) level. We do so using data from the ABS International Trade in Goods and Services (ITGS) data release and, prior to March 2003, the ABS International Merchandise Trade (IMT) data release.[3] Data on invoice currencies are unavailable for services imports so we consider only goods imports, as do Gopinath et al (2010).
The ABS publishes data on invoice currencies for exports and imports at the two-digit SITC level roughly every two years. Table 1 shows the underlying surveys from which we draw the data, and the quarters that they cover.
| ABS release | Quarters covered (inclusive) |
|---|---|
| March quarter 1998 IMT | March 1997–March 1998 |
| March quarter 2001 IMT | March 2000–March 2001 |
| March quarter 2003 IMT | March 2002–March 2003 |
| June quarter 2005 ITGS | March 2004–March 2005 |
| December quarter 2007 ITGS | March 2007–December 2007 |
| December quarter 2009 ITGS | March 2009–December 2009 |
| June quarter 2012 ITGS | September 2011–June 2012 |
| June quarter 2014 ITGS | September 2013–June 2014 |
|
Source: ABS |
|
The ABS provides data on the average invoice share across the survey period for a number of currencies at the two-digit SITC level. We construct quarterly two-digit SITC-level invoice share series as follows:
- For quarters during the survey we take the survey period average.
- For quarters falling between surveys we linearly interpolate between the last survey reading and the next.
The ABS also publishes aggregate invoice share data for each quarter within the survey period. We do not use these aggregate-level data in our regression analysis (but they are shown in Figure 1).
In total, we have invoice currency data for six currencies across 23 two-digit SITC divisions. Based on the most recent weighting for the import price index, these 23 divisions cover a little under 85 per cent of all goods imports. The six currencies cover around 98 per cent of imports in the SITC divisions for which we have data.[4]
2.1 Trends in Invoice Currencies
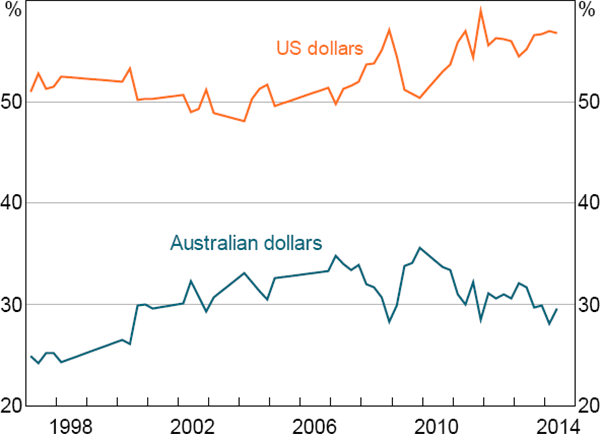
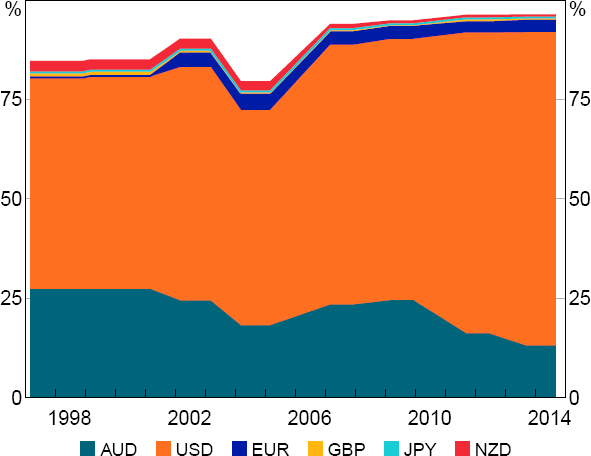
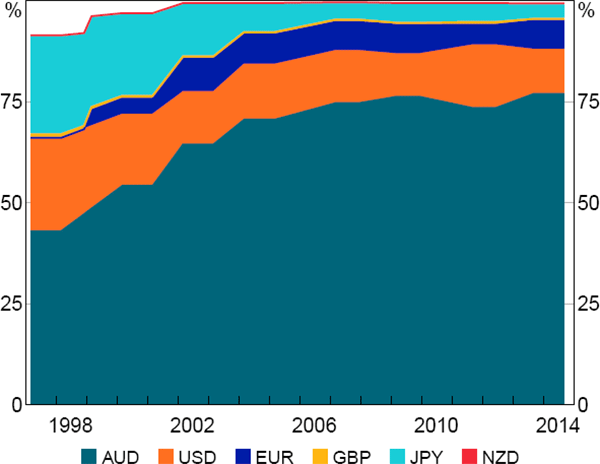
The majority of Australia's goods imports are invoiced in foreign currency, mostly US dollars (Figure 1). The average proportion of imports invoiced in US dollars has held reasonably steady at a little over 50 per cent across most of the period for which we have data. The share has increased a little in recent years, matching a similar-sized decline in the share of imports invoiced in Australian dollars. As of the most recent period for which we have data on currency of invoice, 57 per cent of all goods were invoiced in US dollars, 29 per cent in Australian dollars, 8.3 per cent in euro, 1.3 per cent in yen, 1.1 per cent in British pounds and 1 per cent in New Zealand dollars. The ABS does not routinely provide invoice currency data for other currencies.
Notes: Among SITC divisions for which the ABS collects invoice currency data; data are linearly interpolated between observations
Sources: ABS; Authors' calculations
The share of goods imports invoiced in US dollars is noteworthy given that only 11.5 per cent of Australia's goods imports come from the United States. This may in part reflect that: many of Australia's Asian trading partners have exchange rates closely linked to the US dollar; the US dollar is used as a global reserve currency; and the US dollar is used as a reference currency for many international prices – for instance, many commodities are routinely quoted in US dollars.[5] Goldberg and Tille (2008) argue that exporters often choose to invoice in a common currency to minimise variation in prices relative to their competitors, which they refer to as a ‘coalescing effect’. Critically, exporters may coalesce around an invoicing currency other that used in the importing or exporting country, as is the case for much of Australia's US dollar-denominated trade.
2.2 Invoice Currency by Broad Product Category
Table 2 shows the trade invoicing currency shares at the two-digit SITC level, as at June 2014 (the last period for which we have invoice currency data). The share of Australian dollar-invoiced trade is generally high for differentiated goods and low for homogenous goods. For example, petroleum products (SITC 33) are invoiced almost entirely in US dollars. Similarly, relatively homogenous manufactures – such as iron and steel (SITC 67) and non-ferrous metals (SITC 68) – are largely invoiced in US dollars. Differentiated goods, such as pharmaceuticals (SITC 54) and vehicles (SITC 78), tend to be invoiced in Australian dollars. Clothing (SITC 84) is an exception to this pattern, for which the share of imports invoiced in US dollars is high despite being a division that covers differentiated goods.
| Code | Description | AUD | USD | EUR | JPY | GBP | NZD | Other |
|---|---|---|---|---|---|---|---|---|
| 33-X | Petroleum product and related | 0.2 | 99.7 | 0.1 | 0.0 | 0.0 | 0.0 | 0.0 |
| 51 | Organic chemicals | 42.5 | 53.0 | 3.1 | 0.2 | 0.8 | 0.1 | 0.3 |
| 54 | Medicinal and pharmaceutical | 80.7 | 13.8 | 3.2 | 0.1 | 0.5 | 0.3 | 1.4 |
| 62 | Rubber manufactures | 49.0 | 41.3 | 5.9 | 1.9 | 0.5 | 0.2 | 1.2 |
| 64 | Paper and paperboard | 52.0 | 31.9 | 8.7 | 0.4 | 0.5 | 4.4 | 2.1 |
| 65 | Textiles and fabrics | 19.4 | 62.7 | 10.7 | 0.9 | 1.7 | 3.5 | 1.1 |
| 66 | Non-metallic minerals | 23.2 | 53.3 | 12.3 | 8.2 | 0.9 | 0.2 | 1.9 |
| 67-X | Iron and steel | 20.1 | 68.6 | 7.9 | 1.2 | 0.6 | 0.1 | 1.5 |
| 68-X | Non-ferrous metals | 10.1 | 82.9 | 4.3 | 0.2 | 0.7 | 1.1 | 0.7 |
| 69 | Manufactures of metals | 23.5 | 56.9 | 11.6 | 0.6 | 1.7 | 0.8 | 4.9 |
| 71 | Power generating machinery and equipment | 13.6 | 50.1 | 27.3 | 3.3 | 3.5 | 0.4 | 1.8 |
| 72 | Specialised machinery | 19.9 | 41.9 | 22.4 | 7.0 | 4.0 | 0.8 | 4.0 |
| 74 | Industrial equipment and machine parts | 29.7 | 42.8 | 20.4 | 2.0 | 1.9 | 0.7 | 2.5 |
| 75 | Office machines and ADP equipment | 21.2 | 73.3 | 1.4 | 2.9 | 0.3 | 0.3 | 0.6 |
| 76 | Telecommunications and sound recording | 39.8 | 55.6 | 2.8 | 0.3 | 0.7 | 0.3 | 0.5 |
| 77 | Electrical appliances | 28.5 | 54.4 | 11.0 | 0.7 | 1.8 | 0.6 | 3.0 |
| 78 | Road vehicles | 77.0 | 10.9 | 7.2 | 3.6 | 0.5 | 0.2 | 0.6 |
| 79 | Transport equipment (excl road vehicles) | 14.9 | 41.2 | 38.0 | 0.5 | 1.1 | 0.4 | 3.9 |
| 82 | Furniture | 9.3 | 76.6 | 8.9 | 0.2 | 0.6 | 0.5 | 3.9 |
| 84 | Apparel and clothing | 12.9 | 78.8 | 3.1 | 0.1 | 0.7 | 0.6 | 3.8 |
| 87 | Scientific instruments and apparatus | 32.5 | 44.4 | 14.2 | 1.5 | 3.2 | 0.7 | 3.5 |
| 89 | Miscellaneous manufactured articles | 30.1 | 53.5 | 8.2 | 0.7 | 2.2 | 1.5 | 3.8 |
| 97-X | Non-monetary gold | 2.3 | 70.0 | 0.2 | 0.0 | 0.0 | 11.7 | 15.8 |
| Aggregate | 29.4 | 56.8 | 8.3 | 1.3 | 1.1 | 1.0 | 2.1 | |
|
Note: SITC codes marked with an X denote largely homogeneous goods divisions that are excluded from our regression analysis Sources: ABS; Authors' calculations |
||||||||
2.3 SITC-level Exchange Rate Indices
For use in the regression analysis that follows, we construct 19 quarterly two-digit SITC-level import trade-weighted exchange rate indices (Figure 2).[6] These indices are designed to measure the most relevant exchange rate changes for each two-digit SITC division because the composition of the countries of origin differs across goods imports at the two-digit SITC level. Thus, some bilateral exchange rates are more relevant for some goods than others. For instance around a third of road vehicles imports (SITC 78) come from Japan, compared to about 1 per cent of medicinal and pharmaceutical imports (SITC 54); thus, the Australian dollar-Japanese yen exchange rate is more relevant for the former than the latter.
Note: The four ‘homogenous good’ SITC divisions are excluded from this figure (see Table 2)
Sources: ABS; Authors' calculations; RBA
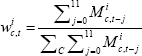
These indices are geometric weighted averages of bilateral nominal exchange rates, with the weights determined by the import trade share of the relevant country at the two-digit SITC level. The weights are the 12-month moving average of the country's share of total imports within each two-digit SITC division; we take a moving average to smooth month-to-month variation in trade shares, which can be affected by lumpy imports. That is:
where:
-
 is the weight of country
c for SITC division i at month t
is the weight of country
c for SITC division i at month t
-
 is imports from country c
for SITC division i at month t − j.
is imports from country c
for SITC division i at month t − j.
We use the monthly ABS balance of payments two-digit SITC-level trade data for imports by country to construct these weights. Although we construct these indices at monthly frequency, quarterly averages are taken to match the frequency of other data used. All the indices are indexed to September 1996. Appendix A examines some alternative specifications for the two-digit SITC-level import trade-weighted exchange rate indices; our results are robust to these alternative ways of measuring the relevant exchange rate.
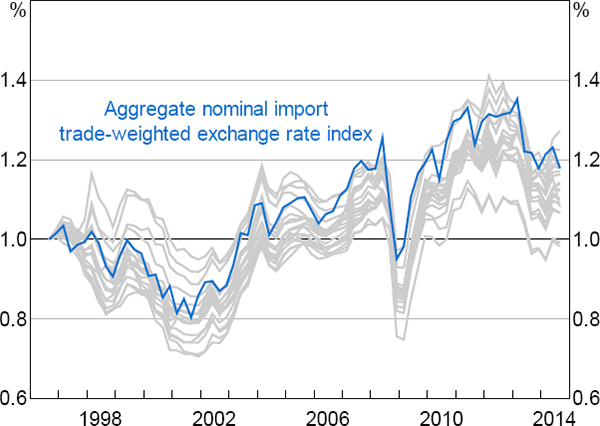
There is a tight relationship between the import trade-weighted exchange rate indices we construct and the aggregate import trade-weighted exchange rate index. Nonetheless, there are differences between the series, particularly in quarterly changes. This variation in exchange rate changes across SITC divisions is helpful for identifying exchange rate pass-through. Nonetheless, most of our identification of pass-through comes from the sizeable time series variation in exchange rates common to all SITC divisions.[7]
2.4 Import Invoicing and Pass-through
Mechanically, contemporaneous first-stage pass-through is complete for imports invoiced in foreign currencies because the Department of Immigration and Border Service converts foreign currency-invoiced imports to Australian dollars using exchange rates that apply at the time of import. Accordingly, there is a strong contemporaneous relationship between import price indices for SITC divisions with high proportions of foreign currency invoicing and the SITC-level import trade-weighted exchange rate indices that we construct. For example, apparel and clothing imports are largely invoiced in foreign currencies (Figure 3), and the relationship between movements in the SITC-level import trade-weighted exchange rate index and the import price index for these goods is close to one-for-one (Figure 4).
Sources: ABS; Authors' calculations
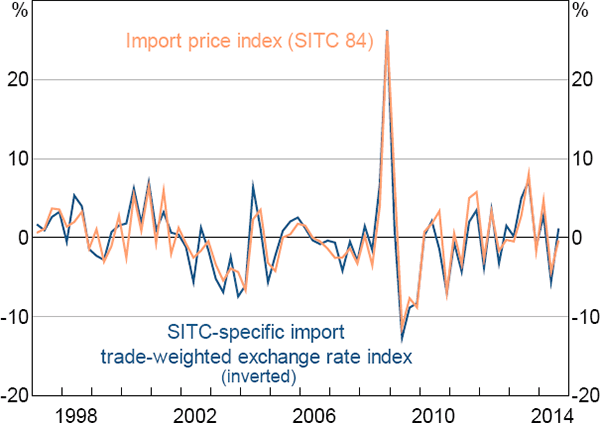
Note: Average share of imports invoiced in Australian dollars: 21.8 per cent
Sources: ABS; Authors' calculations
For Australian dollar-invoiced goods imports the contemporaneous relationship is much weaker. For instance, the import price index for road vehicles only loosely follows the SITC-level import trade-weighted exchange rate index (Figure 5). Moreover, the relationship looks like it may have weakened over time. This weakening might reflect the growing share of Australian dollar-invoiced goods in this category: 75 per cent of all imported road vehicles are currently invoiced in Australian dollars, up from 50 per cent in the late 1990s (Figure 6).
Figures 3 and 6 also show that there is substantial variation in the prevalence of Australian dollar invoicing across two-digit SITC divisions. It is this variation that we exploit to estimate how invoicing currency affects first-stage pass-through.
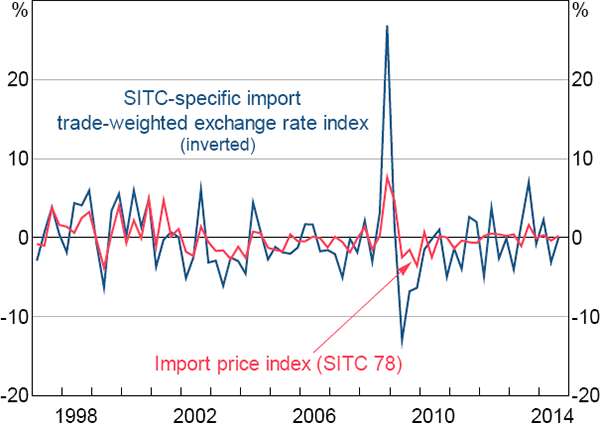
Note: Average share of imports invoiced in Australian dollars: 66.6 per cent
Sources: ABS; Authors' calculations
Sources: ABS; Authors' calculations
3. Regression Analysis
In this section we use a regression framework to examine the relationship between invoice currency and exchange rate pass-through. Ideally, we would make use of price-level data to examine pass-through. In the absence of these data, we estimate the following panel regression using two-digit SITC-level data at a quarterly frequency:

where:
- Δpi,t is the log difference of the import price index for two-digit SITC division i
-
 is the share of imports in two-digit SITC division i
invoiced in Australian dollars
is the share of imports in two-digit SITC division i
invoiced in Australian dollars
- Δei,t − j is the log difference of the import trade-weighted exchange rate index for two-digit SITC division i, constructed as described in Section 2.3
-
 is the pass-through coefficient for Australian
dollar-invoiced goods at horizon j, and analogously for
is the pass-through coefficient for Australian
dollar-invoiced goods at horizon j, and analogously for  for foreign currency-invoiced goods
- ΔGDPt − j is the quarterly log difference of Australian real GDP
- αi are SITC division fixed effects, which allow for different average growth rates of prices across SITC divisions (our results are almost identical if we exclude the fixed effects).
We include quarterly GDP growth to control for domestic economic conditions, as in Gopinath et al (2010). We also tried including quarterly CPI inflation, or non-tradeable CPI inflation (and lags) alongside GDP growth. Doing so made no difference to our results. Using time fixed effects to control for aggregate-level variables instead of GDP growth is discussed in Appendix A.
We exclude four mostly homogenous-good SITC divisions from the regression because there is no reason to expect invoice currency should affect pass-through for flexible-price goods. (Table 2 lists the SITC divisions for which we have data, and the four that we exclude.) Excluding these four, the two-digit SITC divisions for which we have data cover a little over 60 per cent of all goods imports, based on trade weights for the September 2014 import price index.
Note that we do not need data on the price of Australia's imports in the source country to understand the role of invoicing currency. In the model developed by Gopinath et al (2010), the choice of whether to invoice in the local or the producer currency is determined only by the unconditional covariance of exchange rate shocks and firms' desired prices over the duration for which prices are expected to be fixed. In other words, because the cost of goods in the exporter's home country is unaffected by the decision to invoice exports in the local or the producer currency, we do not need information on the price of goods in exporters' home currencies to understand invoicing behaviour.
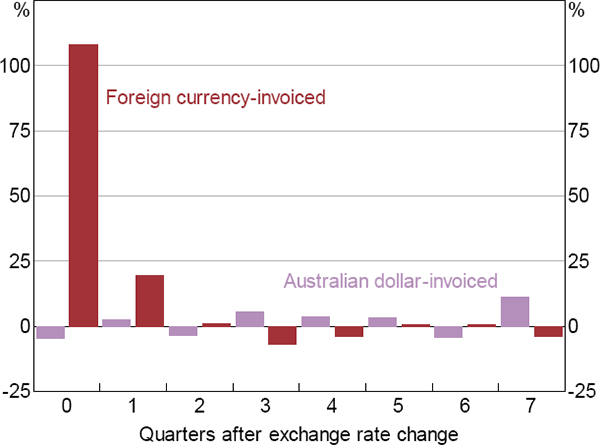
Figure 7 shows the estimated cumulative change in import prices following an exchange rate
change for Australian dollar-invoiced and foreign currency-invoiced goods, out to a
seven-quarter horizon. The red line plots the cumulative sum of the estimated coefficients out
to horizon h, and the purple line does the same for the coefficients .
Figure 8 shows the raw coefficients.
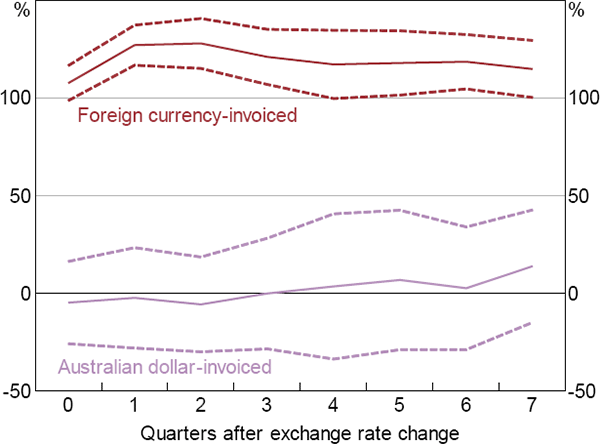
Notes: Dashed lines show two standard error bands; standard errors are clustered at the two-digit SITC division
In the first quarter following an exchange rate change, pass-through for foreign currency-invoiced goods is immediate and complete, and close to zero for Australian dollar-invoiced goods. This is consistent with prices being sticky in their currency of invoice. At longer horizons, once firms have had time to reset prices, pass-through remains close to complete for foreign currency-invoiced imports. We believe two years is a long enough period to expect firms to have reset prices because Gopinath and Rigobon (2008) document that median duration before import prices are changed is 11 months.[8] Although we find evidence of more-than-complete pass-through for foreign currency-invoiced goods, we believe this finding is unlikely to be economically meaningful.
Strikingly, for Australian dollar-invoiced goods, pass-through is statistically indistinguishable from zero even after two years. Our central estimate is that pass-through is just 14 per cent after two years. The confidence intervals are wide, which probably reflects the fact that we have relatively aggregated data and can only exploit invoicing currency variation across the 19 SITC divisions for which we have data. Moreover, our sample is relatively short, comprising 16 years of data. Nonetheless, we can reject pass-through of more than 50 per cent for Australian dollar-invoiced goods at the 95 per cent level of statistical significance. Our results are robust to different exchange rate measures and to the use of period-average invoice currency shares by two-digit SITC division; see Appendix A for details.
Because we use two-digit SITC-level data rather than price-level data, our results could be affected by aggregation bias. There are two ways aggregation might affect our pass-through coefficients. First, if prices remain unchanged for two or more years this will bias our long-run pass-through estimates. For foreign currency-denominated imports the bias is towards a coefficient of 1 (i.e. a finding of pass-through of 100 per cent), because pass-through for foreign currency-invoiced trade is mechanically 100 per cent over the duration that the foreign currency price is unchanged. For Australian dollar-invoiced trade the bias in our estimate of pass-through coefficients is towards zero. Assuming that import prices are reset on average approximately every 11 months (Gopinath and Rigobon 2008) and that the hazard rate of price changes is constant (the Calvo model), around 10 per cent of prices will remain unadjusted after two years. An estimated dynamic stochastic general equilibrium model for Australia implies that import prices are reset on average every three quarters (Jääskelä and Nimark 2011), slightly more frequent than reported by Gopinath and Rigobon (2008) for the United States. Thus, although this bias may marginally affect our exact estimate of pass-through, we do not believe it is likely to be large enough to substantially change the qualitative story.
Second, we would ideally use fixed-weight price indices that abstract from substitution among goods in response to price changes. At lower levels of aggregation, index weights are fixed between irregular sampling reviews, but at higher levels of aggregation index reweighting occurs annually. Nonetheless, substitution among goods at higher levels of aggregation is likely to be low given the quite different nature of the goods (e.g. road vehicles and furniture). Reassuringly, aggregation bias did not appear to materially affect pass-through estimates in the US data used by Gopinath et al (2010) – their results using aggregate- and price-level data are largely the same.
4. An Invoice-share-weighted Exchange Rate Index
Thus far, we have emphasised the low degree of pass-through for Australian dollar-invoiced imports. We now examine pass-through in more detail for foreign currency-invoiced imports. Our motivation for doing so is that, if currency choice is a sufficient statistic for desired pass-through, invoice currency should be more relevant for modelling import prices than the currency of the country of origin.
Much of Australia's goods imports are invoiced in a third currency, rather than Australian dollars or the currency of origin (Table 3). The most prominent third currency is the US dollar. In 2014, the United States was the source of only 11 per cent of Australia's goods imports, for the two-digit SITC divisions for which we have data, but 57 per cent of imports were invoiced in US dollars. In contrast, 14 per cent of imports come from the euro area, but just 8 per cent of all imports in two-digit SITC divisions for which we have data are invoiced in euros. Similarly, 9 per cent of Australia's imports come from Japan, but only 1 per cent of imports are invoiced in Japanese yen.
| Per cent of imports that come from country | Per cent of imports invoiced in currency of country | |
|---|---|---|
| United States | 11.5 | 56.8 |
| Euro area | 14.3 | 8.3 |
| Japan | 8.8 | 1.3 |
| United Kingdom | 2.7 | 1.1 |
| New Zealand | 2.1 | 1.0 |
|
Note: As a proportion of imports for the SITC divisions for which we have data Sources: ABS; Authors' calculations |
||
Figure 9 compares the import trade-weighted exchange rate index to the invoice-share-weighted geometric average of the five bilateral nominal exchange rates for which we have invoice currency data.[9] Because the US dollar is by far the most common invoice currency among foreign currencies – 83 per cent of all foreign currency-invoiced imports as of the most recent data – the invoice-share-weighted index is highly correlated with the US dollar. Although there is a high degree of co-movement among exchange rates for Australia's trading partners, there have been episodes where the trade-weighted and invoice-share-weighted exchange rates have diverged for a period of time. For example, the import trade-weighted exchange rate did not depreciate as much as the invoice-share-weighted exchange rate during the late 1990s and early 2000s.
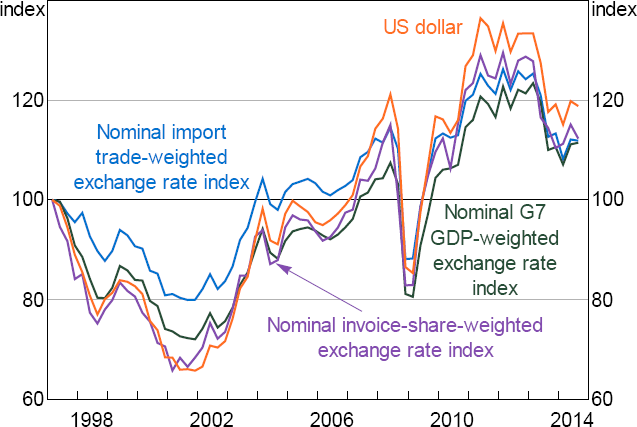
Sources: Authors' calculations; RBA
To the extent that prices are sticky in their currency of invoice, the invoice-share-weighted exchange rate should better predict short-run changes in import prices for foreign currency-invoiced goods than the import trade-weighted exchange rate. We test this hypothesis at the aggregate level by running the following regression:
where:
-
 is the aggregate import price index for the 19
differentiated-goods two-digit SITC divisions for which we have data; we construct the index
using the weights of these two-digit SITC divisions in the aggregate import price index
is the aggregate import price index for the 19
differentiated-goods two-digit SITC divisions for which we have data; we construct the index
using the weights of these two-digit SITC divisions in the aggregate import price index
-
 is the invoice-share-weighted exchange rate index
-
 is the nominal import trade-weighted exchange rate
index
is the nominal import trade-weighted exchange rate
index
-
 is the pass-through coefficient at horizon j
for the invoice-share-weighted exchange rate index, and analogously for
is the pass-through coefficient at horizon j
for the invoice-share-weighted exchange rate index, and analogously for  for the spread between the two indices.
For sticky-price goods invoiced in foreign currency, short-run changes in import prices should
be more closely correlated with movements in the invoice-share-weighted than the import
trade-weighted exchange rate index. This implies >0 for
the first couple of quarters over which prices are sticky, with the size of the coefficients
declining by horizon. If our hypothesis that there is no additional information in the import
trade-weighted index above the invoice-share-weighted index is true, the coefficients on the
spread term () should all be zero.
Figure 10 shows the estimated coefficients and ,
together with two standard error confidence bands. As predicted, the first coefficient for the
invoice-share-weighted index is significantly greater than zero. However, contrary to our
hypothesis, the contemporaneous coefficient for the import trade-weighted index is positive and
statistically significant. Thus the data do not support the proposition that the changes in the
invoice-share-weighted exchange rate index alone are sufficient for modelling pass-through. This
may reflect the possibility that, despite restricting attention to less homogenous goods, prices
for some foreign currency-invoiced trade are reset frequently, which could make the
trade-weighted exchange rate index relevant above and beyond the invoice-share-weighted index.
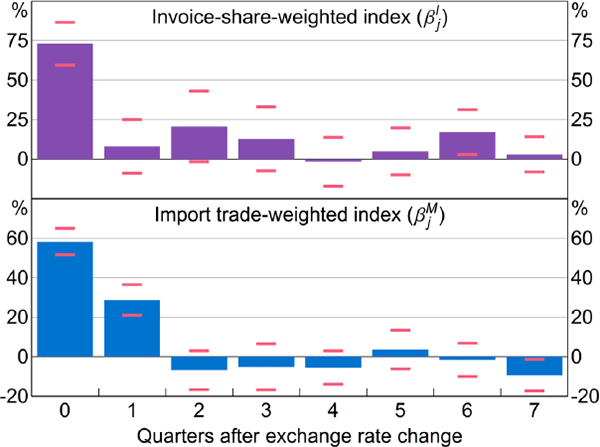
Note: Red bars show two standard error bands
5. Implications
5.1 Real Rigidities
Less-than-complete pass-through for goods invoiced in Australian dollars is likely to be a result of foreign exporters with a low desired degree of pass-through choosing to invoice in Australian dollars, because this minimises pass-through for the duration over which prices are fixed (Gopinath et al 2010). Thus, currency of invoice serves as a sufficient statistic for firms' desired degree of long-run pass-through. A deeper question is why desired long-run pass-through is much less than complete for some firms. Rationalising low levels of desired pass-through amounts to a search for sources of real rigidity – factors that attenuate the response of prices to nominal shocks. Our sense of the literature (discussed in the introduction) is that, while a range of hypotheses have been explored, the low degree of long-run pass-through for local currency-invoiced goods remains a puzzle.
Gopinath and Itskhoki (2010) find some evidence that pass-through is affected by the degree of competition among importers: sectors with a small number of large importers tend to show lower levels of exchange rate pass-through, although there is considerable uncertainty around their estimates. This fact suggests that SITC divisions with a small number of large importers would be more likely to invoice in Australian dollars. Price-level evidence from Canada supports this contention, with Devereux et al (2015) finding a negative relationship between importer market share and pass-through. Consistent with Gopinath and Itskhoki (2010), Australian dollar invoicing does appear to be more common in the manufacturing industry; however, we caution that because we do not have firm- and price-level data, this invoicing-share calculation is extremely rough. Another strand of the literature notes the ongoing nature of importer-exporter relationships, with Gopinath and Itskhoki (2010) arguing that substantial mark-up variation can be generated in a bilateral bargaining environment.
In recent work, Berger and Vavra (2013) find that the degree of exchange rate pass-through is time-varying, and tends to be high when the cross-sectional dispersion of price changes across items is high, but they do not explain the low level of exchange rate pass-through. Lewis (2016) uses price-level data for imports and shows that first-stage pass-through is nonlinear at the micro level: there is little pass-through of small exchange rate changes, but pass-through of large exchange rate changes is about four times as high. Hedging practices allow firms to manage cash flow positions, but cannot explain why firms choose to set time-varying mark-ups.
Firms that operate across borders also affect the degree of first-stage pass-through because their imports are not arms-length. Neiman (2010) finds that intra-firm prices are characterised by more frequent price adjustment and higher long-run pass-through. A different but related possibility is that pass-through differences in part reflect pricing agreements for intra-firm trade reached between firms and the tax authority. The two trade divisions in our sample for which there may be considerable scope to manipulate intra-firm prices are medicinal and pharmaceutical products (SITC 54) and road vehicles (SITC 78). However, our findings are essentially unchanged if we exclude these two divisions from the estimation sample.
5.2 Monetary Policy
Local currency (Australian dollar) pricing of imports dampens the response of importers' costs to exchange rate changes, and so is likely to weaken the relationship between exchange rate changes and consumer prices. Devereux and Engel (2003) argue that this weakens the stabilisation role of floating exchange rates. Standard models featuring price stickiness and producer currency pricing imply that exchange rate changes have an immediate impact on relative prices of domestic- and foreign-produced goods, and so have large expenditure-switching effects; under certain assumptions, monetary policy under a flexible exchange rate regime with producer currency pricing can replicate the equilibrium of the economy with fully flexible prices. But with price stickiness and local currency pricing, changes in monetary policy have less influence on the relative price of domestic and foreign goods through movements in the exchange rate.
5.3 Modelling Import Prices
For the approximately 30 per cent of goods imports invoiced in Australian dollars, we have estimated pass-through of only 14 per cent after two years. This implies large and persistent deviations from the law of one price for a sizeable share of Australia's goods imports. The speed of exchange rate pass-through for Australian dollar goods imports may rise beyond the two-year horizon we have examined, but Gopinath et al (2010) do not find this for US data. In contrast, pass-through is immediate and complete for foreign currency-invoiced imports. Our results imply that the speed of adjustment in an ECM framework for exchange rate changes to import prices would be very slow for Australian dollar-invoiced trade. Furthermore, because there are two distinct sets of goods for which pass-through differs so greatly, aggregate import price models that impose the law of one price are likely to be unsuitable, at least over forecast horizons relevant for monetary policy.
5.4 Terms of Trade
Empirically, and in theoretical models, the terms of trade is a determinant of the exchange rate (e.g. Hambur et al 2015). However, our results imply that exogenous exchange rate changes might have a long-lived effect on the terms of trade. The low degree of exchange rate pass-through to Australian dollar-invoiced imports means that aggregate import prices move less than one-for-one with the exchange rate, out to at least a two-year horizon. Our estimates imply that a 1 per cent exogenous depreciation (i.e. not due to changes in the terms of trade) in the Australian dollar against all trading partners raises Australia's goods and services import price index by about 0.8 per cent after two years.[10] If pass-through for goods exports is complete, or close to, we would thus expect a depreciation to increase the goods terms of trade.[11] Similarly, an exogenous exchange rate appreciation would decrease the terms of trade.
6. Conclusion
We assess how exchange rate changes affect import prices. For imports invoiced in foreign currencies (roughly two-thirds of imports) the pass-through of exchange rate changes to import prices is immediate and close to one-for-one at horizons up to two years, consistent with the law of one price. For the roughly one-third of imports invoiced in Australian dollars, we find that pass-through of exchange rate changes to import prices is only about 14 per cent after two years. Consistent with US evidence from Gopinath et al (2010), these results indicate sizeable and persistent deviations from the law of one price for Australian dollar-invoiced goods.
Our findings do not indicate that invoice currency causes this low pass-through of exchange rate changes to import prices. Rather, our findings are likely to reflect foreign exporters with a low desired degree of pass-through choosing to invoice in Australian dollars. Doing so minimises pass-through for the duration over which prices are fixed. Thus, the invoice currency serves as a sufficient statistic for firms' desired degree of pass-through over a period of at least two years. Explaining why firms would want a low degree of long-run pass-through amounts to finding sources of real rigidities – factors that attenuate the response of price changes to nominal shocks. Our sense of the literature is that, although there are a number of hypotheses, the size of the deviation remains something of a puzzle.
One implication of our results is that Australian dollar-invoicing reduces the sensitivity of importers' costs to exchange rate changes, and this may reduce the response of consumer prices to exchange rate changes. Local currency pricing implies that exchange rate changes have small effects on the relative price of domestic- and foreign-produced goods, dampening expenditure switching effects. This observation has potentially important implications for monetary policy. If local currency (Australian dollar) invoicing were to become more prevalent, our results suggest that the expenditure switching channel of monetary policy may be somewhat weakened.
To the extent that prices are sticky in their currency of invoice, our findings imply that an invoice-share-weighted exchange rate index should be sufficient for modelling aggregate exchange rate price pass-through to import prices. However, we find that changes in the trade-weighted index are also relevant, possibly because there is a low degree of nominal rigidity for some foreign currency-invoiced trade.
Another important implication of our results is that aggregate import price models imposing the law of one price are likely to be unsuitable, because the speed of pass-through is extremely slow for Australian dollar-invoiced imports. Finally, our results suggest that changes in the exchange rate might have long-lived effects on the goods terms of trade. In particular, to the extent that exchange rate changes affect import prices less than one-for-one (as we find), and if exchange rate pass-through for export prices is near complete, an exchange rate depreciation might raise the terms of trade.
Appendix A: Robustness Checks
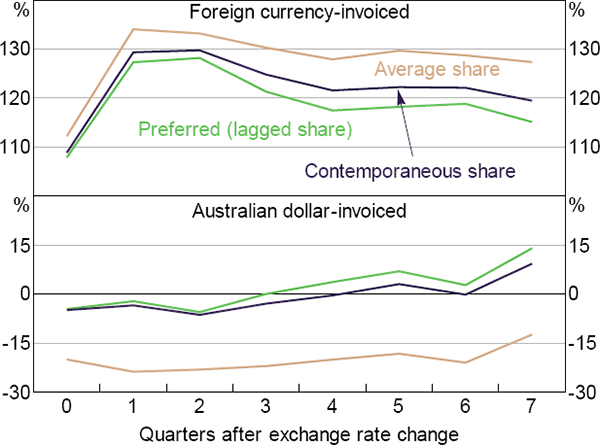
As a robustness check on the way we incorporate information about invoicing currency we estimated two alternative models: one which incorporated the full-period-average Australian dollar-invoice share; and one which used the contemporaneous Australian dollar-invoice share, rather than the lagged share. Formally, the average-share model is:

and the contemporaneous share model is:

This choice does not substantially change our results (Figure A1). The average-share model produces negative estimates of pass-through for Australian dollar-invoiced goods and higher estimates of pass-through for foreign currency-invoiced goods. We suspect this result is due to the upward drift in the share of Australian dollar-invoiced goods shown in Figure 1.
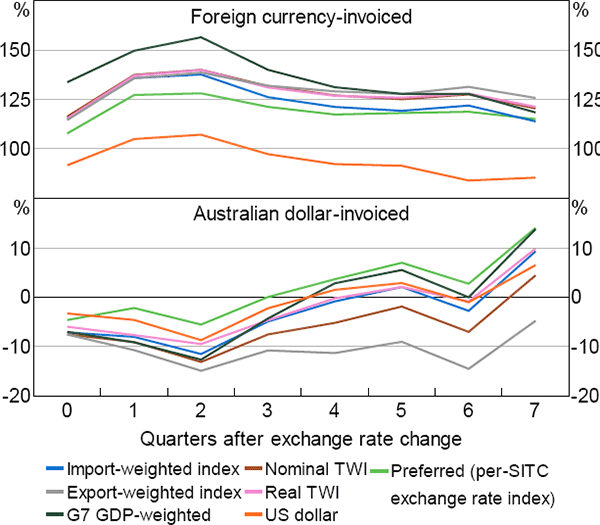
Using different measures of exchange rates does not meaningfully alter the results either (Figure A2). Although there are differences in the point estimates, our broad result – that pass-through is roughly complete for foreign currency-invoiced goods and near zero for Australian dollar-invoiced goods – is unchanged.
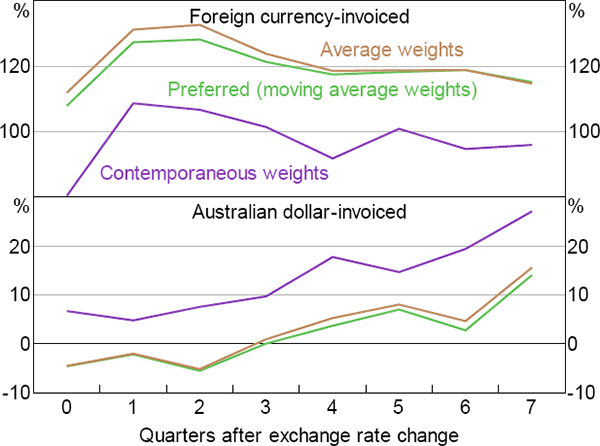
In addition to our preferred two-digit SITC-level exchange rate indices in the text, we also used two other measures for determining the weights for these indices as a robustness exercise: one where the weights are based on the full sample average, rather than the time-varying moving average; and one where we use the contemporaneous import share, rather than the 12-month moving average. We refer to these as ‘average weights’ and ‘contemporaneous weights’. Our results are robust to this methodological choice (Figure A3).
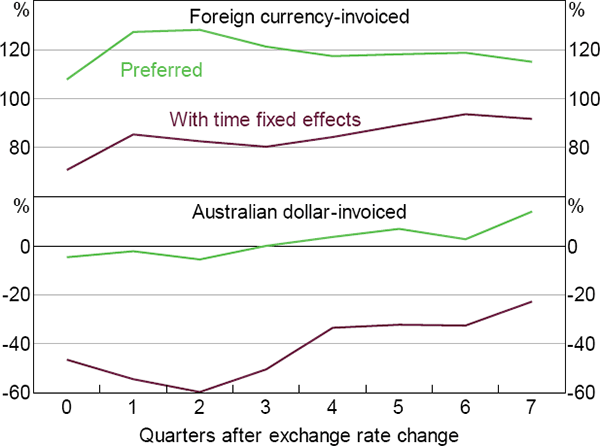
Our final robustness check was to include time fixed effects in the pass-through regression instead of including quarterly GDP growth (Figure A4). Using time fixed effects shifts the level of pass-through, largely because of the effect on the contemporaneous coefficient. This means we find strongly negative pass-through for Australian dollar-invoiced goods. The level shift similarly affects both the foreign currency-invoiced coefficients and the Australian dollar-invoiced coefficients, such that the difference in pass-through between Australian dollar-invoiced goods and foreign currency-invoiced goods is mostly unaffected.
Given that the time fixed effects remove all the (substantial) common variation in the SITC-level exchange rates, it is not surprising that time fixed effects greatly affect our estimates of the level of pass-through. It is the substantial variation in the exchange rate (e.g. Figure 2, and as discussed in Section 2.3) that allows us to estimate the overall level of pass-through. That our estimate of the difference between foreign currency-invoiced and Australian dollar-invoiced pass-through is unaffected is thus reassuring, even if the level is not. Moreover, we have no good reason to believe that we have omitted important aggregate-level variables that might affect our estimates. Thus, the case for including time fixed effects is weak. As such, we do not use time fixed effects in our preferred estimates in the text.
References
Atkeson A and A Burstein (2008), ‘Pricing-To-Market, Trade Costs, and International Relative Prices’, The American Economic Review, 98(5), pp 1998–2031.
Berger D and JS Vavra (2013), ‘Volatility and Pass-Through’, NBER Working Paper No 19651, rev May 2015.
Chung E, M Kohler and C Lewis (2011), ‘The Exchange Rate and Consumer Prices’, RBA Bulletin, September, pp 9–16.
Devereux MB, W Dong and B Tomlin (2015), ‘Exchange Rate Pass-Through, Currency of Invoicing and Market Share’, Bank of Canada Working Paper 2015-31.
Devereux MB and C Engel (2003), ‘Monetary Policy and the Open Economy Revisted: Price Setting and Exchange-Rate Flexibility’, The Review of Economic Studies, 70(4), pp 765–783.
Dornbusch R (1987), ‘Exchange Rates and Prices’, The American Economic Review, 77(1), pp 93–106.
Dwyer J, C Kent and A Pease (1993), ‘Exchange Rate Pass-Through: The Different Responses of Importers and Exporters’, RBA Research Discussion Paper No 9304.
Dwyer J and R Lam (1994), ‘Explaining Import Price Inflation: A Recent History of Second Stage Pass-Through’, RBA Research Discussion Paper No 9407.
Goldberg LS and C Tille (2008), ‘Vehicle Currency Use in International Trade’, Journal of International Economics, 76(2), pp 177–192.
Gopinath G and O Itskhoki (2010), ‘In Search of Real Rigidities’, Federal Reserve Bank of Boston Research Department Working Paper No 10-09.
Gopinath G, O Itskhoki and R Rigobon (2010), ‘Currency Choice and Exchange Rate Pass-Through’, The American Economic Review, 100(1), pp 304–336.
Gopinath G and R Rigobon (2008), ‘Sticky Borders’, The Quarterly Journal of Economics, 123(2), pp 531–575.
Hambur J, L Cockerell, C Potter, P Smith and M Wright (2015), ‘Modelling the Australian Dollar’, RBA Research Discussion Paper No 2015-12.
HM Revenue & Customs (2015), ‘UK Non-EU Trade by Declared Currency of Invoice (2014)’, Official Statistics release.
Jääskelä JP and K Nimark (2011), ‘A Medium-Scale New Keynesian Open Economy Model of Australia’, Economic Record, 87(276), pp 11–36.
Knetter MM (1993), ‘International Comparisons of Pricing-To-Market Behavior’, The American Economic Review, 83(3), pp 473–486.
Krugman P (1987), ‘Pricing to Market When the Exchange Rate Changes’, in SW Arndt and JD Richardson (eds), Real-Financial Linkages among Open Economies, MIT Press, Cambridge, pp 49–70.
Lewis J (2016), ‘What Can Big Data Tell Us about the Passthrough of Big Exchange Rate Changes?’, Bank of England Staff Working Paper No 579.
Neiman B (2010), ‘Stickiness, Synchronisation, and Passthrough in Intrafirm Trade Prices’, Journal of Monetary Economics, 57(3), pp 295–308.
Rauch JE (1999), ‘Networks Versus Markets in International Trade’, Journal of International Economics, 48(1), pp 7–35.
RBA (Reserve Bank of Australia) (2014), ‘Box C: Recent Developments in Retail Prices and Margins’, Statement on Monetary Policy, February, pp 56–58.
Acknowledgements
We thank Alexandra Heath, Jarkko Jääskelä, Christopher Kent, Gianni La Cava, David Norman, Bruce Preston, Matthew Read, Tom Rohling, Tom Rosewall, John Simon and Callan Windsor for helpful advice, comments and suggestions.
Footnotes
See, for example, Rauch's (1999) classification of goods into differentiated, reference-priced and those traded on organised exchanges. [1]
Previous research also includes work by Dwyer, Kent and Pease (1993) and Dwyer and Lam (1994). They use an ECM and find that first-stage pass-through is around 50 per cent in the quarter in which the depreciation occurs, and largely complete within a year; since the ECM they use imposes the law of one price, first-stage pass-through is complete in the long run. [2]
The Asian economic crisis stimulated interest in the currencies used to invoice Australia's trade, prompting the ABS to begin collecting trade invoicing currency data in 1997. [3]
A full list of these SITC divisions is provided in Table 2. [4]
For comparison, around 90 per cent of Canadian imports are invoiced in US dollars (Devereux, Dong and Tomlin 2015); in the United Kingdom around two-thirds of non-EU imports are invoiced in US dollars, and around a quarter are invoiced in British pounds (HM Revenue & Customs 2015). [5]
We exclude four SITC divisions comprising mostly homogeneous goods (e.g. petroleum products) in the regression analysis that follows. See Table 2 for a list of the SITC divisions we have data for, and those that we exclude from the regression analysis. [6]
Around four-fifths of the variation in the two-digit SITC-level exchange rate indices is common. [7]
Gopinath and Rigobon use the same import price data as Gopinath et al (2010). [8]
We rescale the weights for foreign currencies so that they sum to 100. [9]
This calculation uses our estimate of 14 per cent long-run pass-through for the 29.4 per cent of Australia's goods imports invoiced in Australian dollars, and assumes complete pass-through for other goods and services imports. [10]
Although data on goods export invoicing currencies are available, we have not pursued assessing pass-through because many of Australia's goods exports are homogenous goods, and thus the law of one price is likely to hold. [11]