RBA Annual Conference – 2000 Australian Macroeconomic Performance and Policies in the 1990s David Gruen and Glenn Stevens[1]
1. Introduction
A decade ago, in July 1990, the Australian economy had just entered a severe recession. Real GDP slowed in the first half of 1990, and then began to fall in the second half of the year. The rate of unemployment in mid 1990 was around 6¾ per cent but rose sharply in the following year. The rate of inflation was around 6 per cent, but was about to decline quickly, to levels not seen since the early 1960s. For many, the decline in inflation was completely unexpected, and many believed for several years that it could not last.
The recovery from the recession began some time in the September quarter of 1991. It was initially slow and tentative, with the result that the unemployment rate, instead of falling rapidly as had occurred in the early phase of recovery in 1983, in fact continued to rise until late 1992. Pessimism about the prospects for the Australian economy, and particularly about unemployment, became intense in that period.
Yet as of mid 2000, the economy has recorded nine years of continual growth, averaging about 4 per cent per year, the longest expansion in the Australian economy since the 1960s, and a performance similar in many respects to that in the United States. Per capita growth in GDP was noticeably higher than in the preceding two decades, helped by a marked lift in productivity growth. The rate of unemployment has declined, albeit gradually, to within sight of previous cyclical lows. At the same time, the CPI inflation rate has averaged less than 3 per cent for a decade. Equally, the variability of both inflation and GDP growth have declined compared with the preceding two decades.
In looking back over a decade, there are two basic approaches that might be taken. One is chronological – to treat the important trends and episodes in order, in the form of a historical narrative. It can be taken for granted – it is by the present authors at any rate – that capitalist economies display cyclical behaviour. A narrative chronology would trace out the evolution of these forces. This has its value, but many of the episodes – particularly the early 1990s recession and the immediate aftermath – have been treated at length before.
An alternative approach is to take the period as a whole, to ask in what ways the performance of the economy was noteworthy. How was it different to earlier periods? What were the changes to the underlying structure of the economy, and the policy regimes under which it operated, which affected this performance? How did the external forces affecting the economy differ in the 1990s from those of the 1980s and 1970s? What was the nature of the policy debate, how was it different to those in earlier periods, and why?
The latter approach is the one attempted here. Necessarily, the treatment has to be reasonably selective, but it is a more interesting approach, mostly because the 1990s outcomes tell a pretty good story.
Section 2 of the paper contains a recounting of the key macroeconomic features of the 1990s, with sections on output and productivity growth, inflation, the labour market, the balance of payments, and financial trends. Section 3 covers the policy debates, with sections on monetary policy, the current account and fiscal policy. Section 4 offers some concluding observations.
2. Features of Macroeconomic Performance in the 1990s
2.1 Growth
Table 1 offers some decade average comparisons for key macroeconomic variables. Dating things by calendar decades is, of course, completely arbitrary, but as it happens, these decade average figures are a reasonable basis for comparison. Each calendar decade includes one large recession. These were in 1960–61, 1974, 1982–83, and 1990–91. Each decade had a lengthy period of expansion, punctuated by a mid-cycle pause. There was a noticeable slowing in growth in 1965 (and again in 1972). The 1970s included a secondary slowdown in 1976–77, which some classified as a recession.[2] The 1950s also had a mid-cycle pause/recession around 1957. The mid-cycle episodes in 1986 and 1996 were milder affairs, in terms of GDP at least.
| 1950s | 1960s | 1970s | 1980s | 1990s | |
|---|---|---|---|---|---|
| Real GDP growth | 4.2 | 5.3 | 3.5 | 3.3 | 3.5 |
| Standard deviation of GDP growth | |||||
| – Four-quarter-ended | 2.3 | 2.8 | 2.1 | 2.6 | 1.9 |
| – Quarterly | na | 2.5 | 1.4 | 1.1 | 0.7 |
| Per capita GDP growth | 1.8 | 3.3 | 1.8 | 1.7 | 2.3 |
| CPI inflation | 6.1 | 2.5 | 10.1 | 8.3 | 2.3 |
| – Excluding interest | na | na | na | 8.1 | 2.8 |
| Standard deviation of CPI inflation (quarterly) | 1.9 | 0.5 | 1.2 | 0.8 | 0.6 |
| Unemployment rate | 2.2 | 2.2 | 4.2 | 7.6 | 8.9 |
| Current account balance(a) (% of GDP) | −2.2 | −3.0 | −1.8 | −4.7 | −4.4 |
| (a) Excludes RBA gold transactions. | |||||
Growth averaged 3.5 per cent in the 1990s as a whole. This was slightly higher than in the 1980s, lower than the 1960s by a good margin and a little lower than the 1950s. On this basis, comparing the 1990s with the 1980s, there is not much in it in terms of average output growth.[3] The bigger difference is in the inflation performance, to be taken up below. Before that, however, two things about growth rate a mention.
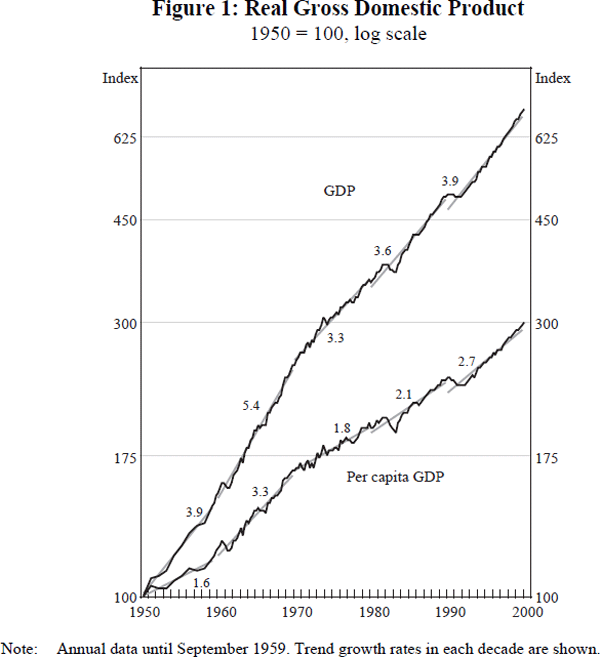
First, since population growth in the 1990s slowed, as immigration declined and birth rates dropped, per capita growth was noticeably faster than in the 1980s. In fact, per capita GDP growth in Australia was the fastest since the 1960s, something that Australia shares only with Ireland among OECD countries. This reflects the quite noticeable pick-up in productivity growth; the share of the working-age population in work declined slightly in net terms over the decade, whereas it had risen through the 1980s. The acceleration in productivity growth is also taken up below.
Second, GDP growth was much less volatile in the 1990s than in any of the preceding three decades. Table 1 shows the standard deviations of quarterly and annual rates of GDP growth, by decade. Volatility had been declining each decade, but it fell noticeably in the 1990s, which was the only decade of the past four in which the standard deviation of the quarterly GDP growth rate was lower than its mean. It is intriguing to contemplate why that occurred. Several hypotheses might be advanced.[4]
One is that the weight in total output of activities which are inherently more stable has increased. Services, for example, often thought to be relatively stable, are now a higher share of the economy than they were, whereas agriculture, highly volatile due to climatic events, has steadily declined in share, to be only a few per cent of GDP by the end of the 1990s. However, an examination of the data on GDP by industry reveals that the standard deviation of growth rates declined in the 1990s, as compared with the 1980s, in fourteen of the eighteen major categories. Among the expenditure components, volatility also declined in most cases. The decline in volatility of overall growth does not, therefore, appear to be due only to compositional effects.
A second hypothesis, which the authors find plausible, is that the shocks hitting the economy were smaller than they have been in the past. Such shocks could be external, or they could be internal, possible policy-induced. Some candidates are shown in Table 2.
| 1980s | 1990s | |
|---|---|---|
| US real GDP – quarterly growth | 1.0 | 0.6 |
| World GDP – annual growth(a) | 1.3 | 0.9 |
| Australian terms of trade | 6.6 | 3.9 |
| Real short-term interest rates (cash rate less Treasury underlying inflation) | 2.7 | 1.8(c) |
| Real 10-year bond rate (nominal 10-year bond less Treasury underlying inflation) | 1.6 | 1.2 |
| Fiscal impact (change in ratio of general government underlying cash balance to GDP) | 1.2 | 1.6 |
| (change in ratio of general government structural balance to GDP)(b) | 1.5 | 1.3 |
| Real TWI | 13.5 | 7.0 |
| Real US short-term rate (Fed funds less core inflation) | 1.3 | 1.3 |
| (a) Source: IMF (b) Source: OECD (c) Over the period 1993–99, the standard deviation of real short-term interest rates was 0.7. |
||
Among external shocks, the most common is large shifts in the terms of trade. The standard deviation of the terms of trade in the 1990s is indeed considerably smaller than in the 1980s, and in fact smaller than in any of the three preceding decades.[5] So this class of shock, which has historically been one of the most important factors driving fluctuations in the Australian economy, was a smaller source of instability in the 1990s.[6]
This may well be related to greater stability in the US economy, which also saw a decline in GDP volatility in the 1990s, as Table 2 shows. The strong correlation between the Australian and US GDP data – much closer than between Australian GDP and world GDP – suggests that the smoother course of the US economy in the 1990s may have been particularly important in contributing to the smoother outcomes in Australia.[7]
Other shocks to be considered would be policy-induced shocks. It can be observed that the variance of the real short-term interest rate and of the real 10-year bond rate declined in the 1990s. So it is apparent that monetary policy impulses have been smaller in the 1990s. In the low-inflation period after the end of 1992, the variance of short-term interest rates was even lower. The variance of the fiscal impact, as defined by the change in the general government underlying cash balance, rose somewhat in the 1990s, while the variance of the change in the OECD's estimate of the structural balance fell.
One of the difficulties in drawing strong conclusions from such partial statistics is that the various shocks interact. For example, the exchange rate moved down sharply in the mid 1980s in what, with the benefit of hindsight, appears to be a one-time shift to a lower mean. This was associated with a large decline in the terms of trade – larger than anything which occurred in the 1990s. Instability in the foreign exchange market associated with this move, compounded by the difficulties in articulating a well-developed monetary policy framework after monetary targeting had to be abandoned, meant that aggressive interest rate responses to exchange rate fluctuations were required on occasion. In the 1990s, policy was not faced with the same situation. The terms of trade shocks were smaller, and the size of ‘warranted’ and actual movements in the exchange rate were considerably smaller. Hence the likelihood of complications was smaller to begin with.
At the same time, however, a more fully articulated and better understood regime for monetary policy paid dividends in the face of shocks. During the Asian crisis, for example, which saw a very substantial decline in the exchange rate, a macroeconomic policy regime which was more credible allowed monetary policy more latitude than it had enjoyed during the events of the 1980s. The net result of all this is that individual monetary policy changes have become smaller. The 25 or occasional 50 basis point movements in interest rates which have recently become the standard currency in monetary policy adjustments are in another league entirely from the 100 or even 200 basis point movements which were common in the late 1980s and early 1990s.
A final possible hypothesis for explaining the economy's greater stability is the improvements in supply structure which have occurred under the general heading of ‘microeconomic reform’. These are taken up in detail in Peter Forsyth's paper in this volume, but in brief things like deregulation in the financial sector, widespread tariff reductions, privatisation/corporatisation of government businesses in telecommunications, air transport, utilities, and liberalisation in labour markets have had profound effects on the economy.
Elementary economic analysis suggests that, in themselves, the improvements in supply elasticity would be expected, for a given variance of demand disturbances, to result in more measured volatility in output (and correspondingly less in prices) than would be the case otherwise. But they would also mean that temporary demand disturbances would elicit less aggressive responses from demand management policies since they would be less likely to result in persistent inflationary pressure. So it is plausible that supply-side reforms have also contributed, indirectly, to the diminished activism of monetary policy noted above, and hence to more stable economic activity. It is not possible to be definitive on this without much more complex analysis.
2.2 Productivity
After the disappointing performance of the previous two decades, productivity growth in the 1990s returned to rates last seen in the 1960s. Figure 2 shows more precise measures of productivity, specifically labour and multifactor productivity growth in the market sector of the economy since the mid 1960s. The market sector, which accounts for about two-thirds of the economy, excludes those industries for which output is derived directly from inputs.
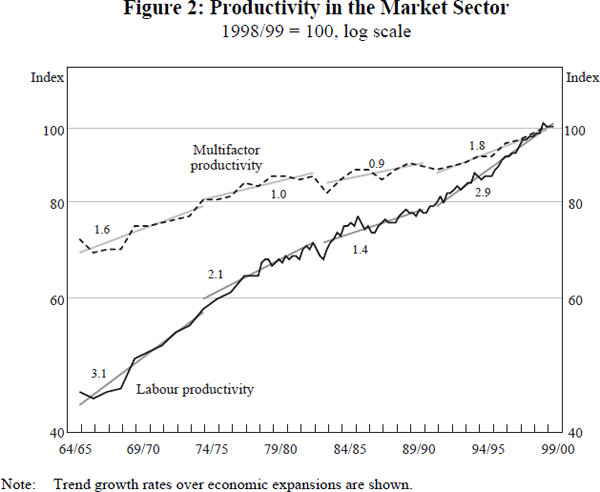
Measured productivity growth varies over the business cycle, as inputs are used more intensively during expansions than contractions. To control for this effect, the trend lines in the figure show the average rates of labour and multifactor productivity growth over economic expansions (that is, from troughs to peaks in output).[8] Growth rates of both labour and multifactor productivity in the 1990s expansion are closer to the rates seen in the 1960s than in the 1970s or 1980s. Estimated multifactor productivity growth is faster in the 1990s than in the previous three decades.[9]
Focusing on the two most recent economic expansions, labour productivity growth accelerated from 1.4 to 2.9 per cent per annum. Labour productivity growth in the 1980s was probably slower than it would otherwise have been because of the Prices and Incomes Accords negotiated between the trade union movement and the Federal Government at the time. Those Accords held down real wage growth, and thereby generated faster growth in employment but as a consequence labour productivity growth was slower (Chapman 1990, Stevens 1992).
We can, in principle, abstract from this factor-substitution effect by examining multifactor productivity growth, which controls for different rates of growth of factor inputs. Multifactor productivity growth in the market sector accelerated from 0.9 to 1.8 per cent per annum between the 1980s and 1990s expansions, suggesting that there was a genuine pick-up in the rate of technological progress in the 1990s.[10]
It is of interest to see which parts of the economy account for the pick-up in productivity growth in the 1990s. Although data for multifactor productivity by industry sector are not available, Figure 3 shows labour productivity growth by industry for the two most recent economic expansions. Faster labour productivity growth in the 1990s is a widespread phenomenon – it occurs for most of the industries in the market sector of the Australian economy.
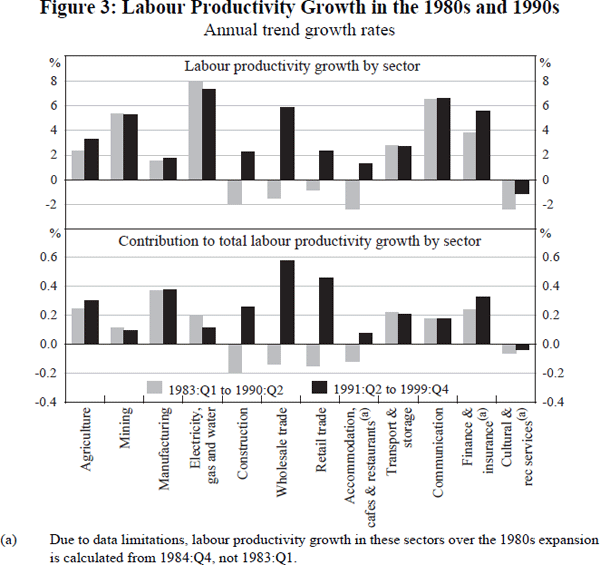
Interestingly, the sectors which account for the bulk of the aggregate productivity pick-up in the 1990s are not those one might have expected. The utilities (electricity, gas and water) sector experienced very rapid productivity growth in the 1990s, but no faster than the 1980s.[11] The mining and communications sectors also saw rapid productivity growth in the 1990s, but with minimal pick-up from the 1980s. The pick-up in labour productivity growth between the two expansions appears instead to be largely a phenomenon of the non-traded sector of the economy. The three sectors that make the largest contribution to the labour productivity pick-up – together accounting for more than 100 per cent of it despite contributing only 40 per cent of hours worked in the market sector – are wholesale trade, retail trade and construction.[12]
Overall then, labour productivity growth in the 1990s expansion appears to have been very strong, with the pick-up from the 1980s fairly widespread across the industry sectors of Australian economy, but particularly strong in the non-traded sector.
2.2.1 Is it the ‘new economy’?
How does the 1990s acceleration of productivity in Australia compare with that in the United States? Much has been written about a ‘new economy’ in the US – the idea that the rising importance of computers, information technology, and the internet is generating a new economic order leading, among other things, to an acceleration in US productivity growth.
Figure 4 shows a comparison of labour productivity in the market sectors of the Australian and US economies over the past thirty-five years. The Australian panel simply repeats the data shown above in Figure 2. Labour productivity growth has been more rapid in Australia than the US over most of this period. This observation is of course consistent with the idea that the US is a technology leader and that Australia has been, and remains, in a process of gradual catch-up.
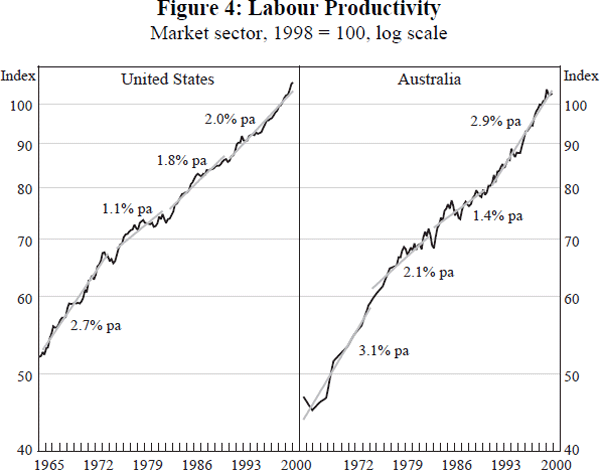
Focusing on the 1990s expansion in the US, there is very little evidence of a pick-up in market sector productivity growth until the second half of the 1990s. Furthermore, a significant part of this pick-up can be accounted for by extremely rapid productivity growth in the production of computers. Beyond that, however, there is controversy about how much the use of computers and computer-related technology has contributed to US productivity growth.[13]
There are two things that are strikingly different about the 1990s productivity pick-up in Australia compared to that in the US. The first is that the Australian pick-up occurs over the whole of the 1990s expansion rather than the past four years, as in the US (Table 3). The second is that the productivity pick-up appears much more broadly based across the sectors of the Australian economy than it is in the United States.
| Market sector | Pick-up from 1980s expansion | Manufacturing sector | Contribution of manufacturing to pick-up from 1980s Per cent |
|
|---|---|---|---|---|
| Per cent per annum | ||||
| Australia | ||||
| 1980s expansion | 1.4 | – | 1.6 | – |
| 1990s expansion | 2.9 | 1.6 | 1.8 | 3 |
| Late 1990s | 3.2 | 1.8 | 2.6 | 12 |
| United States | ||||
| 1980s expansion | 1.8 | – | 2.9 | – |
| 1990s expansion | 2.0 | 0.1 | 4.1 | 184 |
| Late 1990s | 2.7 | 0.9 | 5.3 | 55 |
| Notes: Numbers are derived by fitting trends to (log) labour productivity over the periods shown. The expansions are defined from GDP trough to peak, and therefore differ slightly between the two countries. For Australia (US), the 1980s expansion is 83:Q1–90:Q2 (82:Q3–90:Q2), while the 1990s expansion is 91:Q2–99:Q4 (91:Q1–99:Q4). Late 1990s (95:Q4–99:Q4) is the period identified by Gordon (2000) of faster trend labour productivity growth in the US market sector. Numbers differ in some cases due to rounding. | ||||
As we have seen previously in Figure 3, there has been a mild pick-up in labour productivity growth in the Australian manufacturing sector between the 1980s and 1990s expansions. But this pick-up accounts for very little of the overall pick-up in labour productivity growth in the market sector of the Australian economy (Table 3). By contrast, much if not all of the aggregate pick-up in labour productivity growth in the US market sector between the two expansions is accounted for by the pick-up in the US manufacturing sector.
The productivity accelerations in Australia and the US in the 1990s are therefore very different in kind. Australia produces very few computers, computer peripherals, or telecommunications equipment. In contrast to the US, therefore, productivity growth in Australia has been affected hardly at all by the very rapid productivity growth in the production of these goods. But there has been a big acceleration in productivity across the wider Australian economy, which appears to have occurred particularly in the non-traded sector. The 1990s Australian experience appears to be one of more rapidly approaching the technological frontier, rather than benefiting directly from the rapid productivity growth in the production of the component parts of the new economy.
An important question for Australia is how much it matters to miss out on the monopoly profits that are expected to be generated in the new-economy sectors of the US. For one thing, it remains to be seen how large these monopoly profits will be, before they are eroded away by new entrants. If past waves of technological innovation are a guide, moreover, many of the dividends from the productivity gains in the new economy are likely to ultimately accrue elsewhere – to other sectors of the US economy and to other countries. The rapid productivity growth across broad sectors of the Australian economy in the 1990s is, after all, probably an example of this process in action.
2.3 Prices
The 1990s marked a major break from the lamentable inflation performance of the 1970s and 1980s (Figure 5). CPI inflation peaked at around 18 per cent (and over 20 per cent in underlying terms) in Australia by early 1975, after the oil shock and the wage break-out of 1973 and 1974 – although even before this dual shock, it had reached 10 per cent. Macroeconomic policies generally articulated a goal of disinflation thereafter, and successive cyclical peaks were indeed lower – about 11 per cent in the early 1980s, and 9 per cent in 1985. But by the end of the 1980s inflation was still around 7 per cent, and had averaged 9 per cent over two decades. Inflation expectations remained stubbornly high.
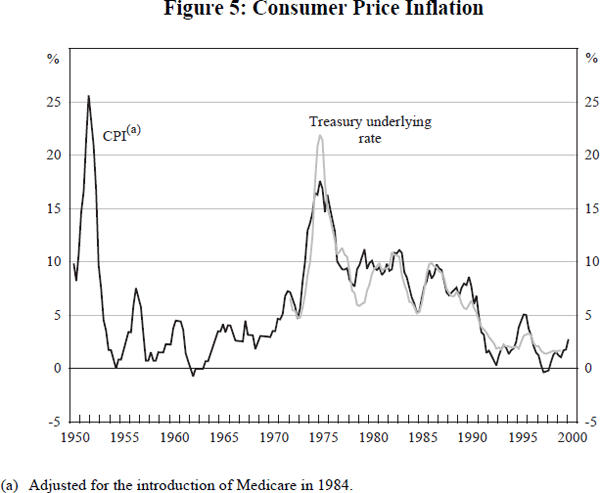
As the economy slowed and then went into recession during 1990, inflation began to fall. By the middle of 1991 it had fallen to 4 per cent. Eighteen months later, at the end of 1992, it had settled at 2 per cent in underlying terms, where it remained for a couple of years before a temporary rise in 1995 and 1996. That rise was successfully capped and reversed by an early response from monetary policy under the inflation-targeting regime introduced in 1993. Subsequently, towards the end of the 1990s, inflation ran under the target for a period.
These episodes have been treated elsewhere (Stevens 1999). What is of more interest here is the whole decade's performance, where CPI inflation averaged 2.3 per cent, the lowest average of any of the five post-war decades. This is a slight overstatement of the degree of improvement since the practice between 1986 and 1998 of including mortgage interest charges in the CPI meant that the downshift in the mean inflation rate in the 1990s, because it was accompanied by a corresponding downshift in interest rates, artificially reduced the measured rate of CPI inflation during the period of disinflation. Even excluding interest from the CPI, however, the decade inflation average of 2.8 per cent was much lower than in the 1970s or 1980s and comparable to the 1960s. Not only was the average inflation rate low, but the variability of inflation and of the price level itself around its trend were also lower than in the preceding two decades.
This was also a feature, of course, seen in many countries around the world: global inflation was lower and more stable in the 1990s than it had been in the preceding two decades. Much of this is presumably attributable to the more consistent pursuit of low inflation by policy-makers in most countries after the problems of the 1970s. Performance was also assisted, no doubt, by the fact that the large supply-side shocks in the mid and late 1970s did not recur, so that the observed transitional output cost of reducing inflation was not as great as it would have been in the 1970s.[14] Indeed, as we have seen in the previous section, the latter part of the 1990s was characterised by increasing discussion of favourable supply shocks emanating from technological advance, under the general (if somewhat ambitious) heading of the ‘new economy’.
This global environment of lower and less volatile inflation clearly must have been advantageous in achieving better outcomes in Australia. It is noteworthy, however, that the decline in average global inflation in the 1990s continued a trend which had begun in the 1980s, but that Australia had not shared fully in the fall in inflation in the 1980s: the average inflation rate in Australia in the 1980s was only marginally lower than in the 1970s. So lower global inflation, while helpful, does not necessarily translate into lower domestic inflation. Price stability begins at home.
Many observers would be quick to point out the role of structural change in the economy, particularly the lift in productivity performance in the 1990s and the opening up of product and (to some extent) labour markets to competitive forces, as contributing to sustaining low inflation. In practice, these have made the job of keeping inflation low easier – once it was decided that monetary policy should be devoted clearly to that end. This still depends, however, on monetary policy pursuing the appropriate objective. High labour productivity growth could still coincide with high inflation (indeed labour productivity growth in the second half of the 1970s was higher than in the 1980s, but so was inflation). It is also possible that policies which successfully keep inflation down prompt greater efforts to generate productivity gains across the economy, though admittedly the cross-country evidence is not very supportive of this proposition.
Surely it was the more resolute pursuit in Australia of a decline in inflation, and the determination to keep it low once it had fallen, which made the crucial difference. The use of a flexible inflation-targeting regime has been one of the success stories of Australian economic policy of the past twenty years. It can be immediately acknowledged, of course, that the international trend in this direction was influential in pushing the RBA in the direction of inflation targeting. This is discussed later in the paper. At this point, it is sufficient to record that Australian inflation performance improved dramatically in the 1990s, at the same time as economic activity continued to grow, and in a less volatile fashion at that.
2.4 Labour market
The rate of growth of Australia's working age population declined during the 1990s, due to the completion of the ‘baby boomers’ entry into the relevant age cohort, and the reduced immigration levels in place for much of the decade (Table 4). Participation rates for women also increased more slowly for most of the decade than they had in the 1980s. Hence labour force growth was much lower than in the 1980s. Employment growth, at 1.3 per cent per annum on average, was also lower, at just over half the pace recorded in the 1980s.
| 1980s | 1990s | |
|---|---|---|
| Employment growth | 2.4 | 1.3 |
| Working-age population growth | 2.0 | 1.4 |
| Labour force growth | 2.4 | 1.4 |
| Net change in unemployment rate | −0.4 | 1.1 |
| Average unemployment rate | 7.6 | 8.9 |
| – Peak unemployment rate | 10.4 | 11.2 |
In late 1989, unemployment was at a ten-year low, just under 6 per cent (Figure 6). During the following two years it rose to over 10 per cent as the economy went into recession and experienced only a relatively subdued recovery initially. By the end of 1992 it had moved over 11 per cent, a new post-war high. Pessimism about the prospects for reducing unemployment also reached new highs.
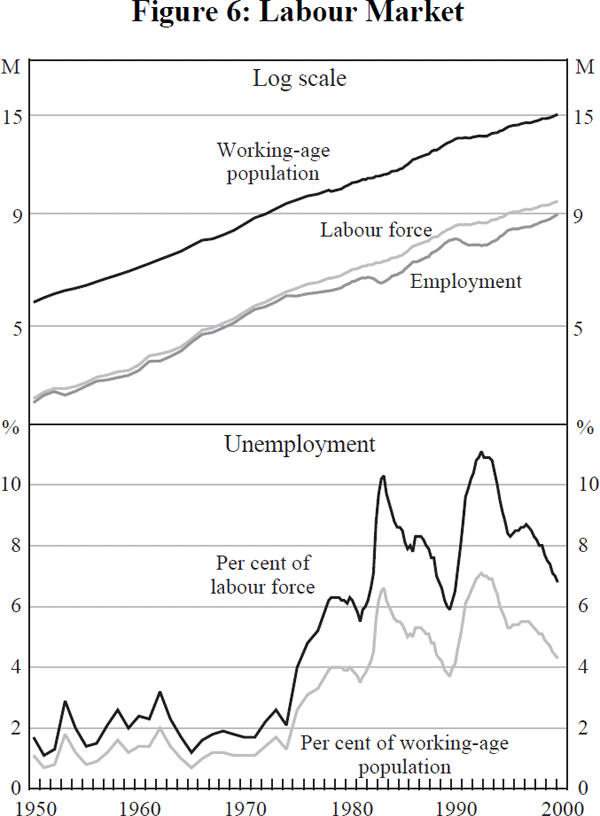
However, unemployment did begin to decline in 1994. In rough parallel to the experience of the 1980s, it fell to about 8½ per cent by late 1995, rose slightly, then began to fall again in 1997 and continued to do so until early 2000, by which time it was around 6¾ per cent. Still, the average unemployment rate in the 1990s was higher than in the 1980s.
The 1990s demonstrated again what had been seen in the 1980s and 1970s: that unemployment rises very quickly in periods of recession, and tends to fall much more slowly in recovery. A comparison with the United States is revealing. The peak US unemployment rate in the 1980s was over 10 per cent – very similar to Australian experience in 1983. But the peak 9 years later in mid 1992 was 7.8 per cent, compared with Australia's at over 11 per cent. The rate of decline in unemployment after the early 1990s recessions in the two economies was almost identical. Even recognising the more flexible, and more brutal, nature of the US labour market, and leaving aside the question of whether or not the very low unemployment rates reached in the US in the past couple of years will be sustained, one observation stands out. It is that a major part of the difference between the two experiences is simply that the early 1990s recession in the US was relatively shallow, and in Australia (at least in its labour-market dimension), relatively deep. Avoiding deep downturns, even if shallow ones cannot be avoided, appears to make a large difference to the time path of unemployment rates. There is at least the hope that in this respect, the first decade of the twenty-first century might turn out to be a much better one for the labour market than the 1990s. Further issues in the labour market are taken up in Peter Dawkins' paper in this volume.
2.5 The balance of payments
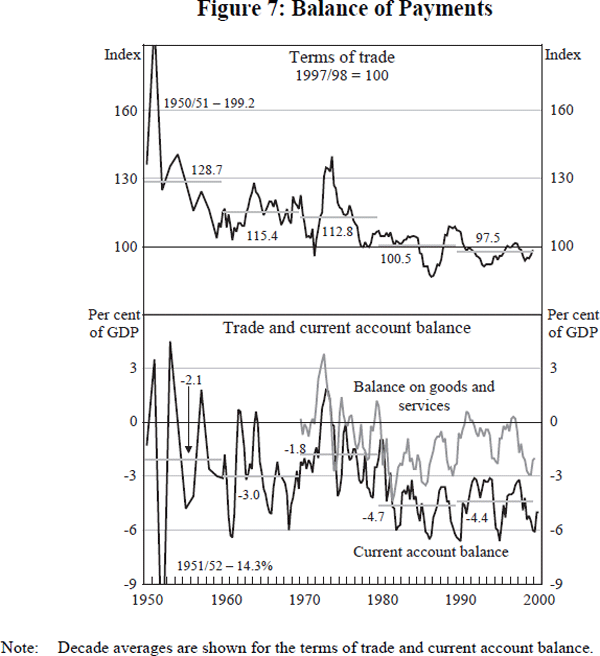
Figure 7 and Table 5 summarise the key developments in Australia's balance of payments over the past five decades. Even though the 1960s and early 1970s turned out to be a relatively benign period on average for Australia's external accounts, there were quite large swings. The secular decline in the terms of trade is apparent, something which continued in the 1990s.
| 1970s | 1980s | 1990s | |
|---|---|---|---|
| Exports of goods and services | 5.3 | 4.1 | 8.1 |
| – Resources | na | 5.7 | 6.7 |
| – Rural | na | −2.4 | 7.0 |
| – Manufactured | na | 8.9 | 12.2 |
| – Services | 4.5 | 6.3 | 7.8 |
| Imports of goods and services | 3.3 | 6.6 | 6.5 |
| – Consumption | na | na | 7.4 |
| – Capital | na | na | 10.1 |
| – Intermediate and other(a) | na | na | 7.0 |
| – Services | 3.6 | 6.5 | 2.2 |
| Balance of trade(a)(b) | 0.0 | −2.1 | −0.9 |
| Current account(a)(b) | −1.8 | −4.7 | −4.4 |
| (a) Excludes RBA gold transactions. (b) Per cent of GDP: average for decade. |
|||
As has already been noted, however, the terms of trade were less volatile in the 1990s than they had been in earlier decades. Moreover, while they were lower on average than in the 1980s, the extent of the decline was smaller than had to be absorbed in the 1980s.
The figure also shows the trade and current account balances. On the back of very strong growth in export volumes, the trade deficit declined significantly on average in the 1990s. The average rate of growth of export volumes in the 1990s was the highest of any post-war decade. Growth in manufactures and services outpaced that of the more traditional resource and rural products (although this was also true in the 1980s). The Asian crisis, together with the ensuing decline in global growth and a small fall in the terms of trade, resulted in a loss of export income equivalent to 2–3 per cent of a year's GDP. As of the time of writing, it was apparent that a strong recovery in exports was under way. Whether this will be sufficient to make up the earlier loss, restoring the trade balance to its earlier trend, remains to be seen.
The current account deficit averaged around 4½ per cent of GDP in the 1990s, much the same as its 1980s outcome.[15] Cyclical fluctuations have been of the same order of magnitude across the two decades, with about 3 and 6 per cent of GDP defining the lows and highs. The capital flows which were the counterpart of the current account deficit changed in nature in the 1990s, with much more in the way of equity inflows, and less in the form of debt flows. At times in the 1980s, in contrast, debt flows had more than funded the current account deficit, with net equity outflows being observed. The occurrence of the Asian crisis did not appear to affect adversely Australia's access to international capital markets, and capital flows actually increased at that time (not without a decline in the exchange rate of course), with Australia apparently having some ‘safe haven’ status despite the expected effect on exports.
Few observers in 1980 would have considered it likely that a current account deficit of 4½ per cent of GDP could be sustained for two decades. The fact that it has been – admittedly not without some exciting moments – has itself changed the nature of debate about the current account. That debate is taken up in some detail below.
2.6 Finance
A feature of the 1990s was the way in which the older discussion of monetary and credit aggregates waned. Milbourne's paper for the predecessor to this conference in 1990 contained extensive discussion of the financial aggregates. Much of the RBA's published work in the mid and late 1980s focused on the aggregates, as even after the demise of monetary targeting there was a need to demonstrate rigorously the case that the demand for money had become unstable.[16] Around the turn of the decade, there was much attention on credit and the linkage to asset prices, and on the role of these dynamics in exacerbating the cyclical downturn in 1990. But by the mid 1990s, with the clearer focus on inflation targeting, and the restructuring of corporate balance sheets well advanced, attention on the aggregates tended to wane.
There were, however, some important financial developments in the 1990s. The balance sheet of the household sector, in particular, changed dramatically in size and composition.
The change in size is illustrated in Table 6 and Figure 8, which show the ratio of gross household wealth to annual disposable income for the household sector.[17] For many years, this ratio was about four. By the end of the 1990s it had risen to almost seven. Similar trends are observable in the United States and the United Kingdom. Household debt burdens also rose sharply in the 1990s, from levels which (relative to income) were well below those in comparable countries, to levels which were much more in the middle of the international pack.
| 1979 | 1989 | 1999 | |
|---|---|---|---|
| Gross wealth % of income |
362 | 487 | 683 |
| Proportion of: | |||
| – Dwellings | 62 | 60 | 60 |
| – Financial | 29 | 34 | 36 |
| of which: | |||
| – Equities(a) | 5 | 10 | 18 |
| – Currency and deposits | 14 | 12 | 9 |
| – Other financial | 9 | 12 | 9 |
| – Other | 9 | 7 | 4 |
|
(a) Includes equity held in life and superannuation funds. Source: ABS Cat No 5232.0; CBA/HIA; RBA staff estimates |
|||
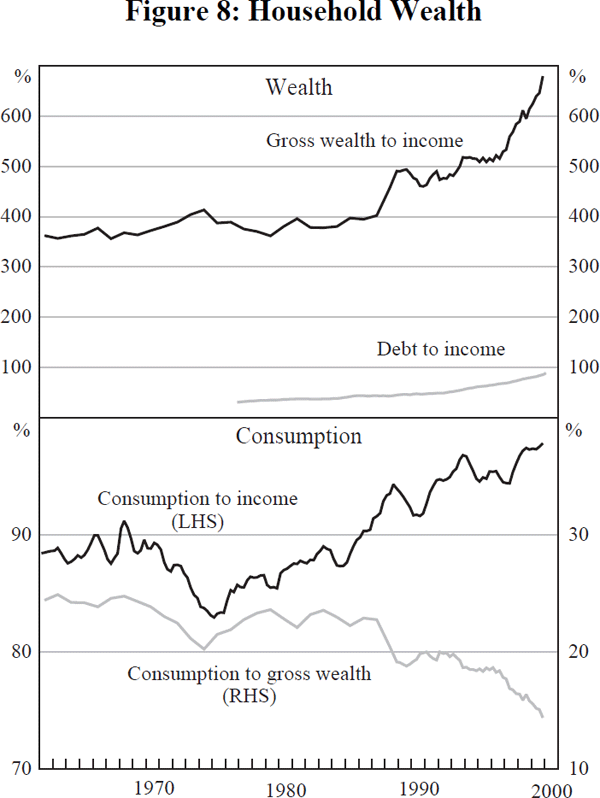
The forces at work in driving these trends, in the Australian case at least, were financial deregulation, competition and innovation, and the decline in inflation. Privatisation also played a role. After the rise in corporate leverage in the 1980s, business debt levels were reduced in the 1990s, and banks spent the early years of the decade trying to restore asset quality. But Australian households, under-geared by international standards, represented a major opportunity for profitable balance sheet growth. The decline in inflation, by bringing interest rates down to levels not seen in a generation, made mortgage borrowing much more affordable. This allowed an increased number of borrowers to pass the standard sorts of repayment-to-income-ratio tests for borrowing, and also meant that existing borrowers could service substantially larger loans. With this demand-side incentive, and the supply-side willingness of lenders, not to mention increased competition from new entrants in the housing loan market, it is not surprising that there was a very substantial lift in household debt in the 1990s (Stevens (1997) and Gizycki and Lowe (this volume) provide more detail on this).
But as the data show, assets increased as well, and household net wealth rose strongly across the decade. A good portion of this increase came in the form of higher house prices late in the decade, the counterpart of freely available and low-cost credit. Other assets also increased, however, with financial assets increasing at a faster rate than tangible assets. This reflected the impact of privatisations of major publicly owned corporations, which introduced large numbers of Australians to direct share ownership for the first time and pushed the proportion of the adult population with direct share ownership to over 40 per cent, one of the highest rates in the world. There was also an increasing tendency for individuals to own shares directly anyway, as the low interest rates available on conventional assets like bank deposits prompted the search for higher yield by savers. As a result, the share of equities in total financial assets increased noticeably, while that of deposit instruments declined.
Compared with the United States, the run-up in the value of equity holdings was smaller in Australia. Nonetheless, there have been echoes of the US debate in Australia, with wealth gains commonly thought to have affected consumption trends, and the likelihood that balance sheet impacts will be more important in the future than they have been in the past, simply by virtue of their greatly increased size, and factors such as the enhanced capacity to borrow against previously locked-up collateral in the housing stock.
3. The Debates
3.1 Monetary policy
The nature of debate about monetary policy has changed considerably in the past ten to fifteen years. In the 1990 conference, monetary policy in the 1980s was discussed in some detail by Milbourne. Re-reading that paper, one is struck by the extensive discussion of the impact of financial liberalisation and innovation, and the complexities that it brought for monetary policy. These developments were the dominant feature of the policy environment and discussion of the 1980s.
The prevailing monetary policy framework in operation in the first half of the 1980s was that of monetary targeting, which had been in place since 1976. The regulation of interest rates and exchange rates in the 1970s and early 1980s meant, however, that the stock of money could not be adequately controlled. It was driven by the vagaries of capital flows, and administrative decisions on interest rates on government securities. These at times made it impossible to keep financial conditions where they needed to be to achieve monetary policy goals.
Deregulation of the key financial prices – interest rates on government debt, and the exchange rate – in the 1980s gave the Reserve Bank the capacity to control the cash market much more effectively. But the extensive liberalisation agenda also led to large changes in the behaviour of financial institutions, which were now freed of many of the old administrative restraints, and were also facing increased competition from new entrants. There was also a change in the behaviour of the non-financial private sector, particularly the corporate sector, whose appetite for leverage increased dramatically. This inevitably meant large shifts in the relationships between the financial aggregates and the economy. Hence even as the RBA finally gained effective instruments, the strategy of targeting M3 broke down.
At the same time, a floating exchange rate came with its own issues. In early 1985, having just abandoned the M3 target in the face of the shifting financial relationships, monetary policy was confronted with a crisis of confidence in the Australian dollar, something which recurred periodically for some time. The Australian Financial Review's 9 April 1985 headline, ‘Australia's Monetary Policy Confusion’, gives something of the flavour of the times.
It is no surprise, therefore, that there was much discussion in the second half of the 1980s and the first few years of the 1990s about the impact of deregulation, the struggle of the monetary authorities to cope with it, and the possible alternative strategies which might be employed in response to it. Coming to terms with a floating exchange rate in particular, which could at times be subject to very large movements, required adjustments both by the authorities and by those involved in economic activities which were exposed to the outside world.
This was a period of transition from the idea that monetary policy proceeded by directly controlling some sort of quantity, with financial prices endogenous, to the notion that it proceeded by using the short-term interest rate as the instrument, with the financial quantities endogenous in the short to medium term (see Grenville (1997)). This appeared to take longer to be accepted in mainstream Australian discussion than it apparently did in most other places. Admittedly, it was not until the late 1980s that the Reserve Bank clearly articulated this view of the process (Macfarlane and Stevens 1989, Grenville 1990).
At the same time, there was a tension in the 1980s between two ideas. The first, based on the main insight of two centuries of monetary economics, was that monetary policy ultimately determined inflation. The quantity-theory version of this view had been the intellectual underpinning of monetary targeting. The other was the long-standing tradition in Australian economic policy-making and many academic circles that wages outcomes were the proximate determinant of prices, and that wages could be influenced independently of monetary policy. Australia's industrial relations arrangements contributed to this view, and economists trained in the 1970s learned of the ‘four arms’ of economic policy, of which wages policy was one. (Exchange rate policy, at the time of the fixed exchange rate, was another.)
Even among those inclined to be critical of monetary policy for being too lax or inconsistent, this view was often central. In the issue of the AFR which carried the ‘confusion’ banner quoted above, the editorial lamented at length the course of the Australian dollar and the failures of monetary and fiscal policies. It then concluded by saying that ‘… in the end, the key is wages policy’.
This tension is evident in Milbourne's 1990 paper, and it is notable that in that same conference, there was an entirely separate paper (Carmichael 1990) on inflation. ‘Money and finance’ were often discussed quite separately from inflation outcomes. Carmichael offers a reconciliation between the ‘money’ view of inflation and the ‘wages’ view, in which monetary policy accommodates the inflation stemming from wage outcomes. In this view of the world, the wages Accords of the 1980s, at the heart of the Hawke Government's economic strategy, determined the rate of wage and price expectations. Actual inflation could be made to differ from this by monetary policy, but only by having substantial impacts on output, monetary policy not having any independent capacity to affect expectations (and not being invited to attempt it).
In the 1990s, this view of the world gradually gave way to one in which inflation was seen as the specific responsibility of monetary policy. This reflected partly the global intellectual shift towards inflation targeting, but also the shift in wages policies towards microeconomic, rather than macroeconomic goals, and the reduced emphasis on centralised wage setting. The extent of the contrast with the mid-1980s view of the world can perhaps be seen most clearly in the outcome of the 1997 Safety Net Review, conducted by the Australian Industrial Relations Commission. The prospect that monetary policy would respond to large wage increases which threatened inflation performance appears to have had a major impact on the decision.[18]
In the wake of the early 1990s recession, the debate about monetary policy became even more intense. Recessions tend to cause reconsideration of all manner of policies. The theme of deregulation and its effects continued through this discussion, since the distinguishing feature of the late 1980s boom and subsequent slump was the role of asset prices, accommodated by rapid credit expansion by newly-liberated intermediaries, despite exceptionally high real interest rates almost all the time in the second half of the 1980s (see Macfarlane (1989), (1990)). That discussion did not turn back deregulation, but did result in much more attention being given to prudential supervision in the 1990s (see Gizycki and Lowe (this volume) for more details on this).
The discussion in this period widened, however, beyond the quasi-technical issue of the effects of deregulation, to focus on the overall framework of monetary policy, including issues of the appropriateness of multiple objectives, the structure and governance of the Reserve Bank, and its independence. Many criticisms in this period appear to have been motivated by a genuine frustration with perceived failures of policy, particularly as regards inflation control, over a long period. These critics were not convinced that the decline in inflation which accompanied the recession could be sustained without far-reaching reform of the Bank. Some commentators remained suspicious that monetary policy had not really pursued an anti-inflation strategy at all in the late 1980s and early 1990s, and had paid too much attention to the balance of payments, to the detriment of more appropriate domestic goals (an issue we return to in the next section).
Hence there was great debate in academic circles. A whole issue of the Australian Economic Review was devoted in 1990 (Creedy 1990) to publishing papers from a conference on monetary policy. Among a range of reasonably conventional papers, monetary-base targeting was advocated by McTaggart and Rogers (1990), on the grounds that this would lessen an apparent (and in their view inappropriate) positive relationship between the money stock and the terms of trade. Monetary-base targeting was an idea with a very respectable pedigree amongst academic economists, but was actually practised at that time only by the Swiss National Bank (which has in recent years adopted an inflation target instead). Hence in Australia it has tended to be regarded as rather radical. But in another conference, with the less than even-handed title ‘Can Monetary Policy be Made to Work?’, organised by the Institute for Public Affairs in December 1991 (Moore 1992), monetary-base targeting was one of the least extreme proposals on offer. The more adventurous ones included a currency board (modelled on a program being developed for Albania by, inter alia, Steve Hanke (Hanke, Porter and Schuler 1992)), and free banking – no central bank, but competitive moneys offered by private banks (presumably including the same ones which had made the disastrous corporate loans of the 1980s). Edey (1997) discusses these ideas in more detail. They never gained serious support, but the fact that they were raised in respectable circles at all only nine years ago seems remarkable now.
In political and policy-making circles, more attention began to be given to the model which combined an inflation target and clear central bank independence. In New Zealand, the Reserve Bank was undergoing very substantial changes to its structure and mandate. Both there and in Canada, the idea of an explicit, numerical inflation target took shape, and was implemented. The goal was set by the government, but with the central bank given complete operational independence in pursuit of that agreed goal. Such regimes were producing declines in inflation in those countries – though admittedly inflation was declining almost everywhere else as well. Inflation targeting became more appealing through the 1990s, as a number of countries one by one found the alternative anchors, and the prospect of completely unconstrained discretion, unsatisfactory.
In Australia in the early 1990s, inflation was also falling rapidly, a result of determined application of monetary policy. But inflation had also fallen in the early 1980s, only to rise again, so the question was whether the decline could be sustained. In the minds of many sceptics, the result was an accidental by-product of policies really directed at other goals. In the event, inflation continued to fall and remained low, and without any change to the RBA's charter or structure. There was, however, a gradual shift towards an inflation-targeting model. This began in March 1993 when Bernie Fraser as Governor gave a speech within which the outlines of the ‘2–3 per cent over the course of the cycle’ inflation target can be seen (Fraser 1993). As time went by, the target was progressively firmed up, endorsed by Treasurer Willis and then endorsed much more explicitly by the present Government. The target formulation was of the Bank's choosing to start with, and therefore it gave some weight to the reservations about the apparent narrowness of the other models on offer at the time. This was initially at the cost that it took longer to build credibility for the regime, but had the benefit of conferring an appropriate degree of flexibility. Stevens (1999) gives an account of Australian experience with inflation targeting. As argued earlier in this paper, the stronger anti-inflation focus from the late 1980s, developing into the inflation-targeting framework since 1993, has made an important difference to the inflation performance, and a tangible difference to economic performance more generally.
Issues of independence of the RBA also came to the fore in the 1990s, especially as the conduct of monetary policy became hotly contested in the political arena between 1990 and 1993. The importance of the principle of independence was never in dispute; what was at issue was how independent the RBA had been in practice. Proposals for changing the charter to a sole focus on inflation, and strengthening the Board's independence emerged from various quarters. These issues are taken up at some length in Macfarlane (1998). As it turns out, the structure and governance of the Bank remains unchanged, from the time of its inception in 1960. The degree of formal independence has not changed, although the extent of the perception of independence has increased greatly.
There was still a measure of debate about monetary policy at the end of the 1990s, but its nature was completely different to that of ten years earlier. The focus was no longer on deregulation, and its effects on money and credit, against a backdrop of the centrality of wages policy in thinking about the inflation outlook. Nor were the role of monetary policy in controlling (or not) the current account, or the Bank's bona fides on inflation any longer hotly contested issues. The more extreme ideas which intruded to an unusual extent in the early 1990s had lost force.
The more recent discussions have been conducted on the assumption that monetary policy is and should be set within an inflation-targeting framework, that the Bank is independent of the Government in adjusting interest rates in pursuit of the target, and that interest rates are the instrument of policy. Critics of monetary policy in recent times tend mostly to have made a different judgment to the Bank's on the necessity of a policy adjustment. To be sure, some debate still continues about the amount of detailed information (such as forecasts, Board minutes etc) the Bank should or should not release, and there is the occasional foray into governance issues. But no mainstream commentators appear to be saying that the whole framework is inadequate and needs replacement, or that the Bank's decisions are politically motivated. This seems a long way from the debates of ten years ago. Of course, should there be unexpected turbulence for the economy at some future time, things may well change.
3.2 The current account and foreign deb
3.2.1 The 1980s: rising concerns
One of the enduring features of the economic landscape over the past fifteen years has been the debate about the current account deficit and the growth of Australia's foreign debt. In this section, we discuss this debate and offer some reflections on how it evolved in the 1990s. We begin however with the 1980s, the decade in which the foreign debt debate took shape.
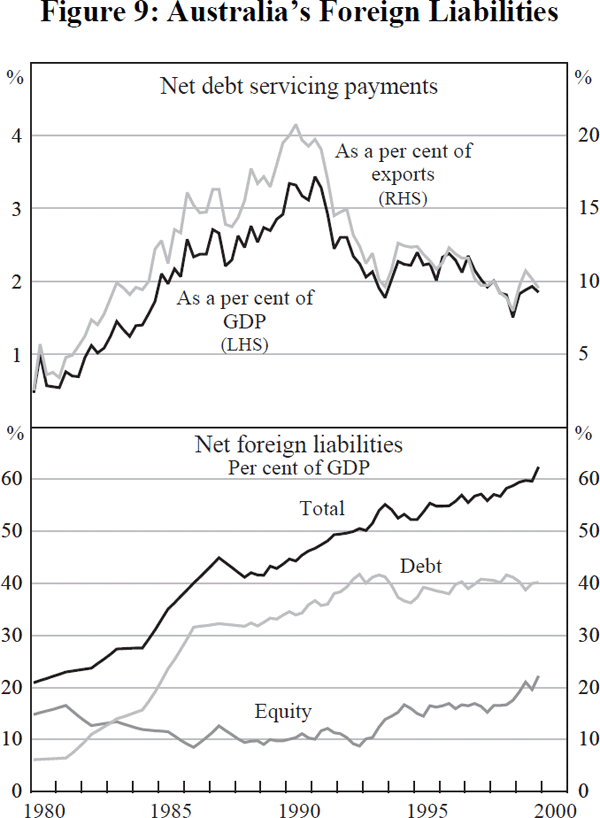
One of the early warnings that the debt build-up might have serious implications was issued by the then Head of the Department of Treasury, John Stone, in his 1984 Shann Memorial Lecture ‘1929 and All That …’. Stone used the lecture to compare Australia's predicament at the time with the predicament discussed by Shann in the years leading up to the Great Depression. While Stone's remarks might have been thought to be unduly alarmist at the time, the debt debate did grow in intensity over the next few years as events conspired to convince many observers that the implications of the debt build-up might indeed be serious. Over eighteen months from the beginning of 1985, the terms of trade fell significantly, and the currency depreciated by 40 per cent in trade-weighted terms. The current account deficit, which had averaged 4¼ per cent of GDP over the first half of the 1980s, widened to 5½ per cent in 1985 and 5¾ per cent in 1986. With the deficit financed primarily by borrowings rather than equity, the stock of foreign debt and debt servicing ratios rose sharply (see Figure 9).
Worsening assessments of Australia's credit worthiness by the two main international credit rating agencies, Moody's and Standard and Poor's, added to the general level of concern. Australian Commonwealth Government debt had long been rated AAA by both organisations. Between September 1986 and October 1989, however, both agencies twice lowered the long-term foreign-currency debt of the Commonwealth Government, to Aa2 and AA.
According to some, Australia risked becoming a ‘banana republic’, a phrase made famous in the Australian context in an impromptu interview on commercial radio by the then Treasurer, Paul Keating, in May 1986. From around that time to the end of the 1980s and into the 1990s, there was a broad consensus – encompassing the whole political spectrum, and shared by policy-makers, economic commentators, business leaders, and the wider community – that the current account deficit and the growing stock of foreign debt represented the most serious economic problem facing Australia.[19] Reports were written by a range of organisations, diagnosing the problem, and suggesting solutions.[20]
Given the perceived seriousness of the foreign-debt problem, there was also a broad consensus that all arms of economic policy needed to play a role in responding to it. In a renegotiated Prices and Incomes Accord with the trade union movement, award-based superannuation was introduced to contribute to private saving, and a 2 per cent fall in centrally determined real wages was agreed to reduce the inflationary implications of the exchange rate depreciation. Fiscal policy was tightened progressively, with the general government underlying balance moving from a deficit of 3½ per cent of GDP in 1983/84 to a surplus of over 1 per cent by the end of the decade in 1989/90.[21] There was also a widely held view that tighter monetary policy was part of the appropriate response to the external imbalance.[22]
Towards the end of the decade, however, the idea that large current account deficits and the associated build-up of foreign debt were matters of concern that required a public policy response faced an intellectual challenge. In the Australian context, the challenge was mounted primarily by John Pitchford (1989a, 1989b, 1990) and subsequently Max Corden (1991). Pitchford and Corden began with the accounting identity linking the current account deficit to the excess of investment over saving in the private and public sectors. Private-sector investment and saving decisions, it was argued, were made by consenting adults, who would either reap the benefits or incur the costs of those decisions. Public-sector decisions, and the resulting fiscal balance, should be judged on their own merits, rather than in terms of their influence on the current account. If large deficits were a symptom of distortions in the economy, the distortions should be tackled at their source, rather than providing an excuse to use monetary or fiscal policy to influence them. There should be no presumption that large current account deficits were either good or bad.
When these ideas were first presented, they were treated as academic, in the pejorative sense of the word.[23] But they gradually became more influential. Although many commentators continued to disagree with the policy implications of the consenting-adults view, the debate was increasingly conducted in the terms in which it had been set out by Pitchford and Corden.
3.2.2 The 1990s: the dog that didn't bite
Concern about the current account and Australia's foreign debt probably reached a peak at the beginning of the new decade. At times during the 1990s – especially when the deficit was rising as a proportion of GDP – the debate was again intense, but there were gradual shifts of view and refinements of argument.
An important early shift was in the analysis of the appropriate role of monetary policy. As previously discussed, Pitchford (and later Corden) had challenged the view that had been broadly held in the late 1980s that monetary policy (along with other policies) should be tightened in response to the external imbalance. Around the turn of the decade, the Reserve Bank publicly acknowledged the intellectual force of this challenge (although not the wider implications of the consenting-adults view). In the Bank's 1989 Annual Report and in two speeches delivered in September 1989 and June 1990 by the then Deputy Governor John Phillips, it was argued that monetary policy's appropriate role was to establish low inflation, and that any structural imbalance in the balance of payments was a result of the ‘community's attitudes to savings, consumption, investment and debt’ (Phillips 1989, 1990). As such, it was not a problem that could be ‘targeted directly by monetary policy’. This position generated considerable controversy on the second occasion on which Phillips presented it (though curiously, not on the first) but in time it became more generally accepted.[24]
By the early 1990s, there had been ample opportunity for anyone so inclined to come to an informed view about the foreign debt build-up. Those who were concerned about the build-up argued that with no significant fall in the current account deficit, the rising debt burden would generate rising vulnerability to the possibility of a loss of confidence by foreign investors. They pointed to an apparent rise in the risk premium on Australian assets such as 10-year government bonds and the downgrades by credit-rating agencies to argue that foreign investors were becoming increasingly concerned. Some also argued that the current account was imposing a constraint on the rate at which the Australian economy could grow, or would be allowed to grow.[25]
As it turned out, economic outcomes over the remainder of the 1990s were much more favourable than might have been expected, especially by those who were most concerned about the debt build-up. From the trough of the recession in 1991:Q2 to the end of the decade, annual output growth averaged just over 4 per cent, with little sustained change in the current account deficit. If the external accounts were imposing a constraint on growth, it was not a very severe one.
Furthermore, necessary adjustments were taking place in the economy. The real exchange rate in the 1990s was more than 10 per cent lower in trade-weighted terms than it had been in the 1980s, and this was generating a transfer of resources into the traded sector. Exports of goods and services over the 1990s grew at more than twice the rate of economic output, and in contrast to the 1980s, significantly faster than imports (see Table 5).
There was also a sharp turnaround in the method of financing the current account. Debt financing had dominated the 1980s, but this was largely replaced by equity financing in the 1990s. As a consequence, although the ratio of net external liabilities to GDP continued to rise through the 1990s, the net external debt ratio did not; it remained at about 40 per cent of GDP from 1992 to the end of the decade (see Figure 9). This no doubt reduced the vulnerability of the domestic economy to external shocks, since the cost of servicing equity investments tends to vary with domestic profitability, and so more closely reflects the economy's capacity to pay.
After the two downgrades by both Moody's and Standard and Poor's in the late 1980s, there were no further downgrades of Australian Commonwealth Government debt by either agency. Indeed, there was an upgrade by Standard and Poor's in May 1999 to AA+. Perhaps more importantly, however, it became increasingly clear how little information was revealed about a country's vulnerability to possible future changes in foreign-investor sentiment by its credit rating.[26]
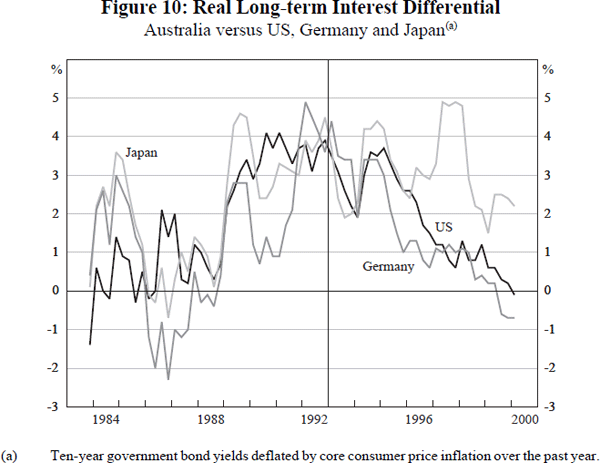
Nevertheless, while credit downgrades might not provide much information about future vulnerability, they might be associated with a higher cost of borrowing in international capital markets. As previously mentioned, many commentators argued that Australia was being forced to pay a sizeable risk premium on borrowings as a result of the debt build-up. For example, FitzGerald (1993), in his report to the government on national saving, provides estimates of the real interest differential between 10-year bonds in Australia and in the G3 countries, United States, Germany and Japan, which certainly suggest a sizeable risk premium on Australian long-term bonds in the few years leading up to the end of his sample in 1992.
Figure 10 shows an updated version of the figure presented by FitzGerald (p 13) in support of this argument.[27] With the benefit of an extra seven years of data, a rather different conclusion emerges. Although Japan is an outlier (presumably for domestic Japanese reasons) it is much less clear that Australia has been paying a sizeable risk premium as a consequence of the external debt build-up. By the end of the 1990s, the real yield on A$-denominated bonds was roughly the same as those on German and US bonds. A more natural explanation for the relatively high Australian real bond rates in the early 1990s, and their subsequent fall, is that markets took a long time to be convinced that the step-down in inflation at the beginning of the decade would be sustained.[28]
In coming to a view about Australia's vulnerability to external shocks, the Asian financial crisis was also a revealing event. Of the countries severely affected by the crisis, two had run significant current account deficits in the years leading up to the crisis, and two had not.[29] But it is clear that current account deficits were not an important reason for the crisis. The countries had serious domestic vulnerabilities not present in Australia; in particular, large stocks of unhedged foreign borrowings in combination with the nature of their corporate governance and financial systems. There were, undoubtedly, also self-fulfilling elements to the crisis as market euphoria turned to panic. But the serious domestic vulnerabilities meant that, when the currency pegs collapsed, the resulting exchange rate depreciations generated widespread bankruptcies and savage recessions, rather than expanding domestic activity as was the case in Australia.
As the crisis intensified, there was less appetite for risk on the part of international investors, and risk premia on bonds issued by developing countries – even those with no links to East Asia – rose dramatically. Australia was, however, treated as a safe haven. The current account deficit widened by over 2 per cent of GDP from mid 1997 to mid 1999, but this was treated with equanimity by capital markets and yields fell on A$-denominated bonds. There were no signs of enhanced Australian vulnerability, at least from this external shock.
The recent academic literature has also not been particularly kind to the idea that high current account deficits or foreign-debt exposures necessarily increase a country's vulnerability to crisis. In a survey of 28 empirical studies on currency crises, Kaminsky, Lizondo and Reinhart (1998) uncover a series of economic indicators that receive support as indicators of impending crisis. These include an overvalued real exchange rate relative to trend, rapid credit growth, and indicators of banking sector problems. They observe (p 12), however, that ‘variables associated with the external debt profile [do] not fare well. Also, contrary to expectations, the current account balance [does] not receive much support as a useful indicator of crises’ [emphasis in the original].[30]
Most of the studies surveyed by Kaminsky et al focus on the collapse of fixed exchange rate regimes, or exchange rate bands of one sort of another. Most examine the experience of developing rather than industrial countries. We should therefore not overstate the relevance of such work for Australia. Nevertheless, it is still of interest that high current account deficits and/or high levels of external indebtedness do not systematically seem to signal enhanced vulnerability to crisis.
A final point about countries with large external debts. These are, of course, countries to which international investors have lent large quantities of funds. In many cases, this is because the countries have a range of characteristics – macroeconomic, microeconomic and regulatory – that inspire the confidence of investors. Without these characteristics, the countries might not have been able to build up their large external debts in the first place. But these characteristics also render these countries more able to adjust to shocks; that is, they reduce the countries' vulnerability to crisis. It should therefore not come as such a surprise that high levels of external indebtedness are not good indicators of enhanced vulnerability to crisis.
To conclude then, the current account debate in Australia never completely went away over the course of 1990s, but its intensity gradually subsided. The current account deficit showed no sustained improvement over the decade, with its average ratio to GDP almost as large as it had been in the 1980s. Nevertheless, at no time in the 1990s did the predictions of those most pessimistic about the current account look like they would be realised. The economy grew strongly and by many measures, Australia's vulnerability to possible changes in sentiment by foreign investors declined over the course of the decade.
Notwithstanding the favourable experience of the 1990s, however, we can still pose the question: Is Australia significantly more vulnerable to external shocks because of the foreign debt build-up? Perhaps the right answer remains the one attributed to Chou En Lai when he was asked his opinion of the French revolution: ‘It is too early to say’. It may still be true that the foreign debt build-up is of concern because, were there to be a serious domestic policy mistake or political instability at some time in the future, the associated costs could be much higher than would otherwise be the case. Nevertheless, we can at least say that the 1990s experience has been kind to the consenting-adults view of the current account.
3.3 Fiscal policy
In the immediate aftermath of World War II, Australia had a large stock of government debt, amounting in gross terms to more than 100 per cent of GDP. This ratio declined rapidly over the next several decades, mainly as a consequence of prudent fiscal policy until the mid 1970s, but also because of a period of unanticipated inflation in the 1970s. By 1980, the net debt of the Australian general government sector had fallen to about 10 per cent of GDP.[31]
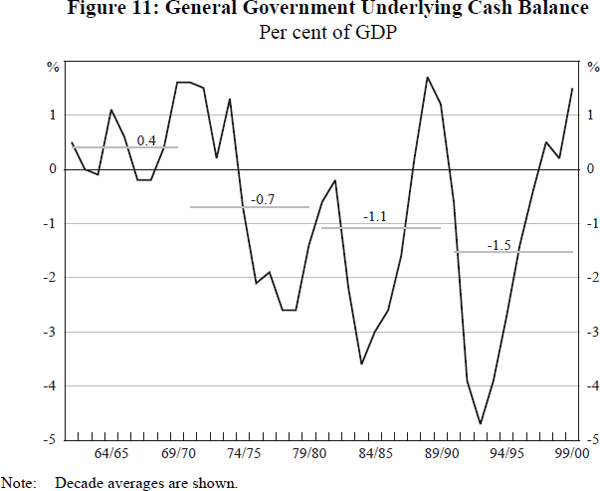
During the 1980s, a further significant deterioration in the fiscal accounts associated with the recession early in the decade occurred, followed by a long period of consolidation culminating in fiscal surpluses at the decade's end. This pattern was repeated, at least in rough outline, during the 1990s (see Figure 11). The net effect of these cycles in the fiscal balance over the two decades was that general government net debt in 1990 and again in 1999 was largely unchanged from its 1980 level of about 10 per cent of GDP.
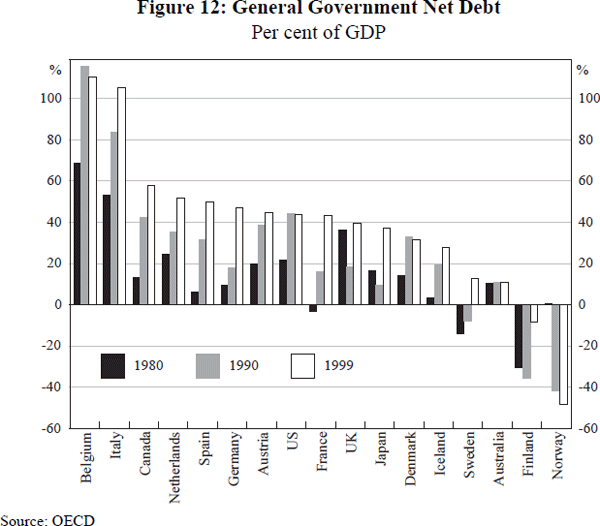
The maintenance of low levels of government net debt over the past two decades is quite unusual by international standards. Figure 12 shows snapshots of the level of general government net debt for 17 OECD countries including Australia in 1980, 1990 and 1999. Australia is right in the middle of the international pack in 1980, with eight of the countries shown having lower ratios of net government debt to GDP, and eight higher. By 1999, however, only Finland and Norway among this group of countries have lower ratios of net government debt than Australia. The two extended periods of fiscal consolidation in the latter halves of the past two decades have meant that Australia has not experienced the significant fiscal deterioration suffered by many other industrial countries over this time.
In discussing Australian fiscal policy in the 1990s, it is convenient to separate its role as a counter-cyclical tool from analysis of its medium-term focus. There is general agreement that fiscal policy's automatic stabilisers should and do play an important counter-cyclical role. But beyond that, there has been growing disillusionment, both in Australia and elsewhere, about the capacity of discretionary fiscal policy to be genuinely counter-cyclical. The problem is not the transmission lag. Indeed, changes to fiscal policy, once implemented, should be expected to have a quick impact on economic activity – probably quicker than the impact of monetary policy. This is particularly true of changes to government expenditure, which feed directly into economic activity.
The problem, as has been widely understood, is instead the implementation lag. Fiscal policy is implemented, predominantly, on an annual cycle, with the timetable determined by the calendar rather than the state of the economy. Even in circumstances in which governments decide to provide a fiscal boost to the economy, the process of deciding exactly which expenditures and taxes to change, having the changes passed through the Parliament where that is necessary, and implementing them, leads to inevitable delay. For example, the Federal Government's main fiscal initiative in response to the early 1990s recession, One Nation, was announced in February 1992, when the economy was in its third quarter of expansion following the recession, but still growing quite slowly. While there were some small spending initiatives in the package that began immediately, the bulk of them were implemented in the following financial year, 1992/93, and beyond. They therefore came into effect when the economy had begun to expand robustly (growth over the 1992/93 financial year was 4.2 per cent, and over the 1993/94 year, 4.7 per cent).
In contrast, monetary policy could, subject to the medium-term inflation target, respond counter-cyclically. Monetary policy decisions could be made and implemented quickly, even though the transmission lags were long.
These perceived institutional disadvantages of fiscal policy suggested to some that the institutional arrangements for implementing it should be changed so that it could play a more effective counter-cyclical role. This suggestion had been put forward by Larry Ball (1996) in New Zealand, Alan Blinder (1997) in the US, and Nicholas Gruen (1997) in Australia. It received more prominence in the Australian debate with the release of a discussion paper by the Business Council of Australia, ‘Avoiding Boom/Bust’, in late 1999. This paper argued that politically independent officials should be given the power to make small across-the-board changes to tax rates to deliver effective counter-cyclical fiscal policy. This suggestion generated widespread interest and discussion, although at present it appears unlikely that it will be implemented in the foreseeable future.
Aside from its counter-cyclical role, fiscal policy also has a medium-term influence on national saving. For most of the period since the mid 1980s, discussion about fiscal policy's appropriate medium-term stance has been strongly influenced by concern about the current account. Notwithstanding the consenting-adults view, there has been a broad consensus, shared by governments of both political persuasions, that sustained high current account deficits represent prima facie evidence that national saving is insufficient and that public saving should make a contribution to raising it.
This position is expressed clearly in Budget documents in the second half of the 1980s, and throughout the 1990s. At the time of the early 1990s recession, this medium-term requirement is balanced against the immediate need for fiscal policy to support economic recovery. ‘In the face of weak private sector demand, … discretionary increases in expenditure have provided a direct stimulus to activity … As private sector activity consolidates, … [f]iscal policy can … resume its important medium term role of increasing national saving and reducing recourse to foreign financing of domestic investment’ (Budget Statements 1992, p 2.59).
With recovery from recession, the medium-term task of improving the fiscal balance again becomes the dominant influence on fiscal policy. The need for this improvement is argued forcefully in the June 1993 FitzGerald report, the major report on national saving commissioned by the Federal Government. The report opens with the observation that national saving had fallen to its lowest level in the twentieth century, except in times of world war and the Great Depression. It continues (p xiii) ‘prima facie, there is cause for concern – particularly since we already have a very high foreign debt and a high current account deficit adding constantly to it. If we do not save more, then the investment necessary to ensure higher growth and more employment will only be funded by even greater recourse to foreign savings and further build-up of foreign debt’. Of particular relevance to fiscal policy, the report goes on to argue (p 16) that ‘the greatest scope for raising … national saving lies in the public sector. A concerted effort to strengthen the national public sector fiscal position is thus one of the major economic imperatives for Australia in the years ahead’.
In its response to the FitzGerald report in the 1993/94 Budget, the Federal Government committed itself to lifting public saving in the medium term and specifically to achieving a Commonwealth budget deficit of around 1 per cent of GDP by 1996/97, compared to the deficit of nearly 4 per cent that had been recorded in the 1993/94 financial year that had just ended. (As events turned out, the goal for the 1996/97 budget deficit was achieved, but under a new government.)
The bipartisan nature of the general strategy to raise public saving was confirmed with the election of the Liberal/National Coalition government in 1996. In its first budget, the new government committed itself to a medium-term fiscal strategy ‘to follow, as a guiding principle, the objective of maintaining an underlying [budget] balance on average over the course of the economic cycle’ (Budget Statements 1996, p 1–9). Assuming that this strategy is indeed maintained over the medium term, it will generate a ratio of government debt to GDP that gradually declines towards zero.[32] As had been the case earlier in the decade, the primary justification presented for this fiscal strategy was that it was the appropriate response to the sustained high level of the current account deficit.
It would be an oversimplification to argue that concern about the current account has been the only reason advanced for tightening fiscal policy and raising the level of public saving in Australia in the 1990s. The FitzGerald report, for example, also points to the need to raise national saving because of the ageing of the population.[33] And it has also been argued that improving the budget balance in good times gives fiscal policy more capacity to respond flexibly to unforseen future economic difficulties. But it would be fair to say that concern about the current account has been the primary reason advanced for raising public saving and returning gradually to a fiscal surplus through the course of the 1990s.
How one views this justification for maintaining very low levels of government debt (and further reducing them) depends on one's view about the current account. For those who do not regard the current account as a relevant consideration in determining fiscal policy's appropriate medium-term stance, there must be an alternative guiding principle. An appealing alternative is intergenerational equity. For given government spending, this principle would lead the overall level of taxes (and therefore the fiscal balance) to be set so that each generation's tax burden would (roughly) pay for the government services that it uses. Ageing of the population would be relevant to this calculus simply because taxes are mostly paid during individuals' working lives, while government services continue to be used in retirement.
This approach would, however, lead to separate treatment for current and capital government expenditures, rather than having a target for the overall medium-term fiscal balance. Government capital expenditure projects that, it is judged, would generate a social return over the life of the projects higher than the borrowing costs incurred to fund them would be undertaken, and financed out of new government borrowing. Provided one is not concerned about the implications for the current account, a cost/benefit analysis of such projects would therefore suggest that they should go ahead, despite their implications for the overall budget balance.
An alternative perspective, however, is the one discussed at the end of the previous section. Notwithstanding the favourable experience of the 1990s, Australia may still remain vulnerable to possible future changes in sentiment by foreign investors. In this view, one of the reasons Australia has maintained the confidence of foreign investors over the two decades of high current account deficits has been the fiscal restraint and discipline that has been demonstrated over this time. From this perspective, achieving continued medium-term fiscal balance and maintaining very low levels of government debt represent an appropriately prudent course of action. This approach, it could be argued, represents a small price to pay to enable Australia to continue to draw on foreign saving to fund that portion of domestic investment not funded by domestic saving, while maintaining the confidence of foreign investors.
4. Conclusion
The macroeconomic performance of the Australian economy grew progressively more impressive as the 1990s proceeded. While the decade began with a severe recession, by its close, growth had been strong and sustained for over eight years. The upswing had outlived its two predecessors. The economy had apparently become noticeably more stable than in the past. Living standards, as measured by per capita GDP, had improved at a rate not seen since the 1960s – a result shared only with Ireland among industrial countries. Public finances were, by any normal standard, in exceptionally strong shape. Unemployment rates remained high throughout the decade, but had declined by the end of 1999 by more than many would have dared hope six or seven years earlier. At the same time, inflation had averaged less than 3 per cent over the whole decade, and about 2 per cent since the inflation target for monetary policy was introduced in 1993. The combination of 4 per cent growth and 2–3 per cent inflation seen for a number of years now is one which a previous generation of economists and policy-makers would have only dreamed of – but to which many contributed through the hard grind of numerous reforms over many years.
That this combination would be achieved in a world in which Australia's current account deficit – the bête noire of the policy-makers of the 1980s – had apparently changed little, and had averaged 4½ per cent of GDP for twenty years, would have been considered even more unlikely a decade ago. Careful observers would probably be wary of concluding that this issue has been completely put to rest, or that problems could not at some stage appear. But it is undeniable that Australia's standing in international financial markets remained strong, and at few times in our history has it been stronger than during the financial crisis which engulfed our neighbours, and which clearly did not derail the Australian economy.
The policy debates of the 1990s shaped these trends, and also were shaped by them. Vigorous debate about the conduct of monetary policy, its objectives and even its very institutional structure, was a feature of the early part of the decade. Some elements of that debate contributed to constructive change in policy arrangements. It would be disingenuous to suggest that there is now no debate on these issues, but the debate is more confined, more focused, and less politicised. Likewise there seems to be broad agreement at present about the overall goals of fiscal policy, though the inevitable conflicts about how they are achieved naturally occur. Our guess would be that interesting intellectual debates may lie ahead in this area, assuming that surpluses continue for some years and debt on issue continues to run down. A decade from now, some important medium-term issues of public finance may well have been debated to a much greater extent that they have to date. If so, it will only have been possible because of the efforts at fiscal consolidation and maintaining discipline in the period since the mid 1980s.
The key question in mid 2000 is whether these successes of the 1990s can be continued in the first decade of the new century. There is no shortage of actual or potential challenges. Most imminently, the various temporary effects of wide-ranging tax reform have to be coped with. There is the obvious potential for instability in international financial markets were a serious correction to take hold in US equity markets. The increased size of household financial balance sheets generally is something that may generate additional uncertainty, as is the pervasive effect of rapid technological change. Further ahead, environmental issues may become more prominent as factors requiring adjustments in relative prices and patterns of production – which in the past have been known to occasion disruption. Many of the factors pertinent to ongoing success lie in the social area rather than the strictly economic domain, though the two are related.
Yet despite this, and evident concern that the economic gains have been unevenly distributed, and despite the tendency of the Australian media to give more prominence to bad economic news than to good, and to threats to growth than to opportunities for it, there is perhaps more optimism in many informed circles now than there was ten years ago about Australia's economic possibilities. A decade of low inflation has done a lot to eradicate the old inflation mentality, with all the distortions that came with it. Stable growth, and a long expansion, mean that talk of sustaining unemployment rates below 6 per cent might now seem only slightly ambitious; seven years ago it would have seemed ludicrous to many. The benefits of productivity growth for living standards, a result of all the difficult microeconomic reforms, and perhaps of the more stable macroeconomy, have become clearer and will surely be clearer still in future. Finally, comparisons with the performance of other countries, particularly our Asia-Pacific neighbours, made so unfavourably even five years ago, are more balanced now.
The successes in the 1990s, and of the latter 1990s in particular, have generated a lot of this confidence. It was surely not, of course, all good management; good fortune has, perhaps, favoured Australia at times in the 1990s, in ways it did not in the 1980s. Only time will tell whether further performance like that of the past several years is within our grasp, or not. There are areas of risk to watch out for. But there are also good reasons for cautious optimism.
Footnotes
We are very grateful to Meredith Beechey for tireless research assistance, to Guy Debelle and Nicholas Gruen for helpful comments, and to Dominic Wilson for discussions about productivity growth. [1]
See Table 2 in Boehm and Summers (1999). [2]
One issue is how such growth rates might be computed. The average growth rates in Table 1 are computed between the fourth quarter of 1989 and the fourth quarter of 1999, for the 1990s, with corresponding calculations for earlier periods. An alternative is to fit a log-linear trend through the levels, and compute the slope of the trend. Doing this yields alternative growth estimates shown in Figure 1, where the 1990s growth rate is well above the 1970s, and in per capita terms the 1990s growth was easily superior to performance in any post-war decade except for the 1960s. [3]
One possibility is that this phenomenon reflects, in part, better measurement. If the true variance of the economy is constant, better measurement could reduce the degree of random error in the measurement of growth rates, and lead to less variability in the movements between successive quarterly estimates of the level of GDP. [4]
It is worth noting here that while the terms of trade swings in the 1980s are well remembered as having caused significant adjustment problems for the Australian economy, those in the 1970s were considerably larger. Large but temporary terms of trade increases, such as in the early 1970s, bring their own problems, just as do declines. [5]
Econometric evidence suggests that terms of trade shocks have had little impact on economic activity in the floating rate era (Gruen and Shuetrim 1994). The exchange rate movements that accompany them, however, can have an impact on domestic inflation, and therefore induce policy responses which do affect activity. [6]
Simon (2000) documents the decline in volatility of US growth rates, and concludes after a VAR analysis that this reflects smaller shocks in the US economy, particularly aggregate demand shocks. [7]
There are some data issues that slightly complicate the analysis. The multifactor productivity data from the ABS are available at an annual frequency from 1964/65 to 1998/99. The labour productivity data are available at an annual frequency from 1964/65 to the present, and at a quarterly frequency from 1978:Q1 to the present. The trend lines are calculated, as closely as the data allow, from GDP troughs to peaks. We also include a break in productivity growth in 1973/74 to allow for the world-wide productivity slowdown at that time, even though there was no decline in Australian GDP at that time. Of course, the data begin some way into the 1960s economic expansion, and end in 1999 when the expansion is continuing. [8]
John Quiggin (personal communication) argues that productivity growth (particularly labour productivity growth) in the market sector in the 1990s has been artificially boosted by the treatment of the property and business services (PBS) sector. This sector is not part of the market sector, but most of its output is used as input for the market sector. It has seen very strong 5.7 per cent per annum trend growth in hours worked in the 1990s expansion, and its output is calculated assuming no productivity growth. As there has undoubtedly been some productivity growth in this sector, inputs into the market sector will have been understated, and market-sector productivity growth will have been overstated. One response to this problem is to calculate productivity growth for a broader segment of the economy that includes the PBS sector. Doing this for the non-farm economy reveals that labour productivity growth in the 1990s expansion was slower than for the market sector, but the relative productivity performance in the 1970s, 1980s and 1990s expansions in the non-farm economy was the same as for the market sector. For the non-farm economy, the relevant numbers for annual trend labour productivity growth are 2.0 per cent (1970s expansion), 0.8 per cent (1980s) and 2.2 per cent (1990s). Using ABS estimates for capital stock (extrapolated to the end of the 1990s) and assuming a Cobb-Douglas production function with labour hours worked and capital stock as inputs yields estimates for annual trend multifactor productivity growth in the three expansions of 0.9 per cent (1970s expansion), 0.8 per cent (1980s) and 1.8 per cent (1990s) implying, as for the market sector, that multifactor productivity growth was particularly strong in the 1990s expansion. [9]
It is not possible to eliminate all measurement issues from the estimation of multifactor productivity (mfp). For example, the ABS currently makes no allowance for improvements in labour quality in its estimates of mfp. The experience of the US, where allowance is made, suggests however that this refinement would make only a small difference (see, for example, the estimates of the contribution of improved labour quality to output growth in DeLong (this volume, Table 1, p 17)). Dowrick (2000) discusses some further reasons why estimates of market-sector multifactor productivity growth might be biased. He also presents an econometric analysis suggesting an improvement in annual trend mfp growth in the Australian market sector of 1.4 percentage points between the period 1974–1989 and the 1990s, i.e., somewhat larger than our estimate of a 0.9 percentage point improvement between the 1980s and 1990s expansions. [10]
There was considerable structural change and deregulation in this sector, and the rapid labour productivity growth in the 1990s is partly accounted for by job shedding, with the share of hours worked falling from 2½ per cent of market-sector hours in the 1980s to 1½ per cent in the 1990s. [11]
The pick-up may be overstated because at least part of the falls in measured productivity in the 1980s in these sectors is probably spurious. Falling measured labour productivity in retailing in the 1980s probably had a lot to do with the deregulation of shopping hours at that time (Lowe 1995). This effect would have had less impact on measured labour productivity in the 1990s because the lengthening of retail shopping hours had largely run its course by early in the decade. In the wholesale trade and construction sectors, alternative sources of data (the Wholesale and Construction Industry Surveys) suggest some rise in labour productivity in these sectors over the 1980s, rather than the falls implied by the data used here (which are quarterly output data from the national accounts and labour input data from the Labour Force Survey). These alternative sources of data are however less useful for the 1990s. The latest published Wholesale Industry Survey is for the 1991/92 financial year. The latest Construction Industry Survey, for 1998/99, could be used to compare outcomes with the previous survey for 1988/89, but the ABS cautions that the industry output data from this survey are very imprecise. So again, the pick-up in productivity in these two industries between the economic expansions in the two decades may be overstated. [12]
Oliner and Sichel (2000) argue that computer usage has contributed significantly. They estimate that the production of computers and the use of information technology together account for two-thirds of the one percentage point pick-up in US labour productivity growth between the first and second halves of the 1990s. Gordon (2000) agrees that the production of computers, and more broadly, the manufacture of durable goods (which includes the production of computer peripherals and telecommunications equipment) has contributed to the pick-up in US aggregate labour productivity growth. But he argues that there has been no improvement in trend labour productivity growth in the second half of the 1990s for the other 88 per cent of the US market economy, i.e., that part outside durable-goods manufacturing. Since Oliner and Sichel work with measured productivity growth, while Gordon attempts to partition it between cycle and trend, much of the controversy revolves around tricky issues to do with how much of the improvement in measured labour productivity growth is an improvement in trend and how much is cyclical. [13]
An alternative view of the OPEC I and II episodes is that they represented a lumpy ‘catch-up’ of oil prices to persistent inflation of the general price level over a number of years. In this view, the absence of such shocks in the 1990s would presumably reflect the general low inflation environment itself. [14]
Edey and Gower (this volume) present inflation-adjusted estimates of the current account balance in their Table 1. Their estimates, 3.8 per cent of GDP in the 1980s and 3.2 per cent in the 1990s, suggest quite a significant fall in the inflation-adjusted current account deficit to GDP ratio between the two decades. These inflation-adjusted numbers are calculated using ABS estimates of the currency denomination of Australia's net external debt. It seems clear, however, that a significant portion of the foreign-currency-denominated part of this debt is hedged, in a way that cannot be captured in the official statistics. That portion is then effectively A$-denominated, which affects the appropriate inflation adjustment. If, as seems plausible, much of the foreign-currency-denominated portion is hedged, the inflation-adjusted current account deficit to GDP ratios are roughly the same in the two decades (Luke Gower, personal communication). [15]
See, for example, Stevens, Thorp and Anderson (1987), Blundell-Wignall and Thorp (1987), and the papers in Macfarlane and Stevens (1989). [16]
RBA estimates of household wealth based on financial accounts and value of household dwellings (sources: ABS, CBA/HIA Housing Report, RBA); household disposable income from national accounts, no exclusions; household debt from RBA measure; consumption from national accounts, includes consumption of fixed capital. [17]
The decision included the following: ‘we have noted the Reserve Bank's intimations of the order of increase which, in its view, accords with its inflation target. Any increase greater than the amount which we grant carries a risk, in our view, of leading to a rise in interest rates. In the current state of the economy, with a high and seemingly stationary unemployment rate and an inadequate growth rate, we are unwilling to take that risk’ (Australian Industrial Relations Commission 1997, p 50). [18]
Newspaper headlines from the time give a feeling of the level of concern: ‘Fall in Productivity Leads Economy to the Edge of Debt Quagmire’ (Sun-Herald, 20 November 1988), ‘Scary Arithmetic in our Debt Figures’ (The Sydney Morning Herald, 17 July 1989), ‘Australia's debt hovering on the cliff-face of crisis’ (The Australian Financial Review, 21 September 1989); and ‘Australia Sliding into Debt Trap Says Bank’ (The Age, 20 November 1989). Less apocalyptic prognostications were also reported, but tended not to capture the headlines. For example, Westpac pointed out that ‘contrary to the Cassandras, Australia was not on the brink of financial disaster and could expect to reap the benefits in 1990 from the strong growth in business investment of the past few years’ (The Australian Financial Review, 27 December 1989). [19]
Perhaps the most dramatic of these was a booklet issued in November 1989 by Macquarie Bank, entitled A Boiling Frog: Australia's Economic Challenge. This booklet argued that Australia's problem with its foreign debt could be likened to that of a frog immersed in water that was initially cold but was gradually being heated. Failing to realise the impending danger, the frog is eventually boiled. [20]
We discuss fiscal policy in more detail in the next section of the paper. For further discussion of superannuation, see Edey and Gower (this volume). [21]
Judging by its public statements, the Reserve Bank shared this view at the time. In its 1988 Annual Report, the Bank argued (p 8): ‘Australia's external imbalance and the high level of external debt were major issues for general economic policy throughout 1987/88. It was of some concern, therefore, that strong domestic demand boosted imports over the year. Also, in the second half of the year, earnings and prices appeared to be growing uncomfortably quickly, threatening the downward course of inflation and the improving trend in the balance of payments. The tightening of monetary policy in the second half of the year was in response to those developments’. The Bank's later views on the subject will be discussed shortly. [22]
For example, no-one from the consenting-adults school was invited to the high-profile National Summit on [Foreign] Debt convened in early 1990 by the Business Council of Australia, and attended by over 300 leading businesspeople. In the background report prepared for the Summit by Access Economics (1990), the consenting-adults view was discussed, and dismissed. [23]
The day after Phillips' June 1990 speech, The Australian Financial Review reported his arguments in its lead front-page story under the headline ‘Reserve [Bank] seeks shift in gov[ernmen]t strategy’. It was clear from reactions to the speech that the arguments put by Phillips were indeed contentious at the time. [24]
Two examples give a flavour of this last argument. ‘In practice we are muddling into using low economic growth as a technique for ‘coping’ with Australia's current account problems – even though it is widely conceded that this is an inefficient solution to the problem.’ (Gruen and Grattan 1993, p 174–175). ‘Increasing dependence on foreign savings, as reflected in growing net foreign liabilities, … place[s] an external “speed limit” on the pace at which economic growth can be sustained’ (Budget Statements 1996, p 1–9). In a related argument, Andersen and Gruen (1995) argued that rising external liabilities/GDP would require gradual real depreciation, which in turn would require domestic costs to rise more slowly than aggregate (traded and non-traded goods) domestic prices. To generate the required restraint in domestic costs would require a lower level of domestic output than would otherwise be the case, although output growth would not be affected. [25]
Downgrades have almost always been a sign of current or past difficulties, rather than increased future vulnerability. For example, the countries most affected by the Asian financial crisis (Thailand, Malaysia, Indonesia and Korea) received either steady or gradually improving credit ratings from Moody's in the years leading up to the 1997–98 crisis. After the crisis was upon them, however, their credit ratings dropped sharply. [26]
FitzGerald used the past year's change in OECD private consumption deflators to deflate nominal bond yields. We use the past year's core consumer price inflation because it is a more commonly used measure. This change makes minimal difference to the results. FitzGerald also registered the relevant caveat that past inflation may be only an imperfect measure of expected future inflation. [27]
This alternative explanation also accords with the cross-country empirical evidence presented by Orr, Edey and Kennedy (1995). Their results imply that a rapid fall in inflation of the kind experienced in Australia in the early 1990s leads to significantly higher real bond yields for several years afterwards. Higher sustained current account deficits also lead to higher real bond yields, but the effect is small empirically. [28]
The Thai current account deficit averaged 6½ per cent of GDP over the five years 1992–96, with the corresponding figures being 5¾ per cent for Malaysia, 2¼ per cent for Indonesia, and 1¾ per cent for Korea. [29]
The authors qualify this last statement with the remark: ‘This may be because the information provided by the behavior of the current account balance to some extent may already have been reflected in the evolution of the real exchange rate’. This comment would seem of particular relevance to pegged rather than floating-rate regimes. [30]
Data issues complicate comparisons over time. Commonwealth Government Securities on issue amounted to more than 100 per cent of GDP in 1950; this ratio had fallen to 25 per cent by 1980. We use the alternative figure for general government net debt (or net financial liabilities) because it is one of the measures used by the OECD to make cross-country comparisons of government indebtedness. The general government sector is a consolidation of the central, state and local governments, and the social security sector (which does not exist as a separate sector in Australia). Net debt includes all financial liabilities less all financial assets. The government's equity participation in public trading enterprises is not included as part of its holdings of financial assets. As a consequence, therefore, the use of the proceeds from the sale of public trading enterprises to retire government debt reduces general government net debt. Adjusting the Australian figures for the proceeds of such sales would change the numbers somewhat, without making much difference to the overall qualitative picture. [31]
Abstracting from the effects of any asset sales, maintaining an underlying budget balance in a growing economy gradually generates this outcome. [32]
See Edey and Gower (this volume) for further discussion on the implications of population ageing for the fiscal accounts. [33]
References
Access Economics (1990), Australia's Foreign Debt: Choices for the Future, report prepared for First National Summit on Debt, Business Council of Australia, Melbourne, 1–2 March.
Andersen P and D Gruen (1995), ‘Macroeconomic Policies and Growth’, in P Andersen, J Dwyer and D Gruen (eds), Productivity and Growth, Proceedings of a Conference, Reserve Bank of Australia, Sydney, pp 279–319.
Australian Industrial Relations Commission (1997), Safety Net Review – Wages.
Budget Statements (1992), 1992–93 Budget Paper No 1, Australian Government Publishing Service, Canberra.
Budget Statements (1996), 1996–97 Budget Paper No 1, Australian Government Publishing Service, Canberra.
Ball LM (1996), ‘A Proposal for the Next Macro-Economic Reform’, Victoria University of Wellington Foundation, Wellington, 11 November, mimeo.
Blinder AS (1997), ‘Is Government Too Political?’, Foreign Affairs, 76(6), pp 115–126.
Blundell-Wignall A and S Thorp (1987), ‘Money Demand, Own Interest Rates and Deregulation’, Reserve Bank of Australia Research Discussion Paper No 8703.
Boehm EA and PM Summers (1999), ‘Analysing and Forecasting Business Cycles with the Aid of Economic Indicators’, Melbourne Institute Working Paper No 18/99.
Business Council of Australia (1999), ‘Avoiding Boom/Bust: Macro-economic Reform for a Globalised Economy’, New Directions Discussion Paper 2.
Carmichael J (1990), ‘Inflation: Performance and Policy’, in SA Grenville (ed), The Australian Macro-Economy in the 1980s, Proceedings of a Conference, Reserve Bank of Australia, Sydney, pp 288–342.
Chapman B (1990), ‘The Labour Market’, in SA Grenville (ed), The Australian Macro-Economy in the 1980s, Proceedings of a Conference, Reserve Bank of Australia, Sydney, pp 7–65.
Corden WM (1991), ‘Does the Current Account Matter? The Old View and the New’, Economic Papers, 10, pp 1–19.
Creedy J (ed) (1990), The Australian Economic Review, 90, Melbourne Institute of Applied Economic and Social Research, University of Melbourne.
Dowrick S (2000), ‘The Resurgence of Australian Productivity Growth in the 1990s: Miracle or Mirage?’, paper presented at 29th Annual Conference of Economists, Gold Coast, Queensland, 3–6 July.
Edey M (1997), ‘The Debate on Alternatives for Monetary Policy in Australia’, in P Lowe (ed), Monetary Policy and Inflation Targeting, Proceedings of a Conference, Reserve Bank of Australia, Sydney, pp 42–67.
FitzGerald VW (1993), National Saving: A Report to the Treasurer, Australian Government Publishing Service, Canberra.
Fraser BW (1993), ‘Some Aspects of Monetary Policy’, Reserve Bank of Australia Bulletin, April, pp 1–7.
Gordon RJ (2000), ‘Does the “New Economy” Measure up to the Great Inventions of the Past?’, Journal of Economic Perspectives, 14(4), forthcoming.
Grenville SA (1990), ‘The Operation of Monetary Policy’, The Australian Economic Review, 90, pp 6–16.
Grenville SA (1997), ‘The Evolution of Monetary Policy: From Money Targets to Inflation Targets’, in P Lowe (ed), Monetary Policy and Inflation Targeting, Proceedings of a Conference, Reserve Bank of Australia, Sydney, pp 125–158.
Gruen D and G Shuetrim (1994), ‘Internationalisation and the Macroeconomy’, in P Lowe and J Dwyer (eds), International Integration of the Australian Economy, Proceedings of a Conference, Reserve Bank of Australia, Sydney, pp 309–363.
Gruen F and M Grattan (1993), Managing Government: Labor's Achievements and Failures, Longman Cheshire, Melbourne.
Gruen N (1997), ‘Making Fiscal Policy Flexibly Independent of Government’, Agenda, a Journal of Policy Analysis and Reform, 4(3), pp 297–307.
Hanke SH, MG Porter and K Schuler (1992), ‘A “Bundesbank” or a “Reserve Currency Board”?’, in D Moore (ed), Can Monetary Policy be Made to Work?, Papers presented at the Institute of Public Affairs Monetary Policy Conference, Melbourne, pp 36–50.
Kaminsky G, S Lizondo and CM Reinhart (1998), ‘Leading Indicators of Currency Crises’, IMF Staff Papers, 45(1), pp 1–48.
Lowe P (1995), ‘Labour-Productivity Growth and Relative Wages: 1978–1994’, in P Andersen, J Dwyer and D Gruen (eds), Productivity and Growth, Proceedings of a Conference, Reserve Bank of Australia, Sydney, pp 93–134.
Macfarlane IJ (1989), ‘Money, Credit and the Demand for Debt’, Reserve Bank of Australia Bulletin, May, pp 21–31.
Macfarlane IJ (1990), ‘Credit and Debt: Part II’, Reserve Bank of Australia Bulletin, May, pp 27–34.
Macfarlane IJ (1998), ‘Australian Monetary Policy in the Last Quarter of the Twentieth Century’, Reserve Bank of Australia Bulletin, October, pp 6–19.
Macfarlane IJ and G Stevens (eds) (1989), Studies in Money and Credit, Proceedings of a Conference, Reserve Bank of Australia, Sydney.
Macquarie Bank (1989), A Boiling Frog: Australia's Economic Challenge, Macquarie Bank, Sydney.
McTaggart D and C Rogers (1990), ‘Monetary Policy and the Terms of Trade: A Case for Monetary Base Control in Australia?’, The Australian Economic Review, 90, pp 38–49.
Milbourne, R (1990), ‘Money and Finance’, in SA Grenville (ed), The Australian Macro-Economy in the 1980s, Proceedings of a Conference, Reserve Bank of Australia, Sydney, pp 222–276.
Moore D (ed) (1992), Can Monetary Policy be Made to work?, Papers presented at the Institute of Public Affairs Monetary Policy Conference, Melbourne.
Oliner SD and Sichel DE (2000), ‘The Resurgence of Growth in the Late 1990s: Is Information Technology the Story?’, Board of Governors of the Federal Reserve System, Finance and Economics Discussion Series, Paper No 2000-20, Washington DC.
Orr A, M Edey and M Kennedy (1995), ‘The Determinants of Real Long-Term Interest Rates: 17 Country Pooled-Time-Series Evidence’, OECD Economics Department Working Paper No 155.
Phillips MJ (1989), ‘A Central Banking Triptych’, Reserve Bank of Australia Bulletin, October, pp 13–16.
Phillips MJ (1990), ‘When the Music Stops’, Reserve Bank of Australia Bulletin, July, pp 14–18.
Pitchford J (1989a), ‘A Sceptical View of Australia's Current Account and Debt Problem’, The Australian Economic Review, 86, pp 5–14.
Pitchford J (1989b), ‘Does Australia Really Have a Current Account Problem?’, Policy, 5(2), Centre for Independent Studies, Sydney, pp 2–5.
Pitchford J (1990), Australia's Foreign Debt: Myths and Realities, Allen and Unwin, Sydney.
Simon J (2000), ‘Essays in Empirical Macroeconomics’, PhD Thesis, MIT.
Stevens G (1992), ‘Inflation and Disinflation in Australia: 1950–91’, in A Blundell-Wignall (ed), Inflation Disinflation and Monetary Policy, Proceedings of a Conference, Reserve Bank of Australia, Sydney, pp 182–244.
Stevens G (1997), ‘Some Observations on Low Inflation and Household Finances’, Reserve Bank of Australia Bulletin, October, pp 38–47.
Stevens G (1999), ‘Six Years of Inflation Targeting’, Reserve Bank of Australia Bulletin, May, pp 46–61.
Stevens G, S Thorp and J Anderson (1987), ‘The Australian Demand Function for Money: Another Look at Stability’, Reserve Bank of Australia Research Discussion Paper No 8701.
Stone JO (1984), ‘1929 and All That …’, The Australian Economic Review, 67, pp 18–31.