RBA Annual Conference – 1990 The Balance of Payments Warren Tease[*]
1. Introduction
A preoccupation with the external sector has been one of the abiding themes of Australian economics. ‘In the long run the rate of growth that can be sustained by the economy will be governed by, perhaps more than anything else, the extent of the good fortune and good management that attends the balance of payments’.[1] The 1970s saw a respite from the ‘brooding pessimism’[2] of earlier decades. Indeed, with the mineral export boom of 1970/71 and the prospect of a repeat in the second half of the decade, the nature of the problem seemed to have changed. This gave rise to the ‘Gregory Thesis’ – that the enhanced export performance would, perforce, require an appreciation of the real exchange rate or a reduction of tariffs, in order to encourage imports. The perceived problem shifted from concern about the difficulty of funding necessary imports, to concern about achieving structural adjustments required to absorb more imports. The problem was summarised this way: ‘the more successful, in the decade ahead, we prove to be at exporting, the more successful we are also going to have to be at importing’.[3]
In the event, pessimism about the balance of payments soon returned. The current account deficit increased sharply in the early 1980s, and despite a large depreciation of the real exchange rate and a move into surplus in the government accounts, there was no sustained tendency for it to decrease as the decade progressed. In addition, the method of financing the deficit shifted predominantly to debt and away from equity. As a result, by mid decade the question of excessive external debt was being raised, for the first time in at least a generation. All these developments happened against a background of closer integration into world financial markets and the floating of the Australian dollar.
If the current account problem was a familiar one, both the framework for analysing it and the institutional environment had changed. Before 1980, the short-term problem was seen as a result of either cyclical excess demand ‘spilling over’ into imports, or recurrent terms of trade shocks. These were seen to have their long-term secular counterparts: an import income elasticity substantially greater than one (so that as the economy grew, imports grew more rapidly) and secularly-declining terms of trade because Australia's comparative advantage was in primary goods. With the Swan-Salter[4] analysis in mind, policymakers had seen the solution to a current account problem in terms of a change in external competitiveness, and they had seen a role for active policies in setting the exchange rate and influencing wages and prices in order to maintain competitiveness.[5]
By the late 1970s, this view of competitiveness as a policy instrument was changing. While the exchange rate was not floated until December 1983, there was an increasing realisation that the real exchange rate was not a policy instrument directly amenable to change over the longer run. It was an endogenous reflection of the settings of policy and the underlying circumstances of the economy. There was a tendency for some, reinforced after the float of the currency in 1983, to see the exchange rate as a relative price which would automatically equilibrate the external sector. If the current account deficit was excessive, it was because there was a saving/investment imbalance caused by, for example, an overly large budget deficit or some distortion to private sector saving.
This paper records the growing current account deficit in the 1980s and the changing (and various) prescriptions of what should be done. In doing so, one objective here is to reconcile two approaches to analysing the current account. The first, described as the ‘piece meal’ approach to the balance of payments,[6] emphasises income and price elasticities, particularly for imports. The second focuses more on the current account in a general setting with it being a reflection of the relationship between aggregate absorption and aggregate output or, equivalently, between saving and investment. Gregory (1989) poses the dichotomy this way: ‘(is) it more productive to think of current account outcomes predominantly in terms of structural shocks to the import competing and export sectors or is it better to analyse current account outcomes in terms of government and private sector savings and investment decisions’. Because each of these approaches is true by identity, this paper adopts the view that the choice of the identity on which to focus is not of primary importance.[7] The main issue is identifying the exogenous factors that have affected the current account. As well as identifying where the initiating shock lies, we need to explain how the system responded (through relative prices, income, etc.) to maintain each of the identities.[8]
Section 2 of this paper sets out a brief summary of theory to illuminate and guide the interpretation of the data. Section 3 describes the current account in terms of episodes and proximate causes. No attempt is made to identify the initiating shock, or the equilibrating process. Section 4 looks at a number of shocks which have impinged on the current account in the 1980s – terms of trade, changes in saving and investment (including changes in government saving), changes in foreign capital flows and monetary policy. Section 5 draws these results together and examines the response of relative prices, and how the production mix between tradable and non-tradable goods responded to the relative price signals. Not only are the export/import and investment/saving versions of the current account identity held in balance by relative prices and income, there are forces limiting the overall size of current account imbalances. Feldstein and Horioka (1980) observed, almost a decade ago, that domestic saving and investment in most countries are linked together, so that while foreign capital flows provide the opportunity for the two to diverge, in practice there seem to be constraints on the gap between saving and investment. The corollary of this is that current account deficits will also be constrained. Did the more complete integration of Australia into world financial markets remove a constraint which allowed the current account deficit to rise? Section 7 looks at some remaining concerns about the balance of payments, principally the question of foreign debt, but also the question of whether the equilibrating process through changes in the real exchange rate can be relied on to bring about costless external adjustment. Section 8 draws the strands together.
2. An Analytical Framework
A rise in domestic expenditure (such as a rise in government spending or private investment) in a Mundell-Fleming world[9] would create an excess demand in the domestic goods market (domestic absorption exceeds domestic production and domestic investment exceeds domestic saving) and put upward pressure on domestic interest rates and prices. With flexible exchange rates, capital mobility and static exchange rate expectations, both the nominal and real exchange rate will appreciate. The appreciation will continue until the excess demand is offset by a rise in the current account deficit. Over the longer run, the exchange rate will depreciate and domestic expenditure fall (due to the wealth effects of higher net foreign liabilities) until the current account deficit is in equilibrium and the stock of net foreign liabilities is not growing relative to GDP. Models in this tradition therefore imply that initially a rise in government (or private) spending will be reflected one-for-one in a rise in the current account deficit. As a result, it has been suggested that the current account and fiscal deficits are ‘twins’.[10]
These results do not necessarily hold in more recent models that emphasise the intertemporal nature of consumption, investment and production decisions.[11] Generally, shocks which are perceived to be permanent have no effect on the current account in these models. For example, a permanent bond-financed rise in government spending may be offset by a rise in private saving (a permanent fall in private expenditure) because consumers take account of the implied higher future taxes. The current account may therefore be unaffected by a permanent rise in government spending. Temporary shocks can, however, influence the current account.
It is also important to distinguish between temporary and permanent terms of trade disturbances. Where the change in the terms of trade is seen to be permanent, individuals immediately and fully adjust their expenditure to their new permanent income, which may leave the current account unchanged as a proportion of GDP. A temporary rise in the terms of trade (such as a rise in export prices) will temporarily boost income which, because of consumption smoothing, will increase saving and reduce the current account deficit. Also, the rise in export prices shifts demand towards non-tradables putting upward pressure on domestic prices and the real exchange rate. If consumption is not completely smoothed then this response will be reinforced.[12]
Greater access to foreign financing generally means that the types of disturbances discussed above will have larger effects on the current account. In the absence of capital flows, a rise in expenditure will push up domestic real interest rates until the domestic goods market is in balance and domestic saving equals investment. With perfect capital mobility, such a shock will be equilibrated by increased capital inflows that appreciate the real exchange rate resulting in a trade deficit. Part of the increased demand is met by foreign producers (or to put it another way, the reduction in net domestic saving is met by foreign borrowing). In this sense, greater access to foreign funds merely facilitates the adjustment to shocks through allowing larger current account imbalances. However, it also introduces another influence on the current account, namely autonomous shifts in the portfolio preferences of international investors.
The resource shifts associated with the types of shocks discussed above have been an important issue in Australia. In Swan-Salter models, an increase in demand (through government or private spending) will create an excess demand for traded and non-traded goods. The price of non-traded goods will rise until that market clears. With the price of traded goods exogenous, the real exchange rate will appreciate. Resources will be diverted to the non-traded goods sector with the excess demand for traded goods being met by higher net imports. A rise in export prices will induce a real appreciation and resources will be shifted from the production of import-competing goods towards non-traded goods. See Dornbusch (1980) and Dornbusch and Fischer (1984).
3. The Chronology of the Current Account
(a) The longer-term trends
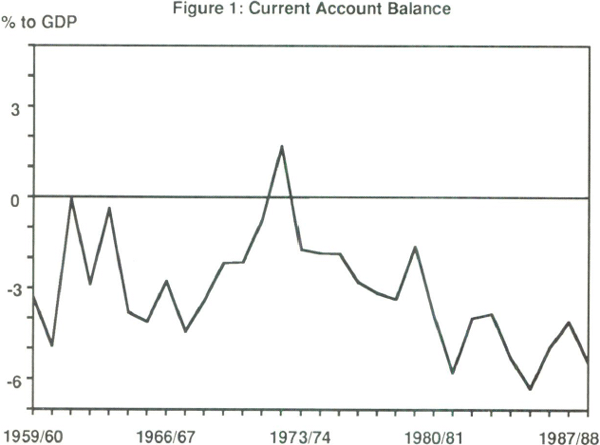
The fact that Australia experienced a current account deficit during the 1980s was not unusual. It has done so for most of the post-war period. What was unusual was the size of the deficit and the prolonged period in which the large deficit persisted. The deficit widened in the early 1980s for reasons that were considered temporary at the time (i.e. the investment phase of the ‘resources boom’). It reached 5¾ per cent of GDP in 1981/82; a large, but not unprecedented figure. (See Figure 1.) There has been little sustained narrowing since that time. Indeed, the deficit failed to fall much below 4 per cent of GDP in any of the years of the 1980s. This behaviour is atypical. In earlier periods (in the 1950s and 1960s for example) rises in the deficit tended to be quickly reversed. The current account deficit averaged 4½ per cent of GDP in the 1980s. This compares with averages of 1¾ per cent and 3 per cent of GDP in the 1970s and 1960s respectively.
The rise in the current account deficit largely reflected movements in the merchandise trade balance which widened from a surplus averaging 1¾ per cent of GDP in the 1970s to average a deficit of ½ of one per cent of GDP in the 1980s. The net income and transfers balance also widened from around 2 per cent of GDP in the 1960s and 1970s to around 3¼ per cent of GDP in 1988/89 because of higher interest payments on foreign debt.
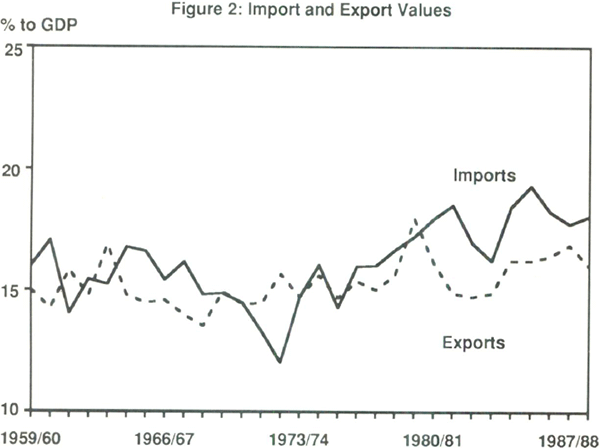
The increase in the current account deficit since the late 1970s has been associated with a sharp rise in imports. Figure 2 plots import and export values relative to GDP. During the 1960s the import to GDP ratio was largely flat before falling sharply in the early 1970s.[13] The import share of GDP then rose quickly in the second half of that decade. During the 1980s, it continued to trend upwards. The import share averaged just under 18 per cent of GDP in the 1980s. This is substantially higher than the 15¾ per cent and 14¾ per cent of GDP recorded in the 1960s and 1970s respectively. The value of exports as a proportion of GDP has only risen from around 15 per cent in the 1960s and 1970s to 16 per cent in the 1980s. However, there was a pick-up in export performance in the second half of the decade with exports being about ½ of one per cent of GDP higher than in the first half.
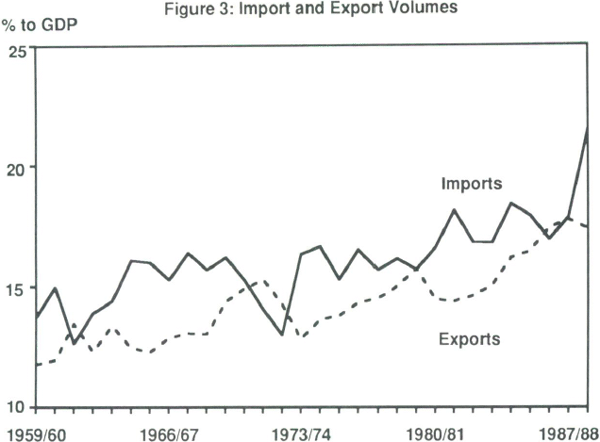
Export prices have fallen substantially relative to domestic prices over the past 30 years. These relative price falls have been offset by growth in export volumes. (See Figure 3.) Exports, in volume terms, have grown by around 1½ per cent of GDP per decade and have grown much faster than GDP since 1982/83. Import volumes grew quickly during the early 1980s and remained high relative to GDP for most of the decade. In the last two years of the decade the ratio of import volumes to GDP has risen substantially.
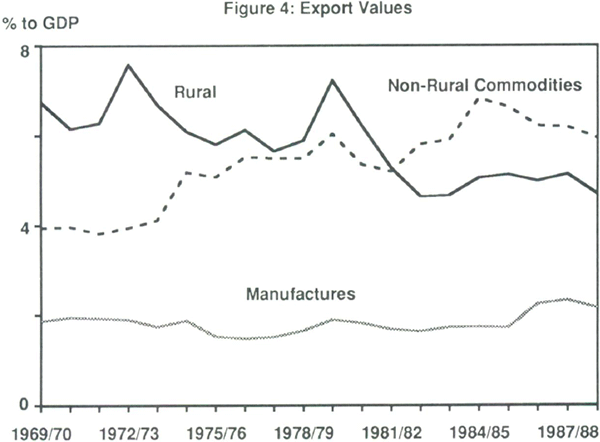
Rural exports were the predominant source of export income until the beginning of the 1980s. They have now been surpassed by exports of non-rural commodities (notably, mineral fuels) which account for almost 40 per cent of total exports. (Figure 4 plots export values as a proportion of nominal GDP.)
The export-import version of the current account identity was plotted in Figure 2. How have the saving-investment and output-absorption versions of the identity behaved?
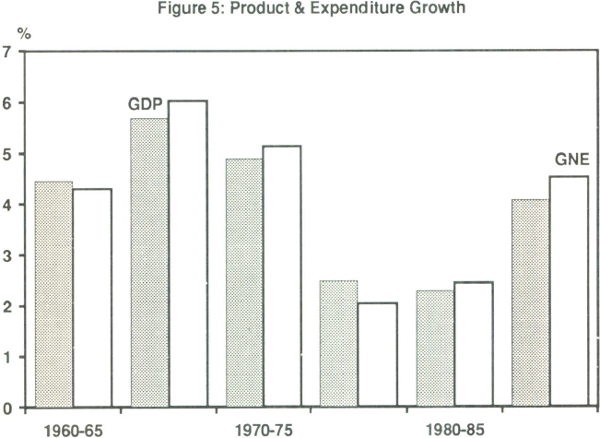
Figure 5 plots five year average growth rates of real GDP and GNE. Output and absorption were very subdued, on average, in the period 1975 to 1985 after a period of rapid expansion in the previous fifteen years. Growth in both output and absorption recovered in the second half of the 1980s but still remained below the rates of the first half of the sample. This suggests that the widening of the current account deficit has not been due to excessive expenditure growth per se. A sharp slowing in output growth meant that the economy had to sustain slower expenditure growth just to maintain a given current account deficit. This situation has eased a little because of the recovery in output.
In terms of the saving-investment identity, the rise in the current account deficit has been associated with a decline in national saving rates. (See Figure 6.)[14] There was a major fall in total saving during the second half of the 1970s.
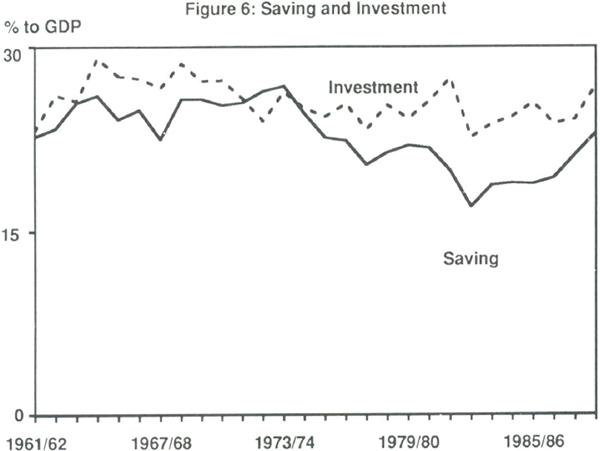
In recent years there has been a recovery in the level of saving. However, it is still below the levels achieved in the 1960s and early 1970s. In contrast, there has not been a significant change in the rate of investment. Although, in the short term, the investment rate has been more volatile than the saving rate (e.g. the sharp rises in investment at the beginning and end of the 1980s) it has not experienced a marked secular change. Thus, for most of the period since the mid 1970s, the widening of the current account deficit has been associated with subdued saving for a given level of investment.
(b) The 1980s
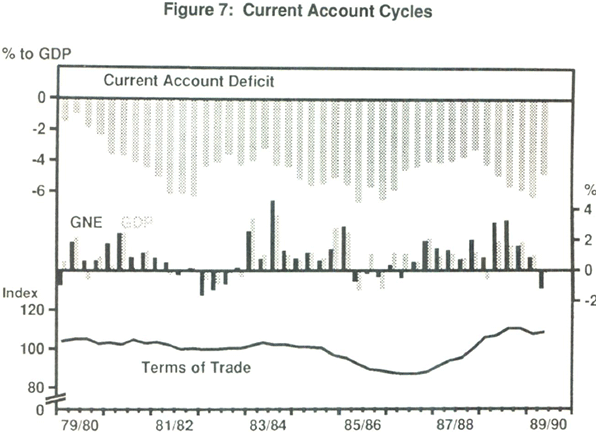
We now examine, in an episodic fashion, the progress of the current account through the 1980s. This is done in terms of proximate causes, not going beyond the uncontroversial observation that the current account reflects an excess of demand over production, and the price effects of the terms of trade. (Figure 7 shows data on the current account, production, expenditure and the terms of trade during the 1980s.)
After narrowing in 1979/80, the current account deficit widened sharply until 1981/82. This was driven by increased expenditure, particularly investment expenditure on mineral processing and electricity generation associated with the ‘resources boom’ following OPEC II.[15] Toward the end of this period, the economy was reaching capacity constraints. This constraint was exacerbated by large real wage increases which slowed domestic production. Rural exports also fell as a result of the drought. Even though the deficit was very high in this period, it was not seen as alarming because it was explainable in terms of an increase in the rate of return to capital in Australia. The imbalance was seen as the first stage of a process which would produce an increase in exports.[16]
The very sharp slowing of the economy in 1982 brought the current account deficit back from about 6 per cent of GDP to around 4 per cent. Despite this, the current account had not returned to its traditional level. Also, at this time the budget deficit increased sharply, mainly for counter-cyclical demand-management reasons. The economy recovered rapidly from the 1982 recession; at first, expansion of domestic production was able to meet a large part of the increase in expenditure. This was aided by the recovery in the rural sector. However, as the recovery continued, the speed of growth and relative price pressures were boosting import volumes and the current account deficit began to widen. This was exacerbated by the sharp decline in the terms of trade in 1985. The terms of trade fell by 14 per cent between March 1985 and March 1987. By this time the current account was again around 6 per cent of GDP.
In response, principally to the overheated domestic economy, but also later to the subsequent fall in the exchange rate, monetary policy was tightened. A sharp contraction of fiscal policy was also commenced – a move seen as important by those who viewed the current account deficit as the ‘twin’ of the budget deficit. (See page 4.) The Treasurer's ‘banana republic’ comment belongs to this period – an acknowledgment that policy adjustment was needed. The resulting slowing of the economy offset the continuing deterioration of the terms of trade but the results, in terms of a narrowing of the current account deficit, were slow in coming. The fall in the exchange rate was, through valuation effects, increasing the current account deficit (as recorded in $A): hence the debate on the ‘J curve’. (See Office of EPAC (1986).)
In 1987, the terms of trade began to improve; the economy was not, at that stage, growing quickly and the real exchange rate was very low. So in the two years up to 1987/88, there was a narrowing in the current account deficit of over 2 per cent of GDP. As the economy picked up pace (largely through private investment), and as the improvement in the terms of trade (combined with a tightening of monetary policy) pushed up the exchange rate and shifted relative prices to encourage imports, the current account deficit widened sharply, to reach about 5 per cent of GDP in 1988/89. The continuing substantial current account deficit could be associated, proximately, with the large increase in private sector investment. By the end of the decade, the economy had begun to slow and, while imports were not yet falling, they had at least levelled out and the current account as a proportion of GDP was edging downwards.
4. Causes of Fluctuations in the Current Account
To understand the development of the current account at a more fundamental level, we need to go behind the proximate relationship between demand and supply and the current account, to examine the exogenous factors affecting the economy. These include:
- terms of trade;
- shocks to saving/investment;
- foreign capital flows; and
- monetary policy.
(a) Terms of Trade
There has been a long-term decline in Australia's terms of trade. This trend has been punctuated by a number of large, transitory shocks. In Section 2 it was argued that the longer-term decline in the terms of trade is unlikely to have had an important effect on the current account deficit. Results reported in Section 6 are consistent with this. Slower GDP growth has been one of the ways in which the Australian economy has adjusted to the decline in the terms of trade. FitzGerald and Urban (1989) argue that this adjustment was policy induced. They argue that the restrictive demand management and protectionist policies implemented in response to earlier terms of trade crises limited any adjustment through a lower real exchange rate and resulted in relatively slow output growth.[17] This does not seem to have been the only adjustment. There has also been relatively rapid productivity growth in the agricultural sector[18] and a large increase in non-rural commodity exports. Thus, an expansion in export volumes relative to GDP has helped to offset the relative decline of export prices.
In contrast, transitory shocks to the terms of trade can have large effects on the current account. See discussion in Section 2 and references in footnote 12. In the short run, the price effects of these shocks impinge directly on the current account. Over time, expenditure and real exchange rate adjustment may offset the initial effects.
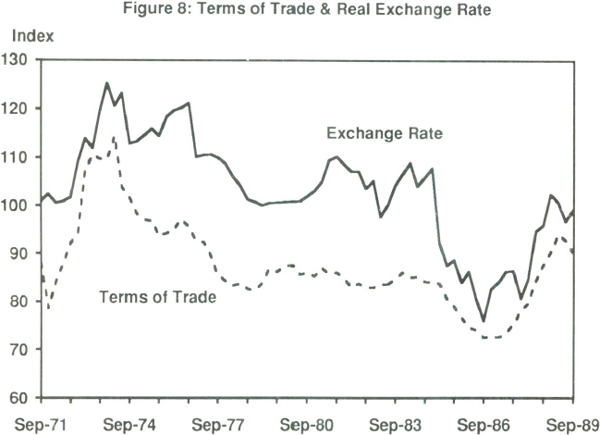
During the 1980s there were two major shocks to the terms of trade. One in a downward direction in which the terms of trade fell by almost 14 per cent between March 1985 and March 1987 and one in an upward direction with the terms of trade rising by 27 per cent between March 1987 and June 1989. Figure 8 plots the terms of trade and one measure of the real exchange rate.
At the most superficial level, the effect of a change in the terms of trade can be seen by comparing the actual development of the nominal and real trade balance. This is done in Figure 9. The difference between the two bars approximates the impact of the terms of trade.
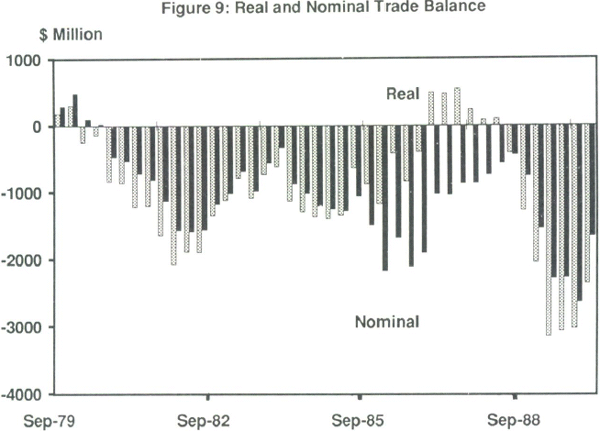
This mechanistic approach makes two simple points:
- the magnitude of the price effect of terms of trade shocks can be large within the cycle;[19] and
- actual export and import volumes changed very significantly following the change in the terms of trade.
It was noted in Section 2 that one channel through which transitory disturbances to the terms of trade may affect the current account is consumption smoothing on the part of the private sector. Can this effect on saving be directly detected in the data? Figure 10 shows private saving adjusted for inflation.[20] The rise in the terms of trade in the early 1970s roughly coincided with a rise in private saving at that time. The fall in the terms of trade commencing in March 1985 may have contributed to the decline in private saving around that time. However, it appears that this fall preceeded the terms of trade decline. The subsequent large rise in the terms of trade was not reflected in a rise in private saving. The data in the graph do not provide compelling support for a significant consumption smoothing response (apart from, perhaps, the early 1970s) to transitory terms of trade shocks.[21]
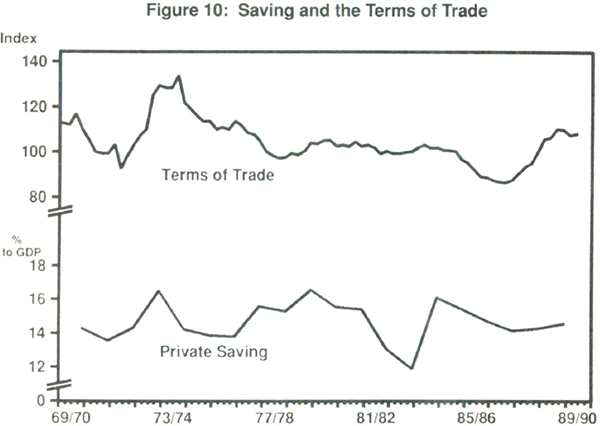
The evidence that there was only a small savings response in the mid 1980s may be surprising at first sight. Australia's greater integration into world financial markets meant that it was easier to maintain expenditure in the face of such shocks by drawing on foreign saving. But, at the same time, the floating of the exchange rate resulted in more immediate relative price adjustment. On the export/import side of the identity, the exchange rate change facilitated the switching of production into net exports (when the terms of trade fell). This fits with the impression in Figure 9 that the impact of the terms of trade fall in 1985/86 was relatively quickly offset by adjustment of trade volumes. Figure 11 looks at this process.
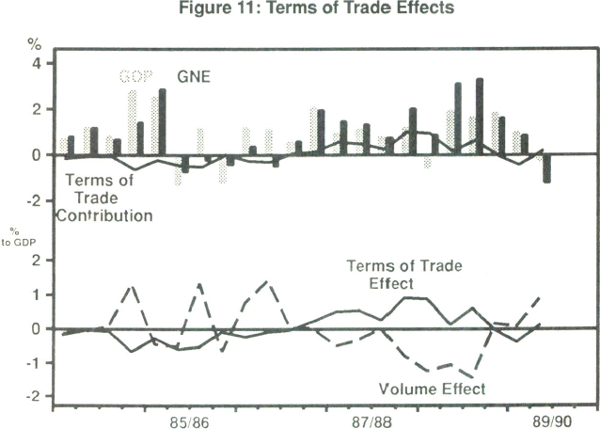
The top panel shows expenditure, production and a measure of the scale of the income effects of terms of trade changes. The bottom panel decomposes the change in the trade balance into terms of trade and volume changes.[22] Clearly, the direct terms of trade effects on the deficit were large but tended to be offset by subsequent volume changes. On the saving/investment side, the float may have altered the previous income distribution effects of terms of trade changes: rural exporters would have previously borne the brunt of a deterioration and, accustomed to expenditure smoothing, dissaved. In the mid 1980s, the depreciation spread the burden more rapidly to others (users of imports) with possibly different saving behaviour. Another important influence during the 1985/86 episode was the policy tightening which meant that the terms of trade decline was quickly offset.
Whatever the detail, it is clearly important that the exchange rate can now adjust quickly to export price shocks to encourage production responses and moderate fluctuations in export incomes in Australian-dollar terms. The link between the terms of trade and the exchange rate is illustrated in Figure 8. The shocks to the terms of trade in the early 1970s and mid 1980s contributed to large changes in the real exchange rate at those times. Blundell-Wignall and Thomas (1987) and Blundell-Wignall and Gregory (1989) have shown that the relationship between the terms of trade and the real exchange rate is statistically significant and that the strength of this relationship increased after the float.
Blundell-Wignall and Gregory (1989) compare the most recent terms of trade shock to several earlier ones. They argue that the response of the economy to such shocks has changed over time because of changes in the institutional structures. In earlier terms of trade shocks (the Korean war boom and the resources boom of the early 1970s) much of the required relative price adjustment, i.e. an appreciation of the real exchange rate, came through higher domestic inflation rather than by movements in the nominal exchange rate. In the 1987–89 period a good part of the adjustment came through the nominal exchange rate.[23] So the required change in the tradable/non-tradable price relativity came about mainly through falls in tradable prices (measured in $A), rather than rises in non-tradable prices. In both periods the price signal (inevitably) discouraged tradable production, but in the 1987–89 period this may have been softened by the restraint on nominal wage growth and the fall in real unit labour costs. For example, employment, output and profits in the import-competing manufacturing sector have been relatively strong and the volume of manufactured exports continued to grow quickly, increasing by about ½ of one per cent of GDP in the past few years.
(b) Saving and investment
Changes in the current account deficit are identical to changes in the saving-investment balance. Therefore, if we go behind the identity to look at the behaviour of the components of the saving-investment balance, we may be able to identify the saving or investment shocks that have influenced the current account. Edey and Britten-Jones (1990) show that private saving and investment are fairly stable over time (although they exhibit substantial short-term fluctuations): government saving is the component of the overall saving-investment balance that has shown the most marked trend movement.
In the first half of the decade, Australia, like a number of other economies,[24] experienced a combination of expansionary fiscal policy and a rise in the current account deficit. Many commentators attributed the rise in the deficit to fiscal policy – the ‘twin deficits’ hypothesis. Fiscal policy was adjusted in an attempt to reduce public sector dissaving and therefore reduce the current account deficit. The results have been mixed.[25] The current account deficits of a number of countries (New Zealand, Belgium and Denmark) have narrowed since the fiscal consolidations in those countries. This has not been true for Australia, Canada or the United Kingdom. These casual observations raise two questions. Did fiscal expansion early in the decade cause the rise in the current account deficits and, if so, why has the subsequent fiscal consolidation not been reflected in a reduction of the deficit? [26]
First, some facts. There has been a large fall in public saving. (See Figure 12.) This decline accounts for most of the fall in national saving seen in Figure 6. Public saving in the first half of the 1980s was well below the level of the previous two decades. A break from this trend occurred in 1983/84 and public saving has risen relative to GDP since then.
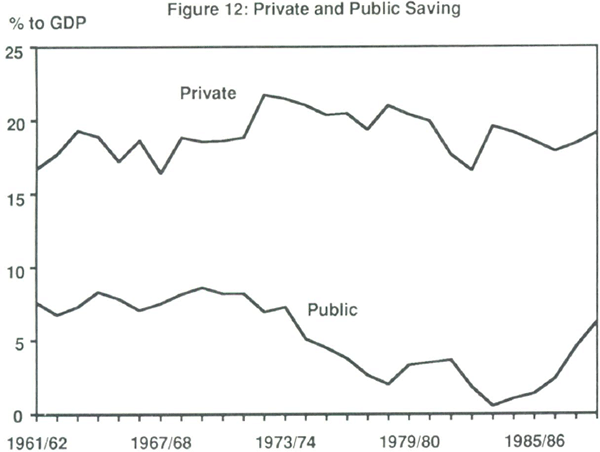
Figure 13 plots the net Public Sector Borrowing Requirement (PSBR) (i.e. the balance of public saving and investment) and the current account deficit. There is no contemporaneous one-to-one relationship between the two as the simple ‘twin deficits’ notion suggests.[27] That is, the effect of movements in the PSBR on the current account have been mitigated by shifts in the private sector saving-investment imbalance.
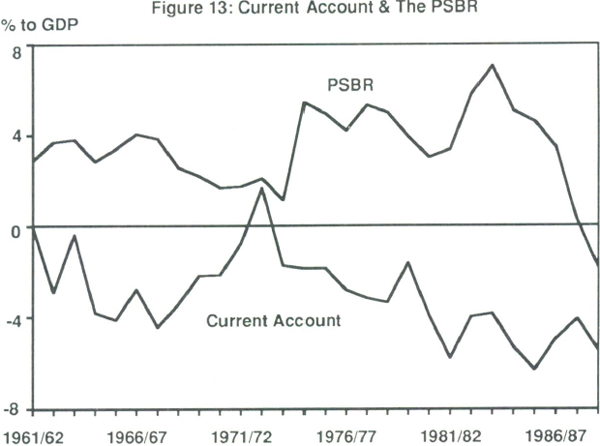
There may be some very general relationship in the 1960s. The rise in the PSBR after 1973/74 was not fully reflected in the current account in the late 1970s.[28] Private investment was very subdued. The sharp rise in the current account deficit between 1979/80 and 1981/82 occurred at a time when the PSBR was falling. The decline in the PSBR was offset by the rapid rise in investment associated with the resources boom. Similarly, a large rise in private investment during the latter years of the 1980s offset the reduction in the PSBR since 1983/84.[29]
These observations suggest two things. First, the low level of public saving in the first half of the 1980s underpinned the series of large current account deficits at the time. This was exacerbated at the start of the decade by the rise in investment. Second, changes in the government fiscal position are not contemporaneously, or fully, reflected in the current account.[30] The ‘twin deficits’ notion relied on the ceteris paribus assumption that private saving and investment would remain unchanged. This did not turn out to be the case. Is this private sector response more than just coincidental?
One possibility is that the private sector has behaved in a manner consistent with the ‘Ricardian equivalence proposition’ – that the private sector changes its saving behaviour to offset permanent changes in public saving. Edey and Britten-Jones (1990) argue that Ricardian equivalence does not hold in Australia because private saving was quite stable throughout the 1960s, 1970s and 1980s despite the major swings in public saving after the mid 1970s. They conclude that this behaviour suggests very little tendency for private savings to offset changes in the position of the public sector.
However, McKibbin and Morling (1989) suggest that part of the fiscal consolidation of the last few years has been offset by Ricardian-type behaviour. If the statistical discrepancy is treated as missing private expenditure, then net private saving fell by 3 per cent of GDP between 1983/84 and 1987/88, roughly matching the rise of public saving of 3½ per cent of GDP. Gregory (1989) also lends support to this view. However, this case does not seem to be very compelling. If consumers now internalise the public-sector budget constraint, why did they apparently fail to do so in the past? Also, if Ricardian equivalence holds closely, why have long-term real interest rates fallen for most of the period of the fiscal consolidation? Part of the explanation is that foreign rates were also falling. However, domestic rates fell relative to foreign rates until 1988.
A more likely explanation of the failure of the fall in the PSBR to show up in a lower current account deficit is that the economy has been influenced by offsetting shocks. The change in factor shares in the 1980s increased the profitability of the corporate sector and resulted in a substantial rise in private investment. A terms of trade rise also contibuted to a rise in expenditure and the real exchange rate.
The earlier model results (in footnote 30) suggest that fiscal policy induces offsetting private-sector behaviour by altering real interest rates and private investment. It is certainly the case that the fiscal consolidations of the late 1970s and mid 1980s were associated with a rise in private investment. While it is difficult to find an empirical relationship between private investment and real interest rates, Alesina, Gruen and Jones (1990) note that six economies that experienced large fiscal consolidations in the 1980s also experienced rapid investment growth.[31] They suggest that fiscal consolidation may boost corporate confidence and thus investment. The rise in investment in the past few years has been a major factor mitigating the effects of fiscal policy on the current account. However, it is unlikely that fiscal policy was the major influence on investment. Australian evidence suggests that profits are the most significant influence on short-run fluctuations in investment. (See McKibbin and Siegloff (1988).[32]) This suggests that the rise in profitability, driven by real wage reductions [33] since 1983/84, has underpinned the rise in private investment since that time.
Some would find this conclusion unusual in that it implies that the reduction in real wages, by contributing to increased profits and investment, has also contributed to the widening of the current account deficit. A priori, it is not clear why this should be the case since real wage cuts also increase production. The data on absorption and output in Figure 5, show this with the high real unit labour costs of the mid-1970s and early 1980s constraining both output and expenditure and vice-versa for the real wage reduction in the second half of the 1980s. Corden (1986) noted that the current account response to real wages depends on the relative magnitude of the expenditure and output effects. In the short run, however, the expenditure response probably dominates since the cycle in investment is much larger than that in output.
One issue that has attracted considerable attention of late is the effect of inflation and distortions in the tax system on saving and investment decisions. Macfarlane (1989) and McKibbin and Morling (1989) have argued that the interaction of high inflation and the tax system in Australia has influenced the saving-investment balance. Edey and Britten-Jones (1990) consider this issue in detail and they conclude that these factors may encourage capital importing into Australia.
(c) Capital Flows
The integration of financial markets across the world that began in the early 1970s has been associated with wider rather than narrower external imbalances. It is certainly the case that the widening of the current account deficit in Australia has occurred during a period in which Australia's domestic financial markets and foreign exchange markets have been deregulated.
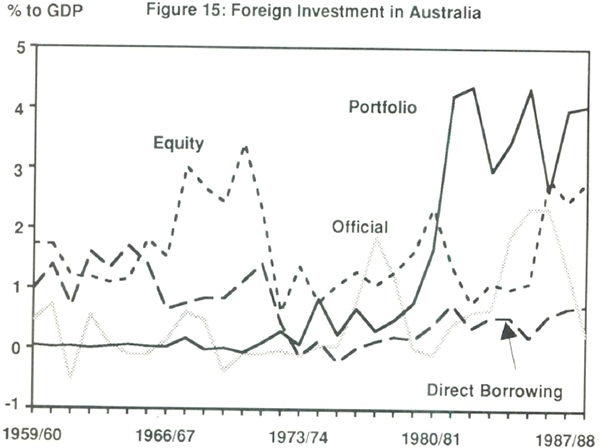
In December 1983 the Australian dollar was floated and the bulk of exchange controls were removed. Up to that point Australia had a ‘crawling peg’ exchange rate system underpinned by a range of exchange controls.[34] Controls were placed on both the inflow and outflow of capital. Generally, controls on outflows were more restrictive. During the 1950s and 1960s, an ‘open door’ policy on capital inflow meant that inflows were readily permitted.[35] In the 1970s various constraints were imposed when there were large inflows of capital. For example, an embargo on short-term borrowing was periodically introduced;[36] at the time this was supported by a variable deposit requirement (VDR) which increased the cost of borrowing. These measures sought to prevent or discourage firms from undertaking foreign borrowing.[37] By the end of 1978, these controls had been lifted. The removal of these particular restrictions preceeded a sharp rise in portfolio borrowing. (See Figure 15.)
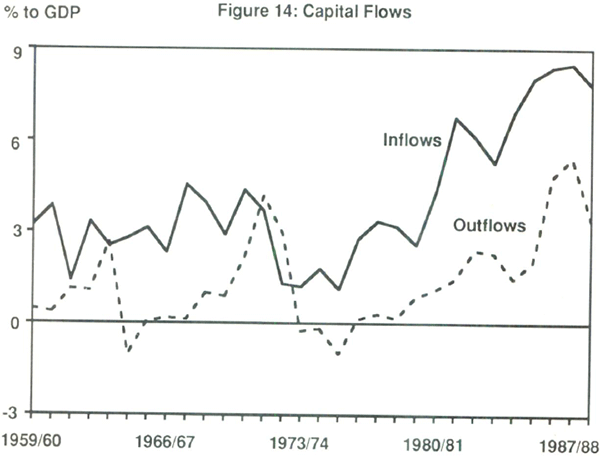
Has deregulation been a factor in explaining the behaviour of the current account and net foreign debt? There are a number of channels through which these changes may influence the external accounts. First, the removal of exchange controls coupled with the development of offshore $A securities markets (to be discussed later) has increased the mobility of capital and given domestic residents greater access to foreign saving. Shocks will therefore have a larger impact on capital flows, the exchange rate and therefore the current account than previously. Section 2 provided a discussion of this. At the same time, capital inflow (and the current account deficit) may have risen as potential investors, previously constrained by funding shortages, were now able to finance their projects. Second, deregulation has altered the portfolio investment decisions of corporations and the way those investments are financed. An example of this has been a large rise in equity investment abroad that has been financed by foreign borrowing.
To illustrate the second effect it will be useful to examine developments in the capital account in the 1980s. Figure 14 shows gross capital flows as a proportion of GDP. Both outflows and inflows of capital have increased relative to GDP in the 1980s. Capital inflows averaged 6½ per cent of GDP in the 1980s – more than double the averages of the 1960s and 1970s. Capital outflows grew steadily during the decade, averaging 2½ per cent of GDP in the 1980s compared with less than one per cent in both the 1960s and 1970s.
(i) Capital Inflows
Prior to the 1980s, equity investment in Australia was the predominant form of capital inflow. Almost all borrowing was of a direct nature; for example, between an overseas parent company and its domestic subsidiary. Portfolio borrowing of a short-term nature was insignificant relative to these sources of finance (See Figure 15.[38]) The nature of capital inflows changed dramatically in the 1980s. While equity investment remains an important source of finance, it has been surpassed by short-term portfolio borrowing. This increased from around ¾ of one per cent of GDP in 1979/80 to 4¼ per cent of GDP in 1981/82. It has since fluctuated around this level.
The rapid rise in short-term borrowing has been due to a number of factors. Deregulation has been important. The removal of short-term borrowing restrictions and the need to finance large-scale resource projects during the resources boom contributed to the growth of portfolio borrowing at that time.
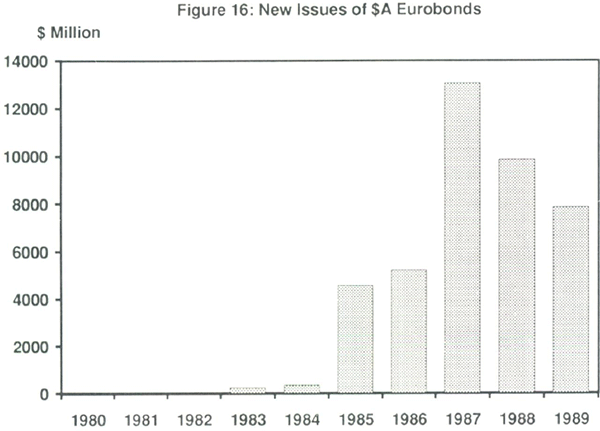
At the beginning of the decade most of this lending was done by foreign banks. Since the removal of exchange controls in 1983 most of the funds are raised through issues of securities in offshore capital markets. An important source of funds in recent years has been the Euro-$A bond market. Outstandings in this market now amount to $37 billion (compared with $50 billion in the domestic government bond market and $66 billion in the bank bill market). In the second half of the 1980s the flows originating in this market were extremely large. They were large enough, in principle, to fund the whole current account deficit. (See Figure 16.)
There have been numerous factors contributing to the growth in this market. Taxation and regulatory considerations have meant that Australian issuers face lower borrowing costs offshore.[39] Also, relatively high interest rates in Australia have encouraged a retail investor base in Europe. A feature of this market is that non-residents have been the predominant issuer since 1985. The growth of non-resident issues has been encouraged by an active swap market in Australia. Non-resident borrowers typically swap the fixed-rate Australian dollar proceeds to an Australian entity and in return receive, directly or indirectly, a floating rate liability in the currency of their preference. This has allowed residents to tap the large European retail funds market.
Another factor underpinning the growth of portfolio borrowing has been a shift in the demand for debt relative to equity. The 1980s have witnessed a marked increase in the gearing of the corporate sector. (For a discussion see Macfarlane (1989)).
(ii) Capital Outflows
Non-official outflows of capital were negligible until the early 1980s but have grown quickly since the beginning of the decade, largely due to a rise in Australian equity investment abroad. This averaged ½ of one per cent of GDP in the first half of the 1980s but rose to an average of 2½ per cent of GDP in the second half of the decade. These developments followed the relaxation of restrictions on portfolio investment overseas and equity and real estate investment overseas in March 1980 and July 1981.
The stock of direct equity investment overseas has risen from 3 per cent of GDP in June 1980 to 9¾ per cent of GDP in September 1989. The stock of portfolio equity investment has risen from less than ¼ of one per cent of GDP in June 1980 to 4 per cent of GDP in September 1989. (Robertson (1990) gives a fuller account of these developments).
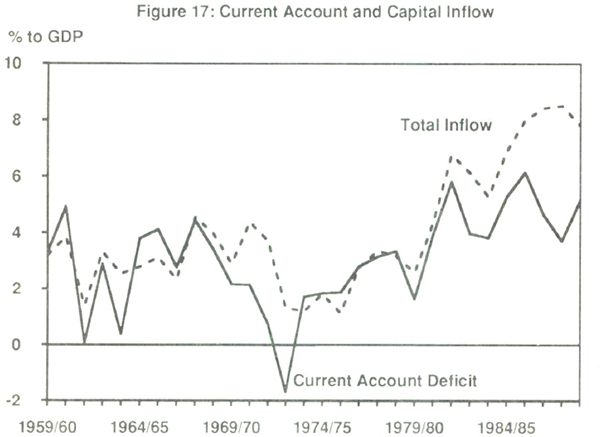
This increase in equity investment abroad must, like the current account deficit, be financed by increased gross capital inflow. Consequently, in every year of the 1980s the gross capital inflow has exceeded the current account deficit. (See Figure 17.) Equity outflow has largely been financed by foreign borrowing. Thus, the increase in external indebtedness has not been entirely due to the persistently high current account deficits. If this Australian equity investment abroad had not occurred then, other things equal, Australia's net foreign debt would be around $40 billion lower. (See Robertson (1990)).
Clearly, there have been dramatic changes in the nature and volume of capital flows as a result of deregulation. These changes have directly contributed to the accumulation of foreign debt by altering the portfolio investment and financing behaviour of the corporate sector. They have also given Australians greater access to foreign savings.
Turning to the issue of capital mobility, there is ample evidence that short-term capital is perfectly mobile and arbitrages riskless profit opportunities[40] but that expected rates of return are not equalized.[41],[42] Feldstein and Horioka (1980) proposed an alternative test of capital mobility. They argued that if capital was perfectly mobile then domestic saving and investment would be uncorrelated. Domestic saving would be allocated around the world depending on relative rates of return. Domestic investment opportunities would compete for funds from the world pool of savings. Feldstein and Horioka found that there was a high degree of correlation between domestic saving and domestic investment. They concluded, therefore, that capital was not mobile.
There are a number of problems with this approach. These are outlined in Appendix 1 which also reports the results of similar tests for Australia. The results show that while there is a significant correlation between saving and investment, that correlation declines over the period which covers the removal of exchange controls and the development of offshore securities markets. This result is not inconsistent with the hypothesis that capital is now more mobile as a result of Australia's more complete integration into world financial markets.
Unfortunately, there are a number of competing hypotheses consistent with these results. The first is that capital mobility, and Australian access to foreign saving, has increased and that this facilitated the widening in the current account deficit. A second possibility is that the apparent change in the saving-investment relationship was due to fiscal policy becoming more lax, particularly early in the decade, with less emphasis being placed on its implications for the current account. The correct interpretation probably lies somewhere between these two. Corden (1989) essentially makes this point when he argues that the fiscal expansion of 1982/83 was made possible by increased access to international capital markets. That is, while this increased access may not have, in itself, directly affected the current account, it permitted the government and subsequently the corporate sector to run larger saving-investment imbalances. Frankel (1989) draws a similar conclusion for the U.S. and argues that ‘financial liberalisation in Japan, the UK and other countries, and continued innovation in the Euromarkets … have resulted in a higher degree of capital mobility, and thereby facilitated the record flow of capital to the United States in the 1980s’ with the magnitude of the flow being determined by the decline in national saving.[43]
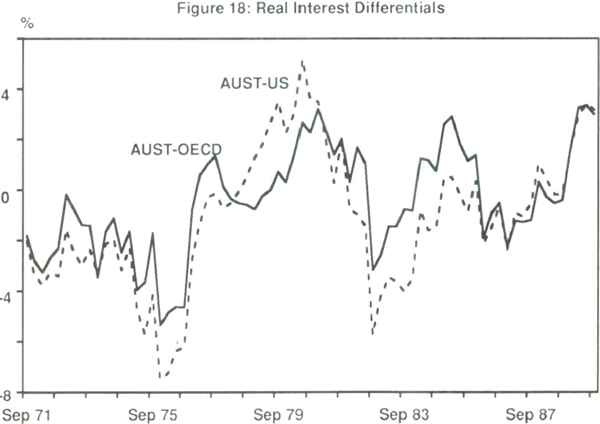
One weak test that might disentangle this is to examine real interest differentials between Australia and overseas. Long-term real interest differentials are shown in Figure 18. If the investment-saving imbalance in Australia had been constrained by restricted access to international financial markets, we might expect to see real rates higher in Australia than overseas, with this premium disappearing as access was opened up. No such pattern can be seen in the data. However, the regulation of nominal rates in the 1970s clouds this interpretation because, as Carmichael (1990) shows, real rates were driven by inflation at that time. It is interesting to note that, on average, the real interest differential was closer to zero in the 1980s than previously. This is consistent with increased capital mobility.
It is also difficult to establish to what extent the rise in capital flows was induced (i.e. a response to changes in expected returns) or autonomous – resulting from, say, shifts in the preferences of international investors.[44] It may be that the distinction between autonomous and induced capital flows is, in any case, unhelpful. The Euro-$A market, for instance, developed because of the interest differential. If exchange controls had been in place to prevent capital inflows, the exchange rate would have been lower (i.e. more depreciated) and the current account would have been smaller by definition. To sort chicken-from-egg in this interaction may not only be impossible, but not very useful.
(d) Monetary policy
The current account response to monetary policy is ambiguous, at least in the short run.[45] A monetary expansion leads to an exchange rate depreciation, but the beneficial effect of the relative price change on the current account will be countered by higher demand. In the longer run, this excess demand will raise domestic prices, leaving the real exchange rate (and the current account) unchanged. The two crucial links in the short-term response – from lower interest rates to a lower exchange rate and from lower interest rates to increased expenditure – are both clear enough in principle, but very difficult to establish empirically. Australian empirical evidence suggests, at best, that interest rates lead expenditure, but there is little evidence on the magnitude and lag structure of the relationship. (See Bullock, Morris and Stevens (1989).[46]) Macfarlane and Tease (1989) find that policy reaction to exchange rate changes makes it difficult to quantify the relationship between domestic interest rates and the exchange rate. Given these problems in estimating the expenditure and exchange rate responses to monetary policy it is difficult to determine the short-run effect of monetary policy on the current account.
The period from April 1988 to January 1990 presents an interesting example of the interaction of tight monetary policy, terms of trade shocks and the current account. There can be little doubt that the tight monetary policy of that period was one of the factors causing and maintaining the appreciation of the exchange rate. This was acknowledged in the RBA Annual Report: ‘in the short run, there may be perverse effects on the balance of payments if higher interest rates produce an exchange rate appreciation’.[47] But tight policy was not the only factor in the appreciation: the rise in the terms of trade, of itself, required a real appreciation. Domestic expenditure was increasing at an excessive rate and threatening inflation objectives. Had policy been easier through this period, then some adjustment of the real exchange rate would have been achieved through higher domestic inflation rather than by nominal appreciation. Blundell-Wignall and Gregory (1989) have shown that, in most cases, the appropriate response to terms of trade disturbances is to allow the nominal exchange rate to adjust. Monetary policy should not attempt to offset this.
5. Relative Prices and Resource Shifts
This section brings together the earlier findings and examines how relative prices and resources have shifted in response to the various disturbances.
(a) The Real Exchange Rate, Relative Prices and Trade Volumes.
The factors influencing the current account changed during the course of the decade. To recap: at the beginning of the decade the large rise in investment resulted in a rise in the current account deficit. The recession of 1982 brought temporary relief, but the expansion of fiscal policy and the economic recovery saw the current account widen. Beginning in 1985 there was a large fall in the terms of trade. Fiscal policy was tightened. The potential effects of this tightening on the current account were offset, after 1987, by a rise in investment and the terms of trade. To slow the economy, monetary policy was tightened, beginning in April 1988. Figure 19 plots a number of measures of the real exchange rate.[48]
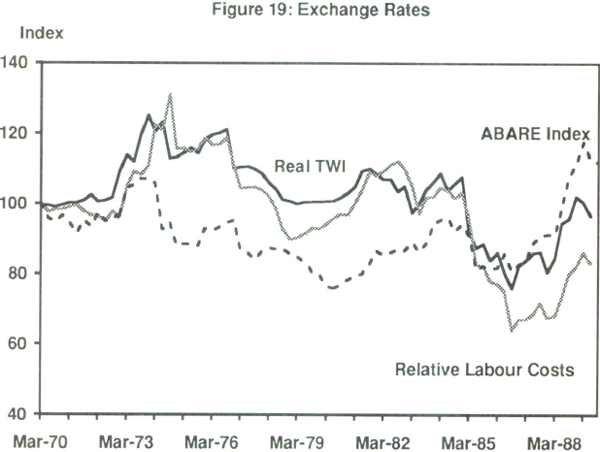
The perceived increase in the rate of return to Australian capital and the rise in domestic expenditure in the late 1970s/early 1980s contributed to a nominal and real exchange rate appreciation. During most of this period long-term real interest rates in Australia were relatively high. (See Figure 18.) Investment peaked in 1981/82 and the economy contracted in 1982/83. The interest differential reversed and the exchange rate depreciated. These developments were quickly offset by a large expansion of fiscal policy. As a result of the above factors the real exchange rate remained, on average, above its level of mid 1979 for about six years.
This reduction in competitiveness and rapid expenditure growth (punctuated by the effects of the 1982/83 recession) resulted in rapid import growth and subdued exports (although exports were also constrained by the domestic drought and slow world growth).
The sharp fall in the nominal and real exchange rate commencing in 1985 and its subsequent rise corresponded to large movements in the terms of trade. The reduction in the real exchange rate in 1985/86 and the tight demand management policies tended to constrain imports through 1985/86 and 1986/87. Export values, and particularly volumes, began to pick up relative to GDP. These developments were offset as the rapid rise in investment and the tightening of monetary policy through 1988 and 1989 led to a relative rise in Australian real interest rates that reinforced the effects of the terms of trade on the real exchange rate. The real exchange rate began to appreciate in 1987. This, coupled with rapid expenditure growth, led to a substantial rise in imports.
The importance of demand and relative prices (the price of domestically-produced goods relative to the price of imports) as determinants of endogenous imports is illustrated in Figure 20. Most Australian studies, for example, Horton and Wilkinson (1989), find an income elasticity of imports greater than one in both the short and long run. Typically, the relative price elasticity is statistically significant and less than one. Relative prices tend to move pro-cyclically, suggesting that excess demand pressures and the monetary response to them are manifest in a higher real exchange rate.
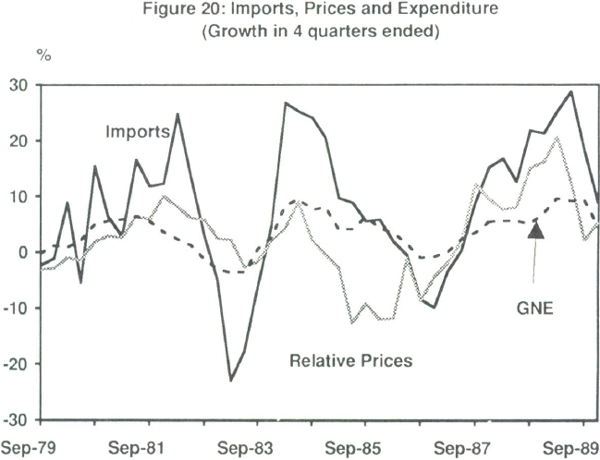
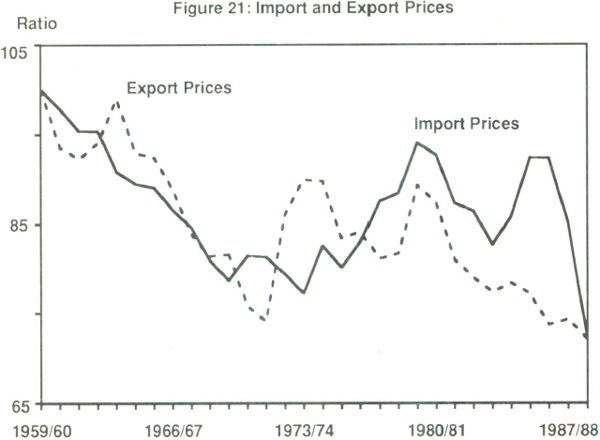
Figure 21 plots export and import prices relative to the GDP deflator. These relative price terms may be viewed as an adjunct to the more widely-used measures of competitiveness. For instance, a rise in import prices relative to domestic prices may encourage firms into the import-competing sector and shift demand toward domestically-produced goods. Both import and export prices fell relative to domestic prices during the 1960s. This fall ended in the mid 1970s and both measures rose until the beginning of the 1980s. During the 1980s export prices fell relative to domestic prices. The effects of the large depreciation commencing in 1985 offset a fall in export prices in foreign-currency terms. The subsequent rise in export prices in foreign-currency terms was, again, offset by the appreciation of the Australian dollar. Import prices have also fallen relative to domestic prices over the decade. The sharp rise in import prices in the mid 1980s coincided with the depreciation. An appreciation of the exchange rate contributed to the relative fall in import prices from 1987. The data suggest that the effects of the earlier depreciation on competitiveness have now been largely eroded.
(b) Traded and Non-Traded Goods
What do these relative price movements imply for resource shifts between the traded and non-traded goods sectors? Figure 22 plots the tradable goods sector's share of GDP.[49] The share of the traded goods sector in GDP has fallen since the mid 1970s. The decline was particularly rapid between 1974/75 and 1982/83. The apparent trend decline in the tradables share of GDP appears to have been halted in the early 1980s. Its share has risen a little since then.
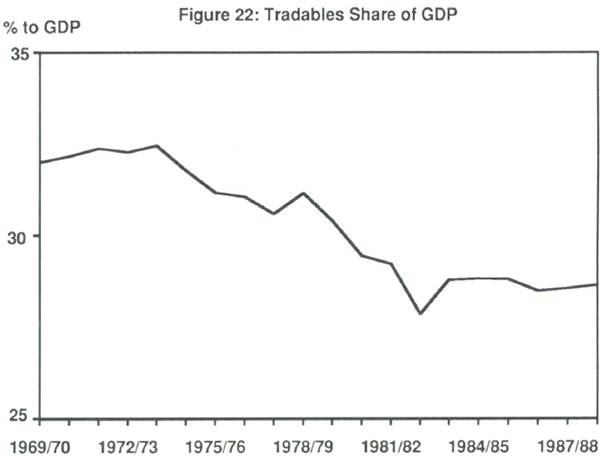
Figure 23 plots the same story in the form of the rate of growth of real output of the two sectors. In only three of the nine years between 1974/75 and 1982/83 did the tradable-goods sector experience output growth. In contrast, the non-traded sector continued to experience solid growth throughout this period. Since 1983/84 output growth of the traded goods sector has slightly exceeded that of the non-traded goods sector.
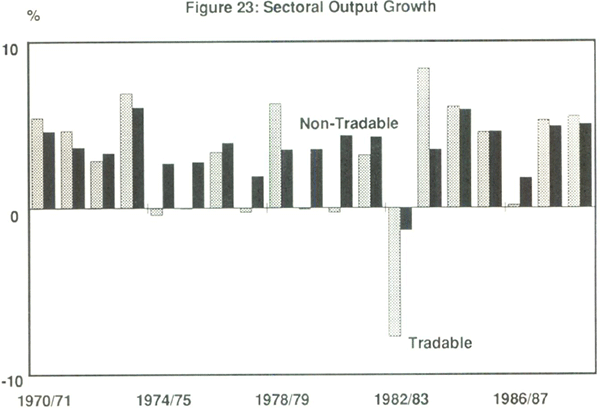
The behaviour of the traded-goods sector has tended to reflect movements in relative prices. The fall in traded-goods production between 1974/75 and 1977/78 occured after a large and sustained appreciation of the real exchange rate. The manufacturing sector (which is largely import-competing) was the main factor behind the decline in the tradables sector in that period. Manufacturing output fell in three of the four years between 1974/75 and 1977/78. This is not surprising given that the ratio of import prices to domestic prices (Figure 21) was very low. As import prices rose towards the end of the 1970s manufacturing output recovered. It subsequently slowed in the early 1980s before falling in 1982/83.
The depreciation of the exchange rate, coupled with real wage moderation, has contributed to the recovery in manufacturing output in the past few years. This, in turn, was the major factor underlying the output growth of the tradable sector since 1984/85. However, as a result of the appreciation since 1987, import prices are now at historically-low levels relative to domestic prices. To the extent that these relative prices measures are indicative of the incentive to shift resources into the traded-goods sector, the prospects for a further shift of resources to this sector may be limited. This observation is consistent with the recent behaviour of investment in the traded-goods sector.[50] It appears that the proportion of investment going to the tradables sector rose after the large depreciation but has subsequently fallen as the exchange rate has appreciated.
6. Long-term Equilibrium
It was noted in the introduction that the 1980s have seen a return to the earlier concerns about overly-large current account deficits and a growing concern with the rapid accumulation of foreign debt. Indeed, many commentators, by simply extrapolating the present external position, see Australia inexorably heading towards a ‘debt trap’. With these concerns in mind, this section addresses issues about long-term equilibrium.
So far our attention has been focused on the equilibrating mechanisms – through relative prices and income – that operate to maintain the two halves of the X-M/S-I identity. This section will consider the equilibrating or stabilising factors which seem to prevent the overall size of the imbalances from getting too large.
Before attempting to identify what these equilibrating forces are, we look at the facts from two viewpoints – from the X-M side of the dichotomy and from the S-I side.
Consider first the behaviour of exports and imports. Table 1 reports the results of cointegration tests on imports and exports, to see whether some (unspecified) forces are tending to make them move together in the long run. The table shows that nominal imports and exports are cointegrated and that real imports are cointegrated with real exports and the terms of trade.[51] This is consistent with the hypothesis that, in the long run, nominal import growth is constrained by nominal export income and that real import growth is constrained by real exports and the terms of trade. These results suggest, for instance, that a permanent change in the terms of trade may have little long-run effect on the current account. Furthermore, they imply that the opening of new export markets or policies aimed at shifting resources into industries that are likely to experience relative price rises, other things equal, may not significantly alter the current account position in the long run but may increase income growth. They also support Forsyth (1990) who argues that micro-economic reform aimed solely at boosting productivity and income will not, in itself, reduce the current account deficit over time.
| Nominal Variables (Sample 1969:3; 1989:3) | ||
|---|---|---|
| Goods | ||
| Mt = −1.14 + 1.13 Xt | ADF = −4.73 | |
| Goods and Services | ||
| MGSt = −0.71 + 1.09 XGSt | ADF = −4.72 | |
| Real Variables (Sample 1974:3; 1989:3) | ||
| Goods | ||
| Mt = −4.29 + 1.15Xt + 0.64TOTt | ADF = −3.39 | |
| Goods and Services | ||
| MGSt =−3.36 + 1.04Xt + 0.67TOTt | ADF = −2.99 | |
| M, X = imports, exports of goods. MGS, XGS = imports, exports of goods and services. TOT = terms of trade ADF = Augmented Dickey-Fuller statistic. All data are quarterly |
||
Now consider the saving-investment side. By observing that countries tended to have highly-correlated saving and investment, Feldstein and Horioka (1980) concluded that capital was not mobile. That is, saving-investment imbalances (and the current account) were prevented from getting too large because of limited capital flows. The results reported earlier for Australia showed that although the correlation declined over time (indicating increased capital mobility) there was a significant correlation between saving and investment.
The standard interpretation of this result is that it indicates less-than-perfect capital mobility. This is probably not the case. If there are endogenous or policy responses to external imbalances that limit the overall size of the current account deficit then, even with perfect capital mobility, there will be a significant correlation between domestic saving and investment. On this interpretation, the results reported earlier are not inconsistent with both the increase in capital mobility over time and the presence of factors limiting the size of the current account deficits.
What have these factors been in Australia? Was the saving-investment imbalance constrained by limited access to foreign funding, resulting in lower investment and/or higher saving than would have occurred otherwise. Was it policy responding to impending current account crises? Or was export income limiting our capacity to import? One factor that probably has not been important to date, but may be in the future, is foreign debt. The recent accumulation of foreign debt has probably not affected private expenditure. One reason for this is that the rise in private sector wealth in the 1980s has probably mitigated the wealth effects of rising external debt. Each of the above factors – limited access to foreign capital markets, policy responses to excessive deficits and expenditure responses to the terms of trade – seem to have played a role in applying some constraint to the current account. It is likely, therefore, that a weakening of some of these factors in the 1980s played a role in the widening of the deficit.[52]
7. Some Unresolved Issues: Foreign Debt and the Equilibrating Role of the Foreign Exchange Rate
The large rise in the stock of foreign debt attracted considerable attention during the decade.[53] There was a wide range of views on the subject. While some suggested that the build-up of foreign debt may not be a matter of concern for macro-policy purposes, there were others who suggested that foreign debt is Australia's major economic problem.
Net foreign debt increased from 5 per cent of GDP in 1980/81 to 33 per cent of GDP in 1988/89. This rapid increase in the stock of foreign debt was due to the persistently-high current account deficits experienced during the decade, the rise in Australian equity investment abroad (and the commensurate funding requirements) and the switch to portfolio borrowing as the predominant source of capital inflow. Debt is only one component of Australia's net liabilities to the rest of the world, therefore our net equity position must also be taken into account. Figure 24 plots the behaviour of net foreign debt and Australia's net international investment position which is defined as the difference between the stock of gross foreign investment in Australia and the stock of gross Australian investment abroad, both debt and equity.
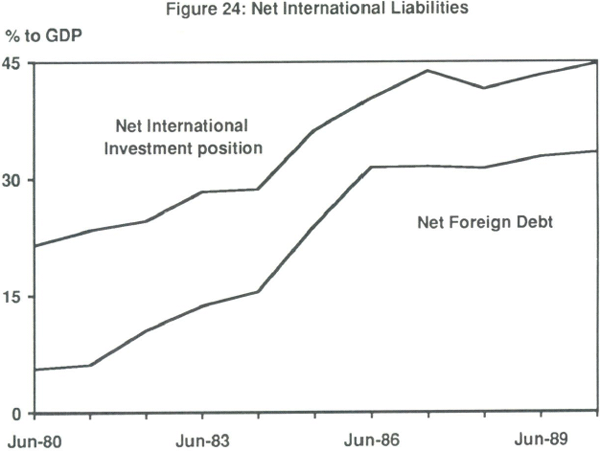
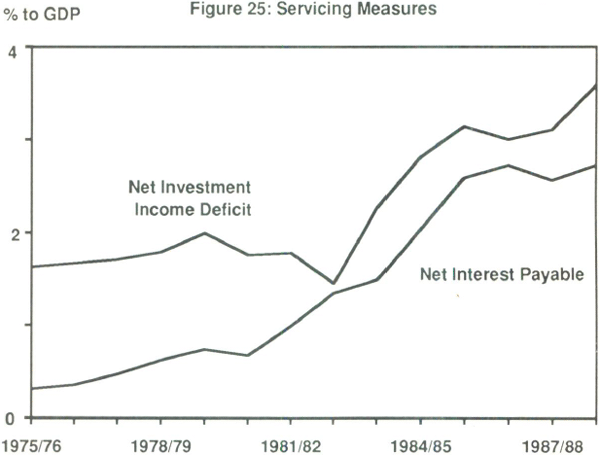
The growth in the net international investment postition has been slower than that of net foreign debt. The net international investment position was much higher than net foreign debt at the beginning of the 1980s. This reflected the predominance of net equity inflow up to this time. (See Section 4 (c)). The rapid rise of both debt inflows and Australian equity investment abroad has seen this gap narrow in the 1980s. As noted in Robertson (1990), the growth in net foreign debt tends to overstate the pace of increase in Australia's reliance on overseas financing. Nevertheless, on either measure Australia must now devote a greater proportion of domestic production to servicing foreign liabilities. Figure 25 plots a number of measures of debt servicing.
Some commentators have seen Australia inexorably sliding towards a debt trap. Simple extrapolation of the recent current account position implies an unsustainable debt increase (i.e. where debt/GDP rises continuously). Others have pointed to possible adjustment paths – involving smaller current account deficits – towards a stable debt/GDP ratio. (See Office of EPAC (1986, 1989a).) While these exercises are useful for giving a feeling for the orders of magnitude involved, they ignore the fact that growing foreign debt will cause responses that will eventually bring us to some equilibrium position. Concerns about debt/GDP expanding forever are therefore unfounded. Fahrer (1990) has shown that the conditions for a stable debt/GDP outcome to be reached are easily met. Also, the results of the earlier tests show evidence that, in the long run, imports are constrained by export income. (See Section 6.) An important question is whether this adjustment process is costless.
Some argue that when the government's accounts are in balance, the current account deficit or surplus reflects the outcome of rational saving and investment decisions taken by households and firms.[54] If the deficit is due to higher consumption, this simply reflects the household sector's preference for current rather than future consumption. If it is due to investment, then firms expect that the returns to the investment will be sufficient to meet the future interest costs.[55] Therefore, unless there are costs of external adjustment which are independent of, and larger than, the costs of policies aimed at bringing that adjustment about, there is no role for policy.[56]
They acknowledge that some current account deficits may be undesirable to the extent that they reflect excessive government spending, excess demand or distortionary taxes or regulations. In these cases, however, it is not the current account that is the problem; it is merely the symptom. Reducing government spending or excess demand and removing distortions are desirable in their own right, irrespective of the implications for the current account. It is possible therefore that certain deficits are ‘bad’ while others are ‘good’; OECD (1989).
In some models that underly this ‘equilibrium view’ there is no role for policy; prices are flexible and the adjustment path after a shock is the welfare-maximizing one. Fahrer (1990) develops a model that introduces inertia to current account adjustment which is assumed to derive from a sticky real exchange rate. The adjustment path of this model in response to a number of shocks is then compared to that of a model in which there is no inertia. Two results emerge. The first is, that even with a sticky real exchange rate, external debt is not a problem in that it will eventually stabilise. However, the adjustment path to that point deviates from the welfare-maximizing path. This implies that there is scope for pursuing welfare improving fiscal policies to replicate the welfare maximizing outcome. While the fiscal rules derived from this model are not useful for practical purposes, the analysis demonstrates that there is at least theoretically a role for activist fiscal policy in response to shocks to the current account.
All this relies on the exchange rate playing a key equilibrating role. How effective is it, in practice, in this role? Dornbusch (1989) argues that a number of issues must be considered when assessing whether the exchange rate ‘works’ as a costless adjustment tool. These include:
- does the exchange rate affect relative prices and, in turn, trade volumes?;
- does exchange rate adjustment minimize excess volatility and the misallocation of resources?; and
- will the financing of a given external debt proceed smoothly over time?
Most Australian studies show that nominal exchange rate changes do alter relative prices. There appears to be significant pass-through of exchange rate changes into import prices. See Coppel, Simes and Horn (1988) and Phillips (1988, 1989). Pass-through on a dissaggregated basis was examined by BIE (1986, 1987, 1988) and Lattimore (1989). These studies tended to find that the extent of pass-through varied between industries but in general was high. There is also considerable evidence that relative prices have a significant effect on import volumes. (See Horton and Wilkinson (1989) and Phillips (1989).) In general it has been more difficult to identify a significant relationship between exports and relative prices. See Macfarlane (1979). However, Gordon (1986) examined Australian empirical evidence and concluded that import and export price elasticities were such that a depreciation would reduce a trade account deficit.
More problematical is whether the exchange rate automatically finds the ‘proper’ level to induce the required adjustment. The evidence that the exchange rate adjusts quickly to shifts in fundamentals and therefore minimises resource costs is not compelling. Australian and international evidence shows that the foreign exchange market is not efficient in a technical sense.[57] Expected returns do not appear to be equalised across countries. Smith and Gruen (1989) argue that in the case of Australia this has little to do with the risk preferences of market participants. They find that, ex-post, investors are over-compensated for holding Australian-dollar assets and that these excess returns are too large to be accounted for by conventional measures of risk. Over long periods since the float, what they gained from high interest rates in Australia vis-a-vis the rest of the world, they do not lose in terms of a depreciation of the Australian dollar in terms of other currencies. A possible explanation is that the expectations of market participants are not formed ‘rationally’. It appears that the market does not incorporate all available information into its pricing decisions. Furthermore, Frankel and Froot (1987) and Nakao (1989) find that expectations appear to be formed extrapolatively. That is, if the market observes an appreciation in the present period then it will expect an appreciation next period. This means that the exchange rate can drift away from from a value implied by fundamentals.
It appears, therefore, that there is the potential for the exchange rate to result in a misallocation of resources. This is because, in the short run, movements of the nominal exchange rate do not appear to be entirely explained by fundamentals.[58]Over the longer run, the available evidence suggests that there is a tendency for the nominal and real exchange rate to move with fundamentals (particularly the terms of trade and relative inflation). (Blundell-Wignall and Thomas (1987), Blundell-Wignall and Gregory (1989) and Macfarlane and Tease (1989)). However, the evidence that the exchange rate responds in a way to reduce current account imbalances is limited. This is partly due to the fact that both the current account and the exchange rate are endogenous and therefore the behaviour of the exchange rate vis-a-vis the current account depends on the nature of the underlying disturbances. Nevertheless, there appears to have been no long-run tendency for the real exchange rate to depreciate to offset the widening of the current account deficit.
The extent to which a given external balance will be financed smoothly over time is difficult to answer. A good deal depends on the perceptions of the financial markets. One argument for concern about high overseas debt is that, at some point, the financial markets will come to view the situation as unsustainable and therefore lead to an abrupt and disruptive change in the exchange rate. The experience of the past few years has shown that financial markets, both domestic and foreign, have been more forgiving than most commentators would have thought. In the main, growing external imbalances have been financed relatively smoothly. (Although this does not mean that they will continue to do so). However, there have been occasions when there have been sharp changes to the exchange rate. Smith and Gruen (1989) find that the Australian dollar is more skewed than other currencies (i.e. falls tend to be sharper than rises). They suggest that this is due to the perceived need for external adjustment, which makes holders of $A nervous whenever there is weakness in the foreign exchange market.
While a depreciation of the Australian dollar is part of the adjustment needed to reduce the current account deficit, the way in which these depreciations occur places strains on the economy and induces policy responses. For instance, the cumulative depreciation of around 40 per cent between early 1985 and May 1986 raised concerns about the capacity of the economy to absorb such a large relative price change. Consequently, monetary policy was tightened. (See Macfarlane and Tease (1989)). The OECD (1988, 1989) suggest that one of the consequences of having an unsustainable adjustment path is the need for abrupt changes in policy.
This evidence, taken together, suggests that while over the longer term the exchange rate responds to the terms of trade and relative inflation and induces responses in relative prices and trade volumes that one would expect, it can, for a period, be influenced by short-term market-driven phenomena. As a result, there is the potential for a misallocation of resources. This may hinder the adjustment towards the optimal current account/external debt position. Furthermore, while the financing of the external imbalance has occured smoothly relative to some expectations, it appears that the external adjustment problem has resulted in some unusual behaviour in the foreign exchange market.
On the basis of the above discussion, the ‘middle ground’ in this debate would involve:
- acknowledging that there are ‘good’ and ‘bad’ deficits, but that even when a ‘bad’ deficit is identified (i.e. one which reflects fiscal imbalance, distortions or externalities), the appropriate response is to address the problem directly; and
- recognising that if the world market has volatile and discontinuous changes of sentiment about a country's credit worthiness, then adjustment (when it comes) may be traumatic. There may be a role for policy in bringing-forward or softening the adjustment process. Even where this is accepted, the exact policy prescription is not clear.
8. Conclusion
Two of the economic events that distinguished the 1980s from earlier decades were the apparent structural increase in the current account deficit and the rapid accumulation of foreign debt. Over the three decades from 1950 to 1980, the current account deficit averaged 2½ per cent of GDP. Generally, the deficits experienced during the 1980s were double this earlier figure.
The paper argued that the major influences on the current account shifted over the course of the decade. The low level of national saving (which was largely due to the decline in public saving) underpinned the deficit in the first half of the decade. This was exacerbated at the beginning of the decade by a sharp rise in private investment. Even though investment subsequently fell to historically-low levels, the current account failed to narrow markedly as fiscal policy became expansionary and private saving fell during the 1982/83 recession. Each of these factors contributed to an appreciation of the real exchange rate during this period and left the real exchange rate above its earlier level for a considerable time. This reduction in competitiveness, coupled with the rise in expenditure, resulted in a sharp widening of the current account deficit. In hindsight, the response of the current account to these shocks was not surprising. This cannot be said for the behaviour of the current account in the second half of the decade.
Despite a large depreciation of the nominal and real exchange rate between early 1985 and mid 1986, a substantial contraction of fiscal policy and subsequently a large rise in the terms of trade, the current account showed little sustained narrowing and continued to fluctuate around 5 per cent of GDP. This can largely be explained by a large rise in private investment (due to increased profitability resulting from sustained real wage reductions). The rise in the terms of trade was not reflected in increased saving and therefore a reduction in the current account deficit. These shocks placed upward pressure on income, expenditure and the real exchange rate. The tightening of monetary policy beginning in 1988 may have exacerbated this exchange rate rise and contributed to the widening of the deficit but domestic anti-inflationary objectives dictated that monetary policy should resist the surge in domestic expenditure. The earlier depreciation was partly reversed and the current account response to the reduction in the Public Sector Borrowing Requirement was therefore inhibited.
While the shocks mentioned above contributed to this, the deregulation of the financial markets, the abolition of exchange controls and the development of offshore markets in $A-denominated securities, facilitated the increased foreign borrowing. These factors increased the mobility of capital and gave domestic agents (the government at the beginning of the decade and the private sector at the end) greater access to foreign savings to finance their expenditures. Also, the abolition of exchange controls led to a switch to debt rather than equity finance. The deregulation of the financial markets, coupled with relatively high domestic inflation and distortions in the tax system, may have also contributed directly to the rise in the current account deficit by altering saving and investment decisions.
Can Australia's current account deficit be classified as good or bad? A case can be made that the deficits experienced between the mid 1970s and the mid 1980s were generally bad. They reflected a rapid rise in public sector spending not funded by current taxation. For most of this period (excluding the resource boom) private investment expenditure was subdued. (As a proportion of GDP it was well below its levels of the 1960s). Thus the increase in foreign borrowing in this period did not finance a large increase in the capital stock: rather it financed increased public consumption.[59] On the other hand, it can be argued that the most recent deficits can be classified as good. The public sector accounts have moved into surplus and public expenditure and private consumption have declined relative to GDP. The deficits have financed a substantial rise in private investment expenditure. To the extent that this investment is profitable, it will finance the servicing costs without requiring lower consumption in the future. Some of the recent deficit reflects cyclical excess demand in 1988 and 1989 which has since been eliminated.
Appendix 1.
Feldstein and Horioka (1980) argue that in a world of perfect capital mobility, domestic saving and investment should be uncorrelated. The crux of the argument is that in the absence of capital flows domestic saving and investment are by definition equal. A rise in domestic investment opportunities will boost real interest rates to induce the extra saving needed to finance them. With perfectly mobile capital this need not be the case because a country then faces an elastic supply curve of funds from overseas. To test their proposition Feldstein and Horioka estimated;
Where,
I = gross national investment;
S = gross national saving; and
Y = gross domestic product.
They argued that if capital is perfectly mobile then β should equal zero. Their results showed that this was not the case and they therefore concluded that capital was not mobile.
It is now well known that a high correlation between domestic saving and investment does not necessarily imply limited capital mobility. Dooley, Frankel and Mathieson (1987) show that for saving and investment to be uncorrelated, then investment must only depend on the domestic real rate of return, that the country be small so that the world real rate of return is exogenous and that capital be mobile so that the domestic and foreign real rates of return are equal. Violation of any one of these conditions will result in a correlation between domestic saving and investment. However, if each of these conditions hold then they argue that the correlation should be zero. This conclusion is also probably incorrect. This is because, in the limit, it implies that there is no mechanism that brings the current account into equilibrium or stablilises the net external debt to GDP ratio. For example, a correlation of zero implies that a country can persistently run extremely large current account deficits and indefinitely build-up external debt without this having any effect on expenditure patterns. That is, it depends on there being no effect on expenditure or policy from the diminution of net wealth caused by rising external debt. This does not seem to be a reasonable medium-term assumption. Once this channel is acknowleged then it is theoretically possible to have perfect capital mobility and still have a non-zero correlation between saving and investment. Nevertheless, estimating the Feldstein-Horioka equation remains useful in that lower (though non-zero) correlation remains consistent with the hypothesis of higher capital mobility.
In addition to these theoretical problems there are some econometric difficulties. In particular, domestic saving is endogenous which means that shocks that impinge on investment may also alter saving behaviour. The fact that saving and investment are procyclical is used as evidence of common influences. Edey and Britten-Jones (1990) show that this is undoubtedly the case for Australia. Unless the endogeneity of saving is accounted for in estimation, the results may be biased toward showing a high degree of correlation.
Most subsequent studies have confirmed Feldstein and Horioka's original results. See Penati and Dooley (1984) and Dooley, Frankel and Mathieson (1987). However, Feldstein and Bacchetta (1989) and Frankel (1989) have found that the correlation between saving and investment has reduced over time and conclude that this is consistent with the move to more liberal financial markets.
Table 2 reports the results of testing equation 1 for Australia.[60]
| I/Yt = α + β S/Yt + ut | ||||
|---|---|---|---|---|
| Sample |  |
 |
 |
DW |
| 1963–1983 | 0.13 (0.07)* |
0.57 (0.29)* |
0.17 |
2.00 |
| 1963–1989 | 0.16 (0.04)** |
0.43 (0.20)* |
0.31 |
1.98 |
| Footnotes *(**) denotes significantly different from zero at the five (one) per cent level. All equations have been corrected for serial correlation. Standard errors are in parentheses. All data are annual. |
||||
The results in Table 2 show that the coefficient on domestic saving is significant in each period but falls as additional observations are added. Thus when the period of reduced capital controls and the development of offshore $A markets is added to the original sample (1963–1983) it appears that the correlation between saving and investment declines. This is consistent with the hypothesis that capital flows are now more mobile.
Footnotes
Reserve Bank of Australia. This paper benefited greatly from the advice of Stephen Grenville. I am also grateful for the thoughtful comments provided by Malcolm Edey, Jerome Fahrer, David Gruen, John Laker, Rory Robertson and Jenny Wilkinson. The paper has also incorporated several suggestions provided by John Pitchford. Finally, I would like to thank the staff of the Activity and Balance of Payments Sections of Research Department for their assistance during the preparation of the paper. Any remaining errors are mine. [*]
Report of the Committee of Economic Enquiry (1965) (the ‘Vernon Committee’) p. 146. [1]
Corden (1968) p. 15. [2]
Stone (1979) p. 4. Emphasis as in original. [3]
Salter (1959) and Swan (1960). [4]
Equilibrium was clearly seen as requiring policy action. ‘It is not an automatic mechanism: conscious action by the authorities is required to prevent overspending, to keep real wages in line with long run movements in productivity and the terms of trade’. Swan (1963) p. 385. [5]
Corden (1979) p. 382. [6]
A further point to note is that, in principle, the current account deficit is also identically equal to the capital account surplus. Capital flows do not adjust passively to changes in the current account; any disturbance impinging on the current account must induce changes in the expected rate of return or risk on domestic relative to foreign assets. [7]
This is also important for assessing the link between the current account and the real exchange rate. The behaviour of the current account vis-a-vis the real exchange rate depends on the nature of the underlying disturbances. Two shocks that have identical effects on the current account may imply completely different paths for the real exchange rate. For this reason analyses that begin with the premise that the current account deficit is large because the real exchange rate is ‘too high’ can be misleading and shift attention away from the fundamental causes of the current account deficit. [8]
See Mundell (1968) and Frenkel and Razin (1987a,b). Sachs (1980), Turner (1986) and Frenkel and Razin (1987b) discuss some of the problems of the Mundell-Fleming approach. [9]
For a discussion of the twin deficits hypothesis see Genberg (1988) and Nguyen (1990). [10]
Open economy models in this tradition have been used by Obstfeld (1980, 1981, 1982), Sachs (1981a,b), Dornbusch (1983), and Svensson and Razin (1983). Other references can be found in the bibliography. A detailed exposition can be found in Frenkel and Razin (1987a). [11]
There is an extensive literature on the effect of transitory terms of trade shocks on the current account. See Obstfeld (1980, 1982), Dornbusch (1983), Svensson and Razin (1983), Persson and Svensson (1985), Frenkel and Razin (1987a) and Ostry (1988) for examples. This literature shows that real interest rates may also change in response to the terms of trade. Real interest rates may rise or fall depending on the nature of the shock. If they fall then the income effect may be offset by the intertemporal substitution effect, leaving the current account unchanged. [12]
Macfarlane (1979) examines factors behind this decline. [13]
The saving and investment measures are based on ABS national accounts estimates. The difference between saving and investment is equal to net lending to overseas plus the statistical discrepancy. [14]
For example, business fixed investment rose by 17 per cent in 1980/81 and 12 per cent in 1981/82, rates not seen for twenty years. [15]
Derrick, McDonald and Rosendale (1981), contains a profile of export earnings that were expected from these resource developments. [16]
Gruen (1986) discusses Australia's long-term economic performance in detail. [17]
This has, in part, contributed to the decline in the terms of trade by increasing the supply of agricultural commodities. [18]
EPAC (1986) note that the rise in the current account deficit between 1983/84 and 1985/86 can be attributed to valuation effects of the depreciation of the Australian dollar and the decline in the terms of trade. [19]
These data are taken directly from Figure 3 in Edey and Britten-Jones (1990). [20]
McTaggart and Rogers (1989) have noted an apparent strong secular relationship between the terms of trade and the household saving ratio. This relationship is probably spurious because, as Edey and Britten-Jones (1990) show, when private saving is adjusted for inflation there is no trend in the private sector savings ratio. Furthermore, the suggestion that the trend decline in the terms of trade is manifest in a trend decline in private saving and therefore a rise in the current account deficit is theoretically weak. [21]
The methodology can be found in the Reserve Bank of Australia Bulletin, April 1986. The volume effect is calculated by holding import and export prices constant between each quarter and calculating the change in the deficit due to changes in trade volumes. The terms of trade effect is calculated by holding volumes constant between each quarter and obtaining the change in the deficit due to changes in the terms of trade. [22]
They argue, however, that the easing in monetary policy in 1987 limited the rise in the nominal exchange rate and resulted in part of the adjustment coming through higher inflation. [23]
Examples include the United States, the United Kingdom, Denmark, Canada, Belgium, Sweden and New Zealand. [24]
See Alesina, Gruen and Jones (1990) for a discussion of the cross-country experiences. [25]
Most of the literature has focused on the relationship between the public sector deficit and the current account deficit. More recently, a number of authors have examined how the composition of the public sector's accounts and the structure of the tax system influence the current account. See, e.g. Genberg (1988), McKibbin and Morling (1989) and Alesina, Gruen and Jones (1990). [26]
To a certain extent the movements of the PSBR have been cyclical. However, the broad trends in the PSBR reflect structural changes in fiscal policy. Nevile (1989) has shown that after running structural surpluses in the first half of the 1970s Australia experienced structural deficits in the second half of the decade. Fiscal policy was tightened in a structural sense in the early 1980s then it became very expansionary after 1982/83 before being subsequently tightened. [27]
The widening of the current account in 1973/74 reflected a ‘return to normality’ after the terms of trade change the year before. It was not related to, and preceded, the subsequent fiscal expansion. [28]
The rise in investment does not, in an accounting sense, completely explain the offset to fiscal policy. Since 1983/84 the PSBR has been reduced by a little under 8 per cent of GDP yet the current account deficit is about 1½ per cent of GDP wider than in 1983/84. The bulk of the offset was due to private investment which rose by 5½ per cent of GDP. Private saving has fallen by around 1½ per cent of GDP. The rest of the offset was accounted for by a rise in the statistical discrepancy of 2½ per cent of GDP. [29]
There have been a number of attempts to assess the relationship between the PSBR
and the current account with the aid of macroeconometric models. In these
models, there is a tendency for fiscal expansion to lead to a rise in the
current account deficit. However, the extent of the rise in the current account
deficit varies between the models.
Kouparitsas, Pearce and Simes (1989), using a version of the NIF88 model, find that
a bond-financed rise in government spending results in a rise in the current
account deficit of about half the size of the fiscal impulse. Some of the
public sector dissaving is offset by private sector net saving.
McKibbin and Elliot (1989) find that a permanent rise in government spending of
one per cent of GDP in the MSG2 model increases the current account deficit
by about ½ of one per cent of GDP initially and by ¾ of one
per cent of GDP after five years. Murphy (1989) shows that a rise in public
sector debt (resulting from tax cuts) is fully reflected in a rise in foreign
indebtedness but only after a considerable delay. Results from the ORANI
model (Freebairn (1989)), which has a different framework to the models mentioned
above, are broadly similar. In contrast, the IMP model suggests that the
link between fiscal policy and the current account is negligible. (See Hughes
(1989)). Parsell, Powell and Wilcoxen (1989) compare some results from the
MSG2 and Murphy models.
While it is difficult to compare the results from alternative models, some reasonable
conclusions can be drawn from the above discussion. First, these models incorporate
a tendency for fiscal expansion to lead to a rise in the current account
deficit. This adjustment in the current account occurs over the medium to
longer term (from two to five years). Second, the ‘elasticity’
of the current account to changes in fiscal policy may be higher than one
half but lower than one. The effects of fiscal policy on the current account
are offset by a rise in real interest rates and a reduction in private sector
wealth (due to the rise in external indebtedness) which constrain private
expenditure.
[30]
In addition to Australia, these economies were Belgium, Canada, Denmark, Sweden and the United Kingdom. [31]
While this paper is about the current account and therefore saving and investment, a lengthy discussion of investment is not warranted. This is because the persistently large current account deficits in the 1980s cannot be explained by a trend rise in investment. However, sharp fluctuations in investment have had large short-run effects on the current account at the beginning and end of the decade. The determinants of investment are surveyed by Carmichael and Dews (1987) and Edey and Britten-Jones (1990). [32]
See Chapman (1990) for a discussion of the behaviour of real wages in the 1980s. [33]
For a description of the exchange control measures see Argy (1987) and Laker (1988). For a discussion of the behaviour of the Reserve Bank since the float see Laker (1988) and Macfarlane and Tease (1989). [34]
During this period and in the 1970s, permission from the Reserve Bank was required before overseas borrowing could be undertaken. [35]
An embargo on borrowing of two years or less was introduced in 1972. The maturity was subsequently reduced to six months in 1974. In 1977 another ban on borrowings with a maturity of two years or less was introduced. All restrictions on short-term borrowing were lifted in 1978 except those for public sector enterprises. For more detail on exchange control measures see Argy (1987) and Sieper and Fane (1982). [36]
The Australian Financial System Inquiry (1982) and Porter (1982) noted that inflows were, to a certain extent, limited by these controls. Sieper and Fane (1982) argued that the VDR may have altered the timing but not necessarily the volume of inflows and discouraged large projects with long planning lead times. [37]
The official sector is defined as the General Government and the RBA, and the non-official sector is defined as private and public sector enterprises. [38]
Funds raised offshore by Australian banks, for example, were not subject to the Statutory Reserve Deposit (SRD) ratio, which only applied to domestic deposits. Also, Euro-$A bonds can be structured so that they are exempt from interest-withholding-tax. Decisions taken at the Loan Council/Premiers' Conferences of 1984 and 1985 gave public sector authorities greater access to offshore sources of finance. [39]
That is, covered interest parity holds once transactions costs are taken into account. See Turnovsky and Ball (1983) and Levich (1985). [40]
That is, uncovered interest parity does not hold. See Hansen and Hodrick (1980), Cumby and Obstfeld (1984) and Frankel and MacArthur (1988) for international studies and Tease (1988) and Smith and Gruen (1989) for Australian evidence. [41]
For an examination of capital mobility in Australia see Macfarlane and Tease (1989). [42]
Frankel (1989) p. 12. [43]
Taxation considerations may have been driving some of the flows. There is no withholding tax on some classes of Australian securities and, even where foreign residents pay tax, they will often receive a higher real return than their domestic counterparts (See Edey and Britten-Jones(1990) p. 136). [44]
In the simplest Mundell-Fleming model, with perfectly elastic supply, monetary policy has powerful effects on output and the current account in the short run because it alters both the nominal and real exchange rate. Once, realistically, some stickiness is added to the supply side, the current account response to monetary policy is ambiguous. See Sachs (1980). [45]
Stevens and Thorp (1989) do not find any support for this. However, they caution against drawing strong conclusions from their results. [46]
RBA Annual Report (1989) p. 7. [47]
One measure adjusts the nominal TWI by relative consumer prices while the other adjusts the nominal TWI by relative unit labour costs. The ABARE index attempts to measure the ratio of non-traded to traded goods prices directly by constructing indexes of traded and non-traded goods prices. [48]
While it is difficult to distinguish clearly between the traded and non-traded goods sectors, for present purposes the tradables sector is defined as the sum of the mining, agriculture and manufacturing sectors. The data in the graph are in constant prices. A similar trend is evident in the current price data. However, there are large fluctuations about that trend reflecting changes in export prices relative to domestic prices. [49]
Conclusions about the amount of investment in the traded-goods sector depend on the data sources used and the classification of what should be included in that sector. See BIE (1989) and Treasury (1989). [50]
In the first three equations the augmented Dickey-Fuller statistic is significant at the five per cent level while in the final equation it is significant at the ten per cent level. Thus, in each of the equations there is evidence of a cointegrating relationship. [51]
FitzGerald and Urban (1989) consider some of these longer-term adjustment issues. [52]
See, for example, the references to Office of EPAC in the Bibliography. [53]
The principal proponent was Pitchford(1989a,c). This view was also expressed by others including Makin (1987, 1989), Harper and Lim (1989) and Sjaastad (1989). Earlier versions can be found in Corden (1977), Buiter (1981), Obstfeld (1981) and Frenkel and Razin (1987a). [54]
If, because of some miscalculation or altered circumstances, the projects are unprofitable, then the foreign debt is extinguished by the bankruptcy of the borrower. [55]
The following quote from Pitchford (1989c p. 13) expresses the essence of the argument. ‘Until a case is made that privately generated current account deficits and foreign debt produce costs of some kind commensurate with those of recession and inflation, there would seem no reason to justify intervening with macro policy, given its readily calculated costs to affect their outcomes.’ [56]
Tease (1988) and Smith and Gruen (1989). [57]
This discussion has ignored the possible effects of short-term exchange rate volatility on trade and investment. Day-by-day volatility should not be a great cause for disruption to markets or policy-concern, because traders can hedge cheaply. But just for completeness we note that volatility appears to have increased, as one would expect, since the float. Trevor and Donald (1986). [58]
This conclusion must be qualified because public consumption expenditure may be welfare enhancing. [59]
Following others in the literature the instruments chosen for domestic saving are the ratio of defence expenditure to GDP and the ratio of dependents (those 15 years or younger or 65 years or older) to the working age population. [60]
References
Alesina, A., Gruen, D. and Jones, M. (1990), ‘Fiscal Adjustment, the Real Exchange Rate and Australia's External Imbalance’, ANU Centre for Economic Policy Research Discussion Paper 233.
Argy, V. (1987), ‘International Financial Liberalisation – The Australian and Japanese Experiences Compared’, Bank of Japan Monetary and Economy Studies, 5, pp. 105–165.
Arndt, H.W. (1989), ‘Australia's Current Account and Debt Problems: A Sceptical View of the Pitchford Thesis’, ANU Centre for Economic Policy Research Discussion Paper 219.
Australian Financial System Inquiry (1982), Final Report of the Committee of Inquiry, AGPS, Canberra.
Barro, R.J. (1989), Modern Business Cycle Theory, Harvard University Press, Cambridge, Massachusetts.
Blundell-Wignall, A. and Thomas, M. (1987), ‘Deviations from Purchasing Power Parity: The Australian Case’, Reserve Bank of Australia Research Discussion Paper 8711.
Blundell-Wignall, A. and Gregory, R.G. (1989), ‘Exchange Rate Policy in Advanced Commodity Exporting Countries. The Case of Australia and New Zealand’, Paper prepared for the International Conference on ‘Exchange Rate Policy in Selected Countries’, sponsored by the IMF, 12–14 October 1989.
Buiter, Willem, H. (1981), ‘Time Preference and International Lending in an Overlapping Generations Model’, Journal of Political Economy, 89, pp. 769–797.
Bullock, M., Morris, D. and Stevens, G. (1989), ‘The Relationship Between Financial Indicators and Economic Activity: 1968–1987’, in Macfarlane, I.J. and Stevens, G. (eds), Studies in Money and Credit, Reserve Bank of Australia.
Bureau of Industry Economics (1986), ‘Devaluation and Australian Industry’, Conference Papers and Proceedings, Sydney, October.
Bureau of Industry Economics (1987), ‘Depreciation of the Australian Dollar: How Do Mature Industries Fare?’, Research Report 24, AGPS, Canberra.
Bureau of Industry Economics (1988), ‘The Impact of the Depreciation of the Australian Dollar on Capital Good Producers’, Information Bulletin 13, AGPS, Canberra.
Bureau of Industry Economics (1989), ‘Manufacturing Investment’, Research Report 33, AGPS, Canberra.
Carmichael, J. (1990), ‘Inflation in Australia: Performance and Policy’, this volume.
Carmichael, J. and Dews, N. (1987), ‘The Role and Consequences of Investment in Recent Australian Economic Growth’, Reserve Bank of Australia Research Discussion Paper 8704.
Carmichael, J. and Stebbing, P. (1983), ‘Fisher's Paradox and the Theory of Interest’, American Economic Review, 83, pp. 619–630.
Chapman, B. (1990), ‘The Labour Market’, this volume.
Chapman, B. and Gruen, F. (1990), ‘An Analysis of the Australian Consensual Incomes Policy: The Prices and Incomes Accord’, ANU Centre for Economic Policy Research, Discussion Paper 221.
Coppel, J.G., Simes, R.M. and Horn, P. (1988), ‘The Current Account in the NIF88 Model’, Paper prepared for the Conference on The Australian Macroeconomy and the NIF88 Model, ANU Centre for Economic Policy Research, March.
Corden, W.M. (1968), Australian Economic Policy Discussion: A Survey, Melbourne University Press, Melbourne.
Corden, W.M. (1977), Inflation, Exchange Rates and the World Economy, Clarendon Press, Oxford.
Corden, W.M. (1979), ‘A Summary’, in Norton, W. (ed.), Conference in Applied Economic Research, Reserve Bank of Australia.
Corden, W.M. (1986), ‘Exchange Rate Depreciation, the Current Account and Wages’, Economic Record, Supplement, pp. 14–21.
Corden, W.M. (1989), ‘Australian Macroeconomic Policy Experience’, Economic Record, 65, pp. 152–165.
Cumby, R.E. and Obstfeld, M. (1984), ‘International Interest Rate and Price Level Linkages under Flexible Exchange Rates: A Review of Recent Evidence’ in Bilson, J.F.O. and Marston R.C., (eds.), Exchange Rate Theory and Practice, University of Chicago Press, London.
Dean, A., Durand, M., Fallon, J. and Hoeller, P. (1989), ‘Savings Trends and Behaviour in OECD Countries’, OECD Working Papers No. 67.
Department of Treasury (1989), Budget Statements 1989–90.
Derrick, S. McDonald, D. and Rosendale, P. (1981), ‘The Development of Energy Resources in Australia: 1981 to 1990’, Australian Economic Review, 3rd Quarter, pp. 13–56.
Dixon, P.B. and MacDonald, D. (1986), ‘Australia's Foreign Debt: 1975 to 1985’, Australian Economic Review, 2nd Quarter, pp. 22–37.
Dooley, M., Frankel, J. and Mathieson, J. (1987), ‘International Capital Mobility: What Do Saving-Investment Correlations Tell Us?’, IMF Staff Papers, 34, pp. 503–530.
Dornbusch, R. (1980), Open Economy Macroeconomics, Basic Books, New York.
Dornbusch, R. (1983), ‘Real Interest Rates, Home Goods and Optimal External Borrowing’, Journal of Political Economy, 91, pp. 141–153.
Dornbusch, R. (1989), ‘The Adjustment Mechanism: Theory and Problems’, in Fieleke, N.S. (ed.), International Payments Imbalances in the 1980s, Federal Reserve Bank of Boston Series No. 32.
Dornbusch, R. and Fischer, S. (1984), ‘The Australian Macroeconomy’, In Caves, R.E. and Krause, L.B. (eds..), The Australian Economy: A View from the North, Allen and Unwin, Sydney.
Edey, M. and Britten-Jones, M. (1990), ‘Saving and Investment’, this volume.
EPAC (1985), ‘Australia's Foreign and Public Sector Debt’, Council Paper No. 6, October.
EPAC (1986), ‘External Balance and Economic Growth’, Council Paper No. 22.
EPAC (1988), ‘Australia's Medium Term Growth Potential’, Council Paper No. 30.
EPAC (1989a), ‘External Debt, Trends and Issues’, EPAC Discussion Paper 89/06.
EPAC (1989b), ‘Model-Based Evidence on Australia's External Debt’, EPAC Discussion Paper No. 89/09.
EPAC (1990), Background Papers on External Debt, AGPS, Canberra.
Fahrer, J. (1990), ‘Is Pitchford Right? Current Account Adjustment, Exchange Rate Dynamics and Macroeconomic Policy’, Reserve Bank of Australia Research Discussion Paper 9001.
Feldstein, M. (1983), ‘Domestic Saving and International Capital Movements in the Long-Run and the Short-Run’, European Economic Review, 21, pp. 129–151.
Feldstein, M. and Horioka, C. (1980), ‘Domestic Saving and International Capital Flows’, Economic Journal, 90, pp. 314–329.
Feldstein, M. and Bacchetta, P. (1989), ‘National Saving and International Investment’, NBER Working Paper No. 3164.
FitzGerald, V. and Urban, P. (1989), ‘Causes and Consequences of Changes in the Terms of Trade and the Balance of Payments’, in Chapman, B. (ed.), Australian Economic Growth, MacMillan, Sydney.
Forsyth, P.J. (1990), ‘Competitiveness, Microeconomic Reform and the Current Account Deficit’, ANU Centre for Economic Policy Research Discussion Paper No. 228.
Frankel, J.A. (1985), ‘International Capital Mobility and Crowding Out in the U.S. Economy: Imperfect Integration of Financial Markets or of Goods Markets?’, National Bureau of Economic Research Working Paper No. 1773.
Frankel, J.A. (1989), ‘Quantifying International Capital Mobility in the 1980s’, National Bureau of Economic Research Working Paper No. 2856.
Frankel, J.A. and Froot, K. (1987), ‘Using Survey Based Data to Test Standard Propositions Regarding Exchange Rate Expectations’, American Economic Review, March, pp. 133–153.
Frankel, J.A. and Meese, R.A. (1987), ‘Are Exchange Rates Excessively Volatile’, NBER Macroeconomics Annual, 1987.
Frankel, J. and MacArthur, A.T. (1988), ‘Political vs Currency Premia in International Real Interest Differentials’, European Economic Review, 32, pp. 1083–1121.
Freebairn, J. (1989), ‘Some Results from the ORANI-F Model’, Paper prepared for a Conference on Fiscal Policy and the Current Account, 5–6 June 1989. Held by Centre for Economic Policy Research, ANU and the Department of Treasury.
Frenkel, J.A. and Razin, A. (1987a), Fiscal Policies and the World Economy, MIT Press, Cambridge, Massachusetts.
Frenkel, J.A. and Razin, A. (1987b), ‘The Mundell-Fleming Model: A Quarter Century Later’, IMF Staff Papers, 34, pp. 567–620.
Frenkel, J.A., Goldstein, M. and Masson, P.R. (1989), ‘International Dimensions of Monetary Policy: Co-ordination Versus Autonomy’, Paper prepared for a Symposium sponsored by the Federal Reserve Bank of Kansas City on ‘Monetary Policy Issues in the 1990s’, Jackson Hole, Wyoming.
Genberg, H. (1988), ‘The Fiscal Deficit and the Current Account: Twins or Distant Relatives?’, Reserve Bank of Australia Research Discussion Paper 8813.
Gordon, J.M. (1986), ‘The J-Curve Effects’, Economic Record, 64, Supplement, pp. 82–88.
Gregory, R.G. (1989), ‘The Current Account and Australian Economic Policy under the Labour Government’, Paper prepared for 18th Trade and Development Conference, Kuala Lumpur. 11–14 December 1989.
Gruen, F.H. (1986), ‘How Bad is Australia's Economic Performance and Why?’, Economic Record, 62, pp. 180–193.
Hansen, L.P. and Hodrick, R.J. (1980), ‘Forward Exchange Rates as Optimal Predictors of Future Spot Rates’, Journal of Political Economy, 88, pp. 829–853.
Harper, I.R. and Lim, G.C. (1989), ‘Is Monetary Policy Too Tight?’, Australian Economic Review, 2nd Quarter, pp. 15–24.
Hawkins, R.G. (1979), ‘Business Fixed Investment in the 1970s’, in Norton, W. (ed.) Conference in Applied Economic Research, Reserve Bank of Australia Sydney.
Horton, T. and Wilkinson, J. (1989), ‘An Analysis of the Determinants of Imports’, Reserve Bank of Australia Research Discussion Paper 8910.
Hughes, B. (1989), ‘Twin Deficits in the IMP Model’, paper prepared for a Conference on Fiscal Policy and the Current Account, 1989. Held by Centre for Economic Policy Research, ANU and the Department of Treasury.
Kearney, C. and Fallick, L. (1987), ‘Macroeconomic Policy and the Balance of Payments in Australia’, Economic Analysis and Policy, 17, pp. 131–149.
Kotlikoff, L. (1989), What Determines Savings?, MIT Press, Cambridge, Massachusetts.
Kouparitsas, M., Pearce, J. and Simes, R. (1989), ‘The Net PSBR and the Current Account Deficit’, Paper prepared for a conference on Fiscal Policy and the Current Account, 1989. Held by Centre for Economic Policy Research, ANU and the Department of Treasury.
Lattimore, R. (1989), ‘Pass-through of Exchange Rate Changes and Competitiveness’, paper presented to the 1989 Conference of Economists, University of Adelaide, 9–13 July.
Laker, J.F. (1988), ‘Exchange Rate Policy in Australia’, Paper presented to the 17th SEANZA Central Banking Course.
Levich, R.M. (1985), ‘Empirical Studies of Exchange Rates: Price Behaviour, Rate Determination and Market Efficiency’, in Jones, R.W. and Kenen, P.B. (eds), Handbook of International Economics, vol. II, Cambridge, Massachusetts, pp. 979–1040.
Macfarlane, I.J. (1979), ‘The Balance of Payments in the 1970s’ in Norton, W. (ed.), Conference in Applied Economic Research, Reserve Bank of Australia, Sydney.
Macfarlane, I.J. (1989), ‘Money, Credit and the Demand for Debt’, Reserve Bank of Australia Bulletin, May 21–31.
Macfarlane, I.J. and Tease, W.J. (1989), ‘Capital Flows and Exchange Rate Determination’, Reserve Bank of Australia Research Discussion Paper 8908.
Makin, A.J. (1987), ‘Australia's External Imbalance’, Conference of Economists, 23–27 August.
Makin, A.J. (1989), ‘Is the Current Account Deficit Substainable?’, Australian Economic Review, 2nd Quarter, pp. 29–33.
McKibbin, W. and Siegloff, E. (1988), ‘A Note on Aggregate Investment in Australia’, Economic Record, 64, 186, 209–215.
McKibbin, W. and Elliott, G. (1989), ‘Fiscal Policy in the MSG2 Model of the Australian Economy’. Paper prepared for a conference on Fiscal Policy and the Current Account, 5–6 June 1989. Held by Centre for Economic Policy Research, ANU and the Department of Treasury.
McKibbin, W. and Morling, S. (1989), ‘Macroeconomic Policy in Australia: A Longer Run Perspective’. Paper prepared for the conference on ‘Australian Economic Policy’, 27–28 November 1989, sponsored by the Centre for Economic Policy Research, ANU.
McTaggart, D. and Rogers, C., (1989), ‘Monetary Base Control in Australia’, Paper prepared for Melbourne Money and Finance Conference, November 25–26.
Milbourne, R. (1990), ‘Money and Finance in Australia: A Decade of Change’, Paper presented at the Reserve Bank Conference on The Australian Macroeconomy in the 1980s, Sydney 20–21 June.
Mundell, R.A. (1968), International Economics, MacMillan, New York.
Murphy, C.W. (1989), ‘The Budget Strategy and Foreign Debt’, Australian Economic Review, 4th Quarter, pp. 32–51.
Nakao, M. (1989), ‘External Balance Adjustment and Monetary Policy Management Under International Private Capital Flows’. Paper presented to Bank for International Settlements Meeting of Central Bank Economists, 15–16 November.
Nevile, J.W. (1989), ‘Structural Deficits and Fiscal Policy Stance in Australia: 1966–67 to 1988–89’, Centre for Applied Economic Research, No. M-7.
Nguyen, D.T. (1990), ‘Fiscal Policy and the Current Account’, in Office of EPAC, Background Papers on External Debt, AGPS, Canberra.
Obstfeld, M. (1980), ‘Intermediate Imports, the Terms of Trade and the Dynamics of the Exchange Rate and the Current Account’, Journal of International Economics, 10, pp. 461–480.
Obstfeld, M. (1981), ‘Macroeconomic Policy. Exchange Rate Dynamics and Optimal Asset Accumulation’, Journal of Political Economy, 89, pp. 1142–1161.
Obstfeld, M. (1982), ‘Aggregate Spending and the Terms of Trade: Is There a Laursen-Metzler Effect’, Quarterly Journal of Economics, pp. 251–270.
Obstfeld, M. (1986), ‘Capital Mobility in the World Economy Theory and Measurement’, Carnegie-Rochester Conference Series on Public Policy, 24, pp. 55–104.
OECD (1988), Why Economic Policies Change Course, OECD, Paris.
OECD (1989), Economic Outlook, December.
Ostry, J.D. (1988), ‘The Balance of Trade, Terms of Trade and the Real Exchange Rate’, IMF Staff Papers, pp. 341–573.
Parsell, B.F., Powell, A.A. and Wilcoxen, P.J. (1989), ‘The Effects of Fiscal Restraint on the Australian Economy as Projected by the Murphy and MSG2 Models: A Comparison’, Paper prepared for a Conference on Fiscal Policy and the Current Accounts, 5–6 June 1989. Held by Centre for Economic Policy Research, ANU and Department of Treasury.
Penati, A. and Dooley, M. (1984), ‘Current Account Imbalances and Capital Formation in Industrial Countries, 1949–81’, IMF Staff Papers, pp. 1–24.
Persson, T. and Svenson, L.E.O. (1985), ‘Current Account Dynamics and the Terms of Trade: Harberger-Laursen-Metzler Two Generations Later’, Journal of Political Economy, 93, pp. 43–65.
Phillips, R.W. (1988), ‘The Pass-through of Exchange Rate Changes to Prices of Imported Manufactures’, ANU Centre for Economic Policy Research Discussion Paper no. 197.
Phillips, R.W. (1989), ‘Import Demand Patterns and Relative Prices During the 1980s’, ANU Centre for Economic Policy Research Discussion Paper No. 218.
Pitchford, J.D. (1989a), ‘Does Australia Really Have a Current Account Problem?’, Economic Papers, 8, pp. 25–32.
Pitchford, J.D. (1989b), ‘Optimum Borrowings and the Current Account when there are Fluctuations in Income’, Journal of International Economics.
Pitchford, J.D. (1989c), ‘A Sceptical View of Australia's Current Account Problem’, Australian Economic Review, 2nd Quarter, pp. 5–13.
Porter, M.G. (1982), ‘Comments on Exchange Rate/Exchange Control Policy’, in Australian Financial System Inquiry, Commissioned Studies and Selected Papers Part 2, Macroeconomic Policy: External Policy, AGPS, Canberra, pp. 340–347.
Reserve Bank of Australia (1989), Report and Financial Statements.
Robertson, R. (1990), ‘Australian Equity Investment Abroad’, Reserve Bank of Australia Bulletin, March, 20–25.
Sachs, J.D. (1980), ‘Wages, Flexible Exchange Rates and Macroeconomic Policy’, Quarterly Journal of Economics, 94, pp. 731–747.
Sachs, J.D. (1981a), ‘The Current Account and Macroeconomic Adjustment in the 1970s’, Brookings Papers on Economic Activity, 1, pp. 201–282.
Sachs, J.D. (1981b), ‘Aspects of the Current Account Behaviour of OECD Economies’, in Classen, E. and Salin, P. (eds.), Recent Issues in the Theory of Flexible Exchange Rates.
Sachs, J.D. and Wyplosz, C. (1984), ‘Real Exchange Rate Effects of Fiscal Policy’, National Bureau of Economic Research Working Paper No. 1255.
Salop, J. and Spitaller, E. (1980), ‘Why Does the Current Account Matter?’, IMF Staff Papers, pp. 101–134.
Salter, W. (1959), ‘Internal and External Balance: the role of Expenditure and Prices Effects’, Economic Record, 35, pp. 226–238.
Shafer, J.R. and Loopesko, B.E. (1983), ‘Floating Exchange Rates After Ten Years’, Brookings Papers on Economic Activity, 1, pp. 1–70.
Sieper, E. and Fane, G. (1982), ‘Exchange Control and Exchange Rate Policy’, in Australian Financial System Inquiry, Commissioned Studies and Selected Papers, Part 2, Macroeconomic Policy: External Policy, AGPS, Canberra.
Sieper, E. and Wells. G.M. (1989), ‘Macroeconomic Policy on the Left: Australia and New Zealand in the Eighties’, Conference on ‘Australian Economic Policy’, Centre for Economic Policy Research, Canberra, 27–28 November.
Simes, R.M. and Richardson, C.J. (1987), ‘Wage Determination in Australia’, Economic Record, 63, pp. 144–155.
Sjaastad, L.A. (1989), ‘The Deficit: A Crisis of Minor Proportions’, University of Western Australia, Mimeo.
Smith, J. and Gruen, D.W.R. (1989), ‘A Random Walk Around the $A: Expectations, Risk, Interest Rates and Consequences for our Imbalance’, Reserve Bank of Australia Research Discussion Paper 8906.
Stegman, T.R. (1982), ‘Estimation of an Accelerator-type Investment Function with a Profitability Constraint, by the Technique of Switching Regressions’, Australian Economic Papers, 12, pp. 379–391.
Stevens, G. and Thorp, S. (1989) ‘The Relationship between Financial Indicators and Economic Activity: some Further Evidence’, in Macfarlane, I.J. and Stevens, G. (eds.), Studies in Money and Credit, Reserve Bank of Australia, Sydney.
Stone, J.O. (1979), ‘Australia in a Competitive World: Some Options’, Paper presented to the 21st General Management Conference of the Australian Institute of Management, 19 November.
Svensson, L.E.O. and Razin, A. (1983), ‘The Terms of Trade and the Current Account: The Harberger-Laurzen-Metzler Effect’, Journal of Political Economy, 9, pp. 97–125.
Swan, T. (1960), ‘Economic Control in a Dependant Economy’ Economic Record, 36, pp. 51–66.
Swan, T. (1963), ‘Longer-run Problems of the Balance of Payments’, in Arndt, H.W. and Corden, W.M.(eds.), The Australian Economy, Cheshire, Sydney, pp. 384–395.
Tease, W.J. (1988), ‘Speculative Efficiency and the Exchange Rate: Some Evidence Since the Float’, Economic Record, 64, pp. 2–13.
Trevor, R.G, and Donald, S.G. (1986), ‘Exchange Rate Regimes and the Volatility of Financial Prices: The Australian Case’, Economic Record, Supplement, pp. 58–68.
Turner, P.P. (1986), ‘Saving, Investment and the Current Account: An Empirical Study of Seven Major Countries 1965–1984’, Bank of Japan Monetary and Economic Studies, 4, pp. 1–58.
Turnovsky, S.J. and Ball, K.M. (1983), ‘Covered Interest Parity and Speculative Efficiency: Some Empirical Evidence for Australia’, Economic Record, 59, pp. 271–280.
Vernon, J. (1965) ‘Report of the Committee of Economic Enquiry’, Commonwealth of Australia, 1, May.