Bulletin – June 2022 Payments Recent Trends in Banknote Counterfeiting
- Download 1.5MB
Abstract
Counterfeiting of Australian banknotes is approaching its lowest level in a decade. Several factors are playing a role in this decline, including fewer transactions being made with cash, COVID-19-induced lockdowns, the rollout of a new banknote series with upgraded security features, and law enforcement continuing to interrupt counterfeiting operations. This article quantifies the effect of some of these factors, while exploring the broader trends in banknote counterfeiting.
Introduction
Cash continues to play an important role in the economy as a medium of exchange and a store of value. For cash to function effectively, however, it is important to maintain public confidence in the security of our banknotes. As Australia's banknote issuing authority, the Reserve Bank aims to prevent and suppress counterfeiting. Counterfeiting currency is a crime and is considered fraud – this is because counterfeits are worthless and victims cannot be reimbursed for their loss. Counterfeiting is prosecuted under the Crimes (Currency) Act 1981, with penalties including fines of up to $166,500 and/or up to 14 years in prison.
The Bank assists in preventing counterfeiting by designing, producing and circulating banknotes that have advanced security features, which make counterfeits difficult to pass in the economy; it seeks to raise awareness of these features through various information channels, including via its website and social media.[1] In addition, the Bank works with the Australian Federal Police (AFP) to suppress counterfeiting, by examining and monitoring counterfeits seized and detected in Australia, and assisting police and prosecutors with information and expert evidence.
This article discusses recent counterfeiting trends in Australia, focusing on three areas that have been prominent since the previous update (Ball 2019):
- the short-term effect of lockdown restrictions on counterfeiting activity
- the long-term impact of the Next Generation Banknote (NGB) series upgrade that was completed in 2020
- an increase in counterfeits passed in person-to-person transactions.
Trends in counterfeiting
Counterfeiting in Australia has been steadily declining since its peak in 2015. The Bank received around 17,000 counterfeits in 2021 with a total value of just over $1,300,000. This is small relative to the total number of banknotes in circulation (at around 2 billion notes, worth $102 billion). The counterfeiting rate, which is expressed as the number of counterfeits per million genuine banknotes in circulation (parts per million, or ppm), is currently 9 ppm – much lower than the 2015 rate of 27 ppm (Graph 1). Between 2015 and 2019, most of the decline in counterfeiting can be attributed to law enforcement shutting down several large counterfeiting operations (Ball 2019).

Over the last two years there have been a number of new factors working to reduce counterfeiting even further. Notably, the Bank recently completed the rollout of the NGB series with upgraded security features; this replaced the New Note Series (NNS), which was introduced in the 1990s (Hickie, Miegel and Tsikrikas 2021). At the same time, the COVID-19 pandemic has played a role in disrupting counterfeiting, with lockdown restrictions reducing opportunities to pass counterfeit banknotes, at least temporarily.
Geographical trends
Counterfeiting in Australia tends to be concentrated in the urban areas of Victoria and New South Wales, with these two states accounting for around 75 per cent of all counterfeit detections (Graph 2). Counterfeits are generally easier to pass in areas with busy retail settings where use of high-denomination banknotes ($50 and $100) is more common. The main driver of geographical trends is simply where high-volume counterfeiters choose to distribute their counterfeits. For instance, around 50 per cent of all counterfeit detections over the last two years occurred in Victoria, and this was mainly due to one large-scale counterfeiting operation. On the other hand, counterfeiting in New South Wales has declined, as several counterfeiters from that state have ceased to operate as a result of police actions.

Over the past two years, the COVID-19 pandemic has affected state-based trends in counterfeit detections. The states and territories that experienced longer and more stringent lockdown restrictions – in particular, Victoria and New South Wales – had notable reductions in counterfeit detections.
Lockdowns and counterfeiting
Since 2020, counterfeiting activity in Australia has been inversely related to the stringency of lockdown restrictions – the tighter the lockdowns, the fewer counterfeits passed (Graph 3). During lockdowns, households were only allowed to leave home for a limited number of reasons and most in-person retail and household services were closed. This led to a sharp decline in household consumption (Bishop, Boulter and Rosewall 2022). As a result, the number of counterfeits detected from retail shops fell, as there were fewer opportunities to pass counterfeit banknotes. Retailers that were less affected by lockdown restrictions because they were deemed essential during the pandemic (e.g. food retailers) reported higher counterfeit detections than non-essential retailers (e.g. department stores).

The recent decline in counterfeiting cannot be solely attributed to COVID-19 lockdowns as a number of other factors were at play, including:
- Fewer transactions were made with cash over this time, meaning less counterfeits should be detected. This is an existing trend that was accelerated over the pandemic, as many vendors and consumers preferred electronic payments for hygiene reasons (Guttmann et al 2021).
- Actions by law enforcement continued to disrupt a number of counterfeit operations. Historically, this has been a major driver in reducing the production and distribution of counterfeits.
- A greater proportion of NGB banknotes in circulation has made it more difficult to pass counterfeits of the old banknote series.
To better understand the effect of lockdowns on counterfeiting, we analysed differences in counterfeiting between states, on the basis that some parts of the country experienced longer and more stringent lockdown restrictions than others. The results from the analysis suggest that lockdowns reduced counterfeit detections by around 7 per cent on average, which is about 100 counterfeits detected per month (see Appendix A). However, with lockdown restrictions easing throughout the country in late 2021, early data suggest counterfeiting has picked up somewhat.
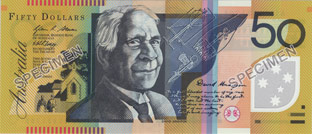
Denominations
In 2020, the $100 banknote surpassed the $50 banknote as the most counterfeited denomination (Graph 4). While the $50 banknote has been the most targeted denomination for the past decade, the number of $50 counterfeits detected has been declining, and is now at levels last observed in 2009. Currently, there is one suspected counterfeiter specialising in forging the NNS $100 banknote, which appears to be driving this shift. However, there are a number of other contributing factors, including the introduction of the NGB series. While upgraded $100 banknotes make up only 10 per cent of all $100 banknotes in circulation, the number of upgraded $50 banknotes and older NNS $50 banknotes in circulation are now almost equal. Consequently, counterfeiters may have found it harder to pass older NNS $50 counterfeits. Counterfeiting of the smaller denominations remains at low levels, consistent with what has been seen historically.

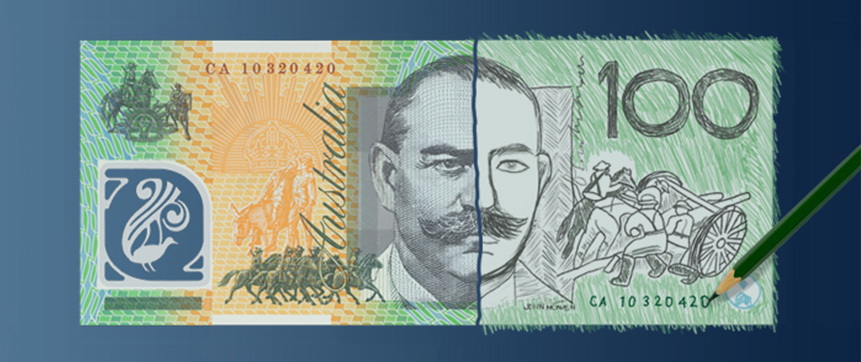
Quality and substrate
The quality of a counterfeit banknote plays a key role in that counterfeit being passed as genuine in the economy. The quality represents how closely a counterfeit resembles a genuine banknote, including which security features have been counterfeited and how well they were copied. In recent times, the quality of counterfeits has fallen and is now at its lowest level in a decade (Graph 5). The risk of accepting a counterfeit has therefore decreased, as low-quality counterfeits are more easily identified. Effective police operations from 2015 to 2018 interrupted counterfeiters producing higher quality counterfeits, resulting in both lower numbers of counterfeits and a reduction in average counterfeit quality.

All genuine Australian banknotes have been printed on plastic (polymer) substrate since 1996. There were relatively low levels of counterfeiting until about 2010 when counterfeit detections began to rise steadily. After some 25 years since their introduction, it is now easier for counterfeiters to produce high-quality counterfeits and the NNS series of polymer banknotes has become more susceptible to counterfeit attacks. By 2015, polymer had become the predominant substrate used in counterfeiting, and counterfeiting operations using polymer were typically producing a relatively high volume of counterfeits that were of reasonably high quality. While this trend of counterfeiters using polymer has continued in recent times, the declining cost of printing technology has meant that even lower quality counterfeits are now being produced on polymer. Currently, around 60 per cent of counterfeits are printed on polymer, compared to just over 20 per cent a decade ago.
Despite the rise in polymer counterfeits, to date there have been very few counterfeits of the NGB series, with only about 50 counterfeits detected. The NGB program incorporated new and upgraded security features, with the goal of ensuring these banknotes were more difficult to counterfeit. All NGB counterfeits detected have been of low quality.
The effect of the NGB upgrade on banknote counterfeiting
The decline in counterfeiting in recent years correlates closely with the staggered release of the NGB series, which has innovative security features that are harder to counterfeit (see Box A). Counterfeit detections for the denominations most commonly used in ATMs – the $20 and $50 banknotes – declined after the upgraded versions were issued, although they were already declining before the upgrade (Graph 6). Detections for the $5 and $10 banknotes also declined after their upgrade, albeit from low bases.

One possible explanation for this could be that as the share of NGBs in circulation – also known as the NGB saturation rate – rises, it becomes more difficult to pass counterfeits of the old banknote series (as they are rarer and attract more scrutiny). To explore this potential relationship, we conducted correlation analysis, focusing on the $20, $50 and $100 banknotes, as the higher denominations are targeted by counterfeiters in Australia. A basic scatter plot reveals that as NGBs in circulation have become more common relative to the old series, counterfeit detections have been lower than before the upgraded version was issued (Graph 7).

While these results suggest that counterfeiting is negatively correlated with the new banknote upgrade, there may be other factors driving the decline in counterfeiting over time, including: law enforcement shutting down several counterfeiting operations; fewer banknotes being used for transactions, meaning less counterfeits should be detected; and recent COVID-19 lockdowns reducing opportunities to pass counterfeit banknotes. To disentangle the effects of these factors and isolate the effect of the banknote upgrade, we used regression analysis (see Appendix B).
The regression results support the theory that the NGB banknote upgrade has led to lower levels of counterfeiting. After controlling for other factors, a 10 percentage point increase in the NGB saturation rate for higher denominations ($50 and $100) reduces the average number of counterfeits detected each month by 70 (around 5 per cent of recent monthly detections), whereas a similar increase for the lower denominations does not have an effect.
Overall, the results indicate that the NGB program met its intention of reducing counterfeiting. While the reduction may not seem large, at higher saturation rates the reduction can be sizeable. The results also suggest that as the NGB series becomes more prevalent in the economy, counterfeiting rates could decline further. However, as counterfeiters become more familiar with the enhanced sophisticated security features and technology continues to evolve, this trend may reverse. Lower cash use may also reduce the public's familiarity with banknote security features, making it easier to pass counterfeits.
International comparison
Counterfeiting rates internationally declined over 2020, and Australia's counterfeiting rate remained low relative to other major currencies. Echoing a similar experience to Australia, declines in counterfeiting internationally appear to be associated with the stringency of COVID-19 lockdowns. In 2020, countries with a higher number of days in strict lockdown, such as Canada and the United Kingdom, experienced larger decreases in their counterfeiting rates than unrestricted countries, like Denmark and Switzerland – where counterfeiting rates increased (Graph 8).

Nevertheless, counterfeiting rates across countries are affected by a number of factors, including the broader crime rate, the age and security of the banknotes, the public's awareness of security features, the quality of banknotes in circulation, the cost of equipment used to counterfeit banknotes, and how widely the currency is used (international versus local). International comparisons of counterfeiting rates are also imperfect, as monitoring and reporting practices vary from country to country.
Role of law enforcement
Law enforcement plays an important role in managing the threat of counterfeiting. The AFP, state police and the Commonwealth Director of Public Prosecutions investigate and prosecute counterfeit operators. The Bank provides expert witness statements and information around counterfeit activity, as well as classifying, monitoring and referring counterfeit groups to the AFP (Miegel and Symeonakis 2020). Police operations have successfully shut down many counterfeit operations. As noted above, the significant decline in counterfeiting from 2015 largely reflected several high-quality, high-volume counterfeit operations being shut down by law enforcement.
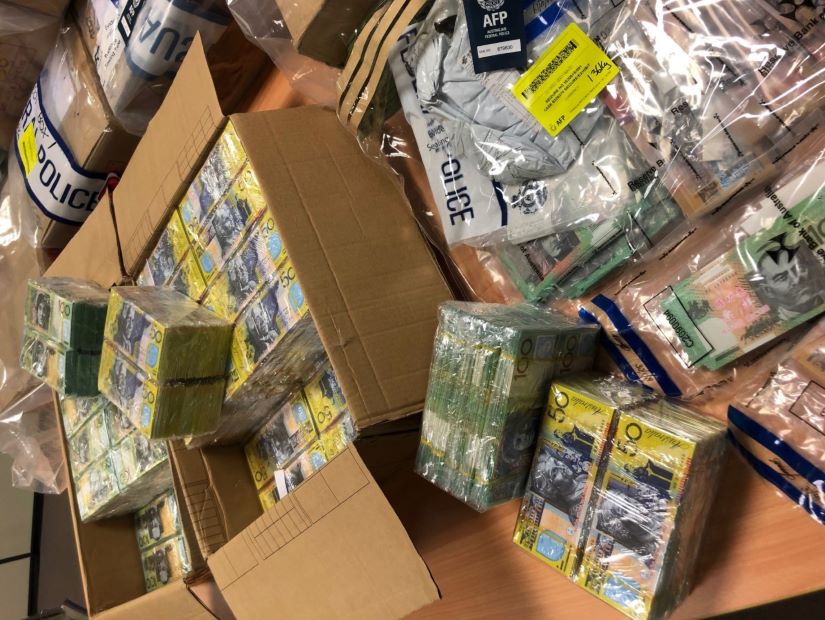
Source: Image courtesy of the Australian Federal Police
Law enforcement can also seize counterfeits before they enter circulation. These seizures do not form part of the counterfeit statistics, as they have not been used in general circulation. While there were some sizeable seizures in 2014 and 2015, the largest seizure of Australian banknotes occurred in 2018 and 2019, when a combined 550,000 counterfeit banknotes were intercepted at the Australian border (Graph 9). These notes had a combined face value of just over $45 million. While these notes were of poor quality and therefore more difficult to pass, there have been ongoing instances of similar counterfeits being accepted and causing financial loss to members of the public. Overall, preventing such large quantities of counterfeit banknotes entering circulation highlights the importance of effective law enforcement on counterfeiting rates.

Person-to-person counterfeiting
Despite the overall downward trend in counterfeiting, there is an emerging trend in person-to-person passing of counterfeits. This method of passing counterfeits is facilitated through online marketplaces in which goods are bought, sold and swapped, rather than the more traditional route of passing counterfeits at retail outlets. The buyer of goods from online marketplaces uses counterfeit banknotes, typically to purchase high-value goods; mobile phones and bicycles are among the most commonly purchased items. Those paying with counterfeit banknotes typically prefer platforms that offer greater anonymity. Using counterfeit banknotes in this way makes up only 1.4 per cent of annual counterfeit detections. However, it is growing and generally involves a larger number of counterfeit banknotes per transaction than that used when passing counterfeits at retail outlets, thereby increasing the potential loss to a seller who accepts the counterfeit banknotes.
Moreover, this can be exacerbated by the fact that a large portion of the public do not check their banknotes for counterfeits. According to a regular survey commisioned by the Bank, over 50 per cent of respondents said they rarely or never check their banknotes (Graph 10). Part of the reason for this would appear to be that people have a high level of confidence that counterfeits will be removed from circulation, coupled with a low expectation of receiving a counterfeit. Both of these trends have been relatively constant over time, despite the changing counterfeiting landscape (Nguyen and Francis 2019). Nonetheless, as the popularity of online marketplaces grows, this serves as a timely reminder to be vigilant when accepting cash for high-value items.

Conclusion
Counterfeiting of Australian banknotes has steadily declined since 2015. The $100 banknote is currently the most counterfeited denomination and the vast majority of counterfeits are of low quality, even when printed on polymer. Several factors have played a role in the decline in counterfeiting. Law enforcement has continued to interrupt high-volume and high-quality counterfeiting operations. The introduction of the NGB series has made counterfeiting harder, and the larger number of NGBs in circulation has made it increasingly difficult to pass counterfeits of the older series. More recently, COVID-19-induced lockdowns played a temporary role in reducing counterfeiting by restricting opportunities to pass counterfeit banknotes. While counterfeiting is expected to remain at low levels, it is important to be vigilant. If you receive a suspicious banknote, check the security features and contact police if you believe that it may be a counterfeit (see Box A).
Box A: How to detect a counterfeit note
Australian banknotes are printed on polymer (a type of plastic) and they have a distinctive feel. Banknotes from the same series have similar security features, though their location and design can vary.
First polymer series: NNS
|
Second polymer series: NGB

|
||
|---|---|---|---|

|
Coat of Arms Hold the banknote up to the light to see the Australian Coat of Arms. |
|
Flying bird Tilt the banknote to see a bird move its wings and change colour in the top-to-bottom window. |

|
Federation Star Hold the banknote up to the light to see the diamond patterns form a seven-pointed star. |

|
Reversing number Tilt the banknote to see a number change direction within the building in the top-to-bottom window. |

|
Clear window Check that the clear window is part of the banknote and that the white ink cannot easily be rubbed off. |

|
Rolling colour effect Tilt the banknote to see a rolling colour effect. On one side of the banknote it is a prominent patch near the top corner. On the other side it is within a bird shape. |
| Shared features | |||
| Intaglio print | Feel the distinctive texture of the dark printing. The slightly raised print can be felt by running a finger across the portraits and numerals. | ||
| Microprint | Look for tiny, clearly defined text in multiple locations on the banknote. | ||
| Fluorescent ink | Look at the banknotes under a UV light to see features fluoresce. | ||
What should you do with a counterfeit note?
If you have received a banknote that you suspect may not be genuine, first check the security features (see above). If any security features are missing, take the following steps:
- Handle the suspect banknote as little as possible and store it in an envelope.
- Note any relevant information, such as how it came into your possession.
- Report the matter immediately to state or federal police.
More details about what to do if you come into possession of a counterfeit can be found on the Reserve Bank's website or the AFP website.[2]
You are within your rights to refuse to accept a banknote you suspect is counterfeit. Knowingly passing a counterfeit banknote is a crime.
Appendix A: Counterfeiting and lockdown model
We used a panel regression model with state-level monthly data from 2020–2022 to quantify the effect of lockdowns on counterfeiting. We used state fixed effects to control for time-invariant differences between the counterfeiting environment in each state; this includes differences in crime rates and state economic policies. We also included year fixed effects to capture the effect of federal law enforcement and saturation – two factors that vary over time but are constant between the states. Finally, we included banknote lodgements at cash depots – a proxy for retail cash use – which controlled for differing levels of cash transactions between the states. The model specification is:
Where:
- is the number of counterfeits detected for state i in month t
- is a dummy equal to 1 if state i was in lockdown for 10+ days in month t, and zero otherwise
- is the value of cash lodgements ($b) for state i in month t
- is a state fixed effect, and are year fixed effects.
Table A1 shows the estimates of variables from the above specification. Notably, the coefficient estimate on the lockdown variable was statistically significant and negative. This indicates that a lockdown episode reduced monthly counterfeits detected. The results also highlight the positive relationship between counterfeiting and cash lodgements – our proxy for transactional cash use.
| Variables | Coefficient |
|---|---|
| Lockdown | −104*** (32.04) |
| Cash lodgements | 99*** (34.06) |
| Observations | 192 |
| State FE | Yes |
| Year FE | Yes |
|
(a) ***, ** and * represent statistical significance at the 1, 5 and 10 per cent level, respectively. Standard errors in parenthesis. Source: RBA |
|
The results are robust to a number of alternative specifications. First, the effect of (state-based) law enforcement on counterfeiting may differ between states, and vary over time. To account for this, we interacted state and year fixed effects. Second, we took the natural logarithm of lodgements to address the potential skewness in this variable, as the value of lodgements can differ largely between states. Third, instead of cash lodgements, we used retail sales to capture economic activity and less transactional cash use over the sample period.
Appendix B: Counterfeiting and NGB saturation model
We used a panel regression model with monthly denomination-level data from 2016 to estimate the effect of NGB saturation on counterfeiting. We used denomination fixed effects to control for time-invariant differences between counterfeiting operations for each denomination. We included yearly fixed effects to capture the effect of law enforcement and COVID-19 lockdowns – two factors that vary over time but are constant between denominations. We also included banknote lodgements at cash depots to control for differing levels of transactional cash activity. Overall, we exploited the variation within each denomination, within each year. The model specification is:
Where:
- is the number of counterfeits detected for denomination i in month t
- is the saturation rate (%) for denomination i in month t
- is the value of cash lodgements ($b) for denomination i in month t
- is a denomination fixed effect, and are year fixed effects.
Table B1 shows the estimates of variables from the above specification. Assuming the effect of saturation is equal across all denominations, a 10 percentage point increase in the saturation rate reduces average monthly counterfeit detections by around 20 (column 1). However, after accounting for the differing impact of saturation between denominations (by interacting saturation with a high-denomination dummy), we found the effect of saturation was driven by the high denominations (column 2). Namely, a 10 percentage point increase in the saturation rate for higher denominations reduced average monthly counterfeits detected by 70 (around 5 per cent of average monthly detections), whereas a similar increase for the lower denominations only reduced detections by around one per month (and is no longer statistically significant). In addition, the results reinforce the positive relationship between transactional cash use and counterfeiting, with the coefficient on cash lodgements having a similar magnitude to that in the above lockdown regression (Appendix A).
| Variables | (1) | (2) |
|---|---|---|
| Saturation | −1.96* (1.12) |
−0.11 (1.19) |
| Saturation x High Denom | – | −6.87*** (1.85) |
| Cash lodgements | 146*** (15.54) |
101*** (19.25) |
| Observations | 198 | 198 |
| Denomination FE | Yes | Yes |
| Year FE | Yes | Yes |
|
(a) ***, ** and * represent statistical significance at the 1, 5 and 10 per cent level, respectively. Standard errors in parenthesis. Source: RBA |
||
Endnotes
Leigh Mann is from Note Issue Department and Siddarth Roche completed this work in Note Issue Department.[*]
See RBA, ‘Counterfeit Detection’. Available at <https://banknotes.rba.gov.au/counterfeit-detection/>; RBA, ‘Social Media’. Available at <https://www.rba.gov.au/updates/social-media.html>. [1]
See RBA, ‘Suspect Banknotes’. Available at <https://banknotes.rba.gov.au/counterfeit-detection/suspect-banknotes/>; AFP, ‘Counterfeit Currency’. Available at <https://www.afp.gov.au/what-we-do/crime-types/counterfeit-currency>. [2]
References
Ball M (2019), ‘Recent Trends in Banknote Counterfeiting’, RBA Bulletin, March.
Bishop R, J Boulter and T Rosewall (2022), ‘Tracking Consumption during the COVID-19 Pandemic’, RBA Bulletin, March.
Guttmann R, C Pavlik, B Ung and G Wang (2021), ‘Cash Demand during COVID-19’, RBA Bulletin, March.
Hickie K, K Miegel and M Tsikrikas (2021), ‘Review of the NGB Upgrade Program’, RBA Bulletin, June.
Miegel K and K Symeonakis (2020), ‘A Counterfeit Story: Operation Gridline’, RBA Bulletin, December.
Nguyen K and A Francis (2019), ‘Confidence in Australian Banknotes’, RBA Research Discussion Paper No 2019-12.