Bulletin – March 2022 Australian Economy Tracking Consumption during the COVID-19 Pandemic
Abstract
The COVID-19 pandemic was an unprecedented shock to the economy that caused large and unexpected changes in household spending behaviour. Restrictions on household activity limited opportunities to consume services and people switched to purchasing more goods. The recovery in consumption was much stronger than expected earlier in the pandemic because households quickly adapted to the pandemic shock with the support of significant fiscal and monetary policy measures. This article examines household spending during the pandemic using a range of sources of information that have enabled the Reserve Bank of Australia to track consumption in a timely way.
Introduction
Changes in economic activity during the COVID-19 pandemic were the largest in close to a century. GDP declined by 7 per cent in the June quarter of 2020 following the onset of the pandemic at the start of that year, driven by a 12 per cent decline in household consumption (Graph 1). These were by far the largest changes in GDP and consumption since quarterly data were first published by the Australian Bureau of Statistics (ABS) in 1959.[1] Household consumption accounts for over half of Australia's GDP and restrictions on household activity introduced by health authorities to contain the virus significantly reduced consumption opportunities. Throughout the pandemic, the main effect of COVID-19 outbreaks on economic activity has been through household consumption.

Understanding the path of household consumption during economic shocks is of first order importance to policymakers. In addition to its large share of GDP, household consumption is directly related to a substantial share of jobs in the economy. Timely information about the extent of the fall in consumption in the first half of 2020 was critical for understanding the size of the shock to the overall economy and, in turn, calibrating the appropriate policy response. Likewise, a timely understanding of the recovery in consumption over the second half of the year gave policymakers important information about the path back to normalisation for a shock unprecedented in modern times.
Lockdowns and their effect on household consumption
There have been three periods of major restrictions on household activity and associated economic disruption in Australia during the pandemic. The onset of the pandemic saw strict restrictions on household mobility – commonly referred to as ‘lockdowns’ – introduced across the country in March 2020 (Graph 2). Measures of population mobility – which became critical economic indicators due to the nature of the economic disruption – declined sharply. Although the strict lockdown ended for most parts of the country by the middle of the June quarter, some restrictions on household activity remained in place for an extended period of time. Melbourne re-entered lockdown for much of the second half of 2020. The third major disruption started in mid-2021, as a sharp rise in the number of COVID-19 Delta-variant cases led to the reintroduction of lockdowns in New South Wales, Victoria and the Australian Capital Territory. Around half of the Australian population were under significant restrictions for most of the September quarter of 2021. Lockdown rules have differed by state and across time, but typically households were only allowed to leave home for a limited number of reasons and were required to work from home, if possible. Most in-person retail and household services were closed, along with schools and many other public services.

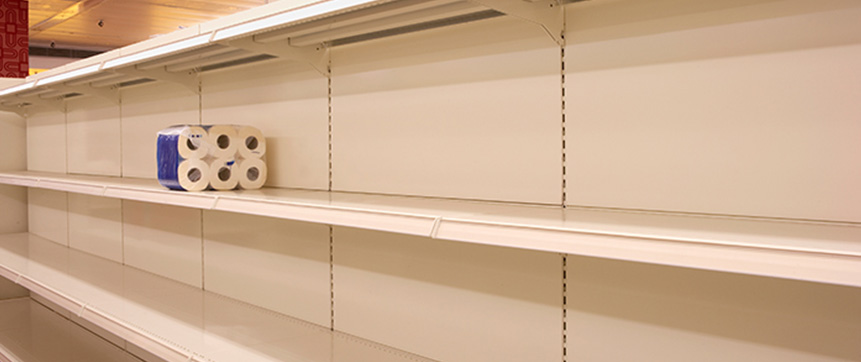
In addition to the large decline in aggregate consumption, spending patterns also shifted considerably at the onset of the pandemic as households adapted to restrictions on activity. Goods consumption increased strongly as consumers substituted away from services where consumption possibilities were limited or not available. Groceries to cook homemade meals replaced restaurant visits, sports equipment substituted for closed gyms, home office equipment filled in for trips to workplaces, and toys and games stood in for organised children's activities. Similar patterns have been observed in other advanced economies (Graph 3).

This increase in goods consumption, related to people spending more time at home, only partly offset the large falls in household services consumption from less time ‘out and about’ at hospitality venues and travelling (Graph 4, left panel). The strength in goods consumption was most pronounced for home entertainment items, appliances, furniture and home renovation goods, with retail sales for these categories in the June quarter of 2020 typically 20–30 per cent higher than a year earlier.[2] Spending on non-durable goods also increased; retail sales of at-home food and beverages in the June quarter 2020 were close to 15 per cent higher. By contrast, ‘out and about’ consumption declined sharply during lockdowns. Reduced spending on transport services, eating out, health services and gambling accounted for two-thirds of the total decline in consumption in the lockdowns that occurred in the June quarter of 2020 and the September quarter of 2021 (Graph 4, right panel). Store closures also drove sharp declines on clothing & footwear and department store spending.

Households also adapted to restrictions by making more of their purchases online. Online retail sales accounted for 10–15 per cent of the total value of retail sales during the second half of 2021, up from an average of around 6 per cent in 2019, though the shift was less pronounced than in other economies (Graph 5). Information from retailers in the Bank's liaison program suggests that they expect much of this shift to online purchases will remain long after health concerns have passed, and have invested heavily in their online platforms and distribution channels.[3]

Timely sources of information for monitoring household consumption
The most comprehensive source of information on household consumption is the ABS' national accounts. However, national accounts data are not available until two months after the end of each quarter. Economists at the Reserve Bank (and elsewhere) have used a wide range of timely information about household spending and activity to provide a real-time assessment of household consumption. While many of these indicators were only made available following the onset of the pandemic, and so their relationship with traditional economic indicators is still being explored, this information has been used in two main ways: first, to construct a granular real-time estimate of household spending (a ‘nowcast’); and second, to construct near-term forecasts of household consumption (‘near casts’).
The ‘consumption tracker’
Prior to the COVID-19 pandemic, partial indicators of household activity, such as retail sales and consumer sentiment, were the main inputs to estimate changes in household consumption in real time. Since the onset of the pandemic, Bank economists have relied more heavily on ‘bottom-up’ methods, where a wider range of partial information is used to track components of consumption at a more granular level. The Bank's ‘consumption tracker’ breaks down household consumption into more than 15 spending categories. Aggregating these monthly estimates gives an estimate of aggregate household consumption for the month or quarter (Graph 6). After the ABS national accounts are published, the estimates are updated to align the tracker estimates with the national accounts.

The consumption tracker draws on information from a range of sources to estimate changes in household consumption. High-frequency indicators include anonymised card transaction data, state government administrative data (including public transport use and gambling revenue), restaurant bookings, flight departures and mobility indicators. These are often available on a daily or weekly basis with very little lag.[4] These new data sources are complemented by established sources of timely information, such as monthly ABS retail sales data and motor vehicle sales, as well as information from the Bank's liaison program. Many partial indicators combine the effect of price and quantity changes, and so the contributions from each need to be estimated. The categories of consumption for which timely indicators are not available are largely estimated based on historic growth trends.[5]
The accuracy of the consumption tracker relative to the actual change in household consumption published in the national accounts has improved over time. The first quarterly growth estimate using the tracker is typically generated around the middle month of the quarter in question, when some forecasts are still required and outcomes in the final month might be subject to unexpected shocks. Nevertheless, the tracker has broadly predicted the change in consumption expenditure as measured by the national accounts a few months ahead of publication (Graph 7). Future tracker estimates will also incorporate information from the recently released ABS Monthly Household Spending Indicator, which draws on a broader range of card payments data (ABS 2022).

Key changes in household spending
The detailed tracking of household consumption with a wide range of sources has provided a timely read on household behaviour and activity in various parts of the economy. A closer examination of some of the categories that drove the changes in household consumption highlight how high-frequency tracking methods have been used to enhance our understanding of household spending activity. These are: transport services, which made up 8 per cent of consumption before the pandemic; health services, which made up 3 per cent; hospitality, which made up 5 per cent; and gambling losses, which made up 2½ per cent.
Transport services
Household spending on transport services plummeted at the onset of the pandemic. High-frequency transport indicators including mobility, public transport, petrol sales and flight data generally declined sharply at the onset of lockdown periods, and then recovered as restrictions eased (Graph 8).

The recovery in transport spending still has a long way to go. While aggregate household consumption was a little above its pre-pandemic level in the December quarter of 2021, transport services remained around 70 per cent below. Spending on public transport has been particularly slow to recover, which reflects precautionary behaviour due to health concerns as well as many employees continuing to work from home for at least part of their working week. Flights have also been slow to recover amid domestic and international border restrictions.
Health services
Household health spending fell sharply during both the June quarter of 2020 and the September quarter of 2021 due to temporary restrictions on non-essential services and the halt to elective surgeries and procedures. Publicly available Medicare benefits data provided an early read on these developments relative to the national accounts (Graph 9). The expansion of telehealth services in March 2020 provided some offset to the decline in health consumption during lockdown periods.

Hospitality
High frequency indicators such as card payments and reservation data provided an early read on hospitality spending as restrictions on dining out came into place (Graph 10). Spending at cafes and restaurants is also susceptible to precautionary behaviour, with restaurant bookings declining in January 2022 alongside rising COVID-19 case numbers despite no formal restrictions being imposed on eating out. Similar patterns were observed in high-frequency clothing & footwear data, which is also heavily reliant on in-person shopping and activity.

Gambling losses
Household gambling expenditure, measured by net losses on gambling activities, fell sharply during lockdowns (Graph 11). The decline in gambling expenditure was mostly accounted for by reduced gaming (or ‘pokie’) machine losses as most gaming venues were closed in response to outbreaks. For example, households in New South Wales and Victoria reduced their gambling losses by $1.7 billion in the September quarter of 2021 with most of the 110,000 gaming machines in these states not operating for much of the quarter. Changes in non-gaming machine gambling losses were relatively small across recent quarters, with changes in other gambling activities like in-person gambling at casinos and online gambling activity broadly offsetting each other. Unlike some other categories of consumption, gaming machine gambling losses typically rebounded completely once lockdowns ended.

Forecasting near-term consumption
Following the success of the initial Australia-wide lockdown in early 2020 in controlling virus numbers, state, city and local government area lockdowns were repeatedly used by authorities to gain control of outbreaks. This presented an additional challenge for tracking household spending, as consumption differed significantly across parts of the country. However, the information gathered during the first lockdown, coupled with the wider range of timely information available on household behaviour, strengthened the ability of forecasters to project the likely response of household consumption.
The ‘rule of thumb’
A rough rule of thumb was that households in locked down areas consumed around 15 per cent less than they would without restrictions for the duration of the lockdown. This rule of thumb was built from assumptions about how much each consumption component is affected by a lockdown (see Appendix A). These assumptions were refined as more information about international and domestic household behaviour became available. For example, the estimated 15 per cent reduction in consumption was revised down from initial estimates at the onset of the pandemic, in part because households adapted to lockdown conditions over time. Victorian household consumption was around 15 per cent below its pre-pandemic level when the state was locked down for the September quarter of 2021.
This 15 per cent ‘hit’ to consumption could then be translated into a quarterly consumption effect by multiplying it by the share of the quarter for which households were expected to be in lockdown and by the share of the population that was affected. For example, the rule of thumb suggested that aggregate Australian consumption growth was around 0.3 per cent lower for every week of lockdown in the Greater Sydney region:
–15% reduction in consumption x 8% (one week of a quarter) x 25% of the Australian population = –0.3 per cent
This impact could then be subtracted from the estimate of quarterly consumption growth that would have occurred absent lockdown restrictions.
Consumption modelling
Models that use the relationship between household spending and measures of population mobility or restrictions by state have also been effective ways to forecast consumption growth (Graph 12). Although more complicated than the rule of thumb, a model can be applied to any period of time, not just when strict lockdowns are in place. At the Bank, a simple model was used, with different estimates arising from different inputs (see Appendix B). Apple and Google mobility data were used as mobility indicators, while a ‘stringency index’ was used as a measure of the relative severity of restrictions.[6] This was constructed using a methodology based on the University of Oxford's cross-country stringency index, information from the Bank's liaison program, state government announcements and other sources (see Appendix C).

A model based on mobility indicators was useful for nowcasting consumption, while a model based on measures of restrictions was useful for forecasting a little further into the future, using assumptions about the likely length of announced restrictions and government roadmaps for the timing of changes to restrictions. This work has been important in anchoring our forecasts and considering the range of possible outcomes (Graph 13).[7]

Conclusion: Informing the longer-term outlook for household consumption
The recovery from the largest economic shock in Australia since the Great Depression has been much stronger than originally anticipated. The Bank's forecasts for household consumption (and business investment) early in the COVID-19 pandemic assumed a significant impact from precautionary behaviour, due to health or economic uncertainty, for several quarters. Health outcomes have played a central role in explaining the better-than-expected path of the economy over the past two years, alongside the resilience of households and businesses and substantial public policy support (Ellis 2021). The large public policy support for household and business incomes during lockdowns ensured that spending levels recovered quickly as restrictions eased. For example, JobKeeper provided considerable certainty about future employment, lessening the spending reductions typically associated with heightened concerns about unemployment (Penrose and La Cava 2021).

Insights from the detailed understanding of household consumption responses during the pandemic have helped to inform the Bank's view of the outlook for the economy. For example, high-frequency indicators showed that household activity snapped back to normal within days of lockdown restrictions being lifted. The observed smaller impact of lockdowns after the first lockdown episode was partly because households and businesses adapted and found ways to operate effectively while in lockdown. Against this backdrop, firms took confidence in the swift rebound in sales and in many cases elected to expand their labour force and increase investment, further supporting demand, and consumers took confidence from the strong labour market. These observations led to a significant reduction in the precautionary behaviour embedded within the Bank's central forecasts for household consumption.
While there is little evidence of lingering negative effects on the level of spending after lockdowns, much of the spending lost during lockdowns is generally not made up at least in the near term. For some categories this is to be expected because it is not possible or desirable to make up for lost spending – for example, a second hair cut or repeated rides on public transport are unnecessary. Overall, the limited scope to ‘catch up’ on lost consumption means that further above-trend growth in household consumption will require the complete range of pre-pandemic consumption possibilities to be available, including discretionary services such as international travel.
As at the December quarter of 2021, household consumption had recovered to be above its pre-pandemic level. But there is still considerable uncertainty around the medium-term outlook for consumption. The wide range of information about household spending and the methods used to analyse this information will help to provide a timely read on key questions, such as whether and when goods and services consumption patterns will normalise and whether and when households will spend the additional savings accumulated in recent years. These methods will also be valuable for monitoring future shocks that affect household activity.
Appendix A: Lockdown ‘rule of thumb’ assumptions
| Consumption type | Share of consumption (per cent) | Lockdown effect (per cent) |
|---|---|---|
| Food | 10 | 15 |
| Discretionary services: eating out, travel, transport, recreation & cultural services and other | 23 | −60 |
| Essential services: rent, utilities, telecommunications, health services, education and financial services | 43 | −5 |
| Durables: household goods, clothing & footwear, cars and recreational goods | 24 | −10 |
| Total | 100 | −15 |
|
Sources: ABS; RBA |
||
Appendix B: Forecasting model
We estimate the model below for the five largest states by population in Australia (estimated over the period since 2010):[8]
Where:
- is consumption in state i in time t (the data is quarterly).
- is some index of restriction on consumption level in state i in time t. We use an inverse of either one of the ‘mobility indicators’ (from Apple and Google), or a ‘stringency index’ based on the University of Oxford methodology.
- is trend growth in state i.
- are time-fixed effects for the pandemic (these quarterly parameters have a value of zero prior to the first quarter of 2020).
- determines the proportional effect of restrictions on consumption.
- is error in state i in time t.
Whichever metric for restrictions (R) is used, the model explains differences in state outcomes quite well (Graphs B1 to B5).


Appendix C: Stringency index
The University of Oxford developed a ‘stringency index’ to compare the strictness of lockdown-style polices in response to COVID-19 across countries.[9] Measures include restrictions such as stay-at-home requirements, border closures and limitations on gatherings. The stringency index converts these different ordinal measures into a score from 0 to 100 ( ) and averages these scores to get a total stringency score for a country or state out of 100. A higher level means more lockdown-style rules. This index does not reflect the degree to which mandated measures are observed or enforced.
We constructed a modified stringency index for the five largest states in Australia, using state guidelines monitored by the Bank's liaison program, supplemented by state government press conferences and information collected by the ABS in 2020. The index was constructed using University of Oxford methodology but the implementation differs slightly. For example, we removed international travel controls and public information campaigns in our modified index. To capture regional level differences, we also calculated stringency for areas within a state with distinct rules (e.g. regional New South Wales and Greater Sydney) and then calculated a weighted average stringency index by population for that state.[10] The application of the methodology is somewhat subjective and the Bank's construction does not necessarily capture all available public information. As such, the index is a useful forecasting tool rather than a definitive indicator in its own right.
| Name | Coding |
|---|---|
| School closing | 0 – no measures |
| 1 – recommend closing or all schools open with alterations resulting in significant differences compared to non- COVID-19 operations | |
| 2 – require closing (only some levels or categories, e.g. just high school, or just public schools) | |
| 3 – require closing all levels | |
| Workplace closing | 0 – no measures |
| 1 – recommend closing (or recommend work from home) or all businesses open with alterations resulting in significant differences compared to non- COVID-19 operation | |
| 2 – require closing (or work from home) for some sectors or categories of workers | |
| 3 – require closing (or work from home) for all-but-essential workplaces (e.g. grocery stores, doctors) | |
| Cancel public events | 0 – no measures |
| 1 – recommend cancelling | |
| 2 – require cancelling | |
| Restrictions on gatherings | 0 – no restrictions |
| 1 – restrictions on very large gatherings (the limit is above 1,000 people) | |
| 2 – restrictions on gatherings between 101–1,000 people | |
| 3 – restrictions on gatherings between 11–100 people | |
| 4 – restrictions on gatherings of 10 people or less | |
| Close public transport | 0 – no measures |
| 1 – recommend closing (or significantly reduce volume/route/means of transport available) | |
| 2 – require closing (or prohibit most citizens from using it) | |
| Stay at home requirements | 0 – no measures |
| 1 – recommend not leaving house | |
| 2 – require not leaving house with exceptions for daily exercise, grocery shopping, and ‘essential’ trips | |
| 3 – require not leaving house with minimal exceptions (e.g. allowed to leave once a week, or only one person can leave at a time etc) | |
| Restrictions on internal movement | 0 – no measures |
| 1 – recommend not to travel between regions/cities | |
| 2 – internal movement restrictions in place | |
| International travel controls | 0 – no restrictions |
| 1 – screening arrivals | |
| 2 – quarantine arrivals from some or all regions | |
| 3 – ban arrivals from some regions | |
| 4 – ban on all regions or total border closure | |
| Public information campaigns | 0 – no COVID-19 public information campaign |
| 1 – public officials urging caution about COVID-19 | |
| 2 – coordinated public information campaign (e.g. across traditional and social media) |
Endnotes
The authors are from Economic Analysis Department and would like to thank Anthony Brassil, Matthew Carter, Iris Day, Melody Chang, Yad Haidari, Fred Hanmer, Calvin He, Cara Holland, Jahan Mand, Diego May, Kate McLoughlin and Tim Taylor for significant contributions to the authors' understanding of household consumption activity during the pandemic. [*]
The June quarter 2020 decline in GDP is likely the largest quarterly decline in economic activity since the onset of the 1930s Great Depression, based on analysis of annual GDP data and the available quarterly economic statistics. [1]
Some household goods spending can also be attributed to developments in the housing market, as house price growth and alterations & additions activity is closely related to spending on consumer durables (May, Nodari and Rees 2019). [2]
The Reserve Bank liaison team conducts around 70–80 discussions each month with firms, agencies and community groups. Liaison meetings are held nationally with firms of all sizes, though most discussions are with mid-sized and large firms, where conditions are somewhat more likely to reflect economy-wide trends rather than firm-specific factors. [3]
Many local and international policy institutions and statistical agencies have increased their use of alternative data, including the European Central Bank (Benatti et al 2020), the Federal Reserve Bank of St. Louis (Dvorkin and Isaacson 2021), the Organisation for Economic Co-operation and Development (Woloszko 2020) and the International Monetary Fund (Chen et al 2020). [4]
For example, utilities, communication services and cigarettes & tobacco. [5]
Apple mobility is based on the Apple Maps application. Apple data capture the number of trips users have requested directions for, categorised by mode of transportation available on the application (walking, transit and driving). Google uses data from devices with ‘Location Services’ on (the default for all devices is off) and publishes statistics categorised by location type, including: retail and recreation; supermarket and pharmacy; parks; public transport; workplaces; and residential. See Apple (2022); Google LLC (2022). [6]
Step ahead estimates for the ‘range of estimates’ are out of sample and use full partial data for the quarter. [7]
To calculate Australia-wide consumption growth, we assume consumption grows in line with the weighted average of the rest of the states for Tasmania, the Northern Territory and the Australian Capital Territory. [8]
See University of Oxford COVID-19 Government Response Tracker or related paper (Hale et al 2021). Tracker information available at <https://www.bsg.ox.ac.uk/research/research-projects/covid-19-government-response-tracker>. [9]
The ABS has a published measure for each state and territory in the second half of 2020 (ABS 2021). Our index excludes the international borders and public health campaign categories, calculates by sub-state measures and is constructed over a longer time period. [10]
References
ABS (Australian Bureau of Statistics) (2021), ‘State Economies and the Stringency of COVID-19 Containment Measures’, March. Available at <https://www.abs.gov.au/articles/state-economies-and-stringency-covid-19-containment-measures-december-quarter-2020>.
ABS (2022), ‘Monthly Household Spending Indicator’, 22 February. Available at <https://www.abs.gov.au/statistics/economy/finance/monthly-household-spending-indicator/latest-release>.
Apple (2022), ‘Mobility Trends Reports’, viewed 9 February 2022. Available at <https://covid19.apple.com/mobility>.
Benatti N, V Botelho, A Consolo, A Dias da Silva and M Osiewicz (2020), ‘High-frequency Data Developments in the Euro Area Labour Market’, ECB Economic Bulletin, May.
Chen S, D Igan, N Pierra and A Presbitero (2020), ‘Tracking the Economic Impact of COVID-19 and Mitigation Policies in Europe and the United States’, IMF Working Paper No 20/125.
Dvorkin M and M Isaacson (2021), ‘Assessing Labor Market Conditions Using High-Frequency Data’, Federal Reserve Bank of St. Louis Review, 103(4), pp 461–476.
Ellis L (2021), ‘Lessons and Lasting Effects of the Pandemic’, Speech to the Ai Group, Adelaide, 23 June.
Google LLC (2022), ‘Google COVID-19 Community Mobility Reports’, viewed 9 February 2022. Available at <https://www.google.com/covid19/mobility/>.
Hale T, N Angrist, R Goldszmidt, B Kira, A Petherick, T Phillips, S Webster, E Cameron-Blake, L Hallas, S Majumdar and H Tatlow (2021), ‘A Global Panel Database of Pandemic Policies (Oxford COVID-19 Government Response Tracker)’, Nature Human Behaviour, 5, pp 529–538.
May D, G Nodari and D Rees (2019), ‘Wealth and Consumption’, RBA Bulletin, March.
Penrose G and G La Cava (2021), ‘Job Loss, Subjective Expectations and Household Spending’, RBA Research Discussion Paper No 2021-08.
Woloszko N (2020), ‘Tracking Activity in Real Time with Google Trends’, OECD Economics Department Working Paper No 1634.