Bulletin – December 2018 Global Economy Developments in Emerging South-East Asia
- Download 1.2MB
Abstract
A number of economies in South-East Asia have been making significant progress in their economic development. This article focuses on the largest middle-income economies in South-East Asia: Indonesia, Malaysia, Thailand, the Philippines and Vietnam. We examine the developments in these economies over recent decades, explore their relationship with Australia and the global economy and consider their potential to reach a significantly higher level of income. These economies have benefited from favourable demographics over recent decades although some will face pressures from ageing populations. However, there are ample opportunities to gain from further improvement in infrastructure, education and labour force participation.
Introduction
The South-East Asian region consists of 11 countries that collectively are home to 645 million people and represent 6¼ per cent of global GDP.[1] This article focuses on the five largest emerging economies in the region: Indonesia, Malaysia, Thailand, the Philippines and Vietnam (hereafter referred to as emerging South-East Asia (ESEA)). Each is significantly larger than the rest of the economies in the region (except for Singapore) and they account for the majority of Australia's trade with the region.[2] It is important to understand and monitor developments in these five economies given their proximity to Australia and their prospects for further development.
In this Bulletin article we discuss the economic developments in ESEA in recent decades. We assess the contribution of policy reforms and financial market development in supporting economic growth in the region, and examine the ESEA economies' relationship with the global economy. Finally, we discuss the region's potential to reach a significantly higher level of income and the challenges that these countries are likely to face.
Economic Features
The ESEA economies are globally important as a group and have close links with Australia; around three per cent of Australia's population were born in ESEA countries. While population growth in ESEA has slowed in recent decades, it has been similar to population growth in India and has consistently outpaced China and the advanced economies. Around 8 per cent of Australian exports are to these five economies, which makes them collectively Australia's third largest trading partner, after China and Japan (Graph 1).

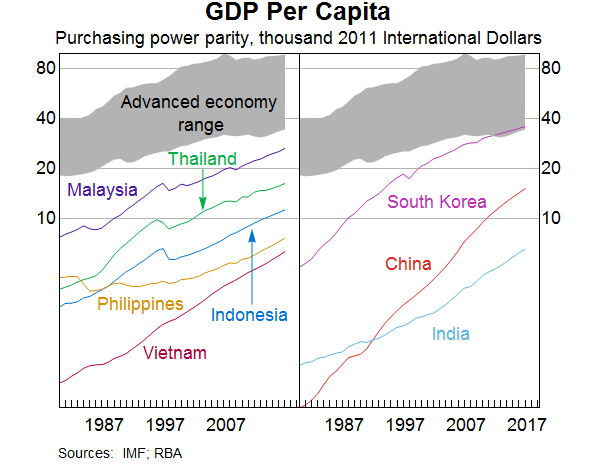
The Asian Financial Crisis (AFC), which started in 1997, was a significant, but ultimately temporary, setback for these countries' economic development. It took Indonesia, Malaysia and Thailand six to seven years for per capita GDP to recover to pre-AFC levels, while the economies of the Philippines and Vietnam were little affected by the crisis. The growth rates of the AFC-affected economies were somewhat slower after 1997, as is typical after episodes of deep recessions. Reforms since the AFC have supported relatively strong GDP growth in ESEA over the past 20 years. Per capita GDP in the region has increased by nearly 70 per cent since 1997, lifting 80 million people out of poverty (ASEAN 2017).[3] The ESEA economies accounted for 5.5 per cent of world GDP in 2017 which is slightly higher than their share immediately before the AFC, while the share in global GDP of most other economies has declined over the past two decades because of the rapid growth in China and India. Nonetheless, these economies are a diverse group and are at different stages of economic development (Graph 2).
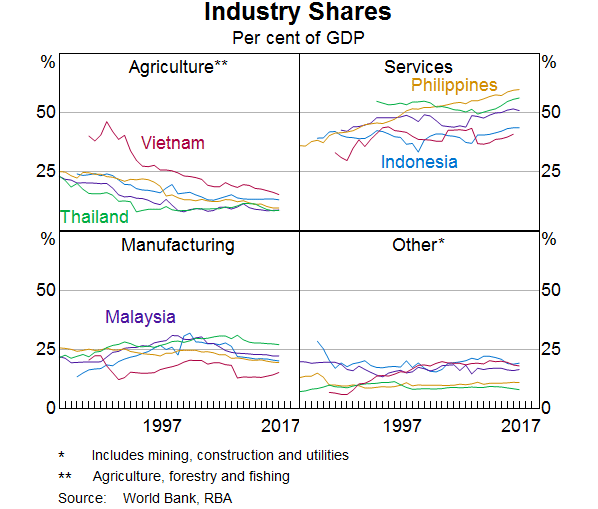
The ESEA economies have industrialised over the past half century. The share of the agricultural sector in ESEA GDP has declined by around 20 percentage points since 1970 (Graph 3). Despite this, agricultural production remains higher than the more developed economies in Asia, relative to GDP, accounting for between 10 and 18 per cent of output in 2016. Further, around half of the population lives in rural areas and a large share of employment in the ESEA economies is in the agricultural sector.[4] The share of output produced in the manufacturing sector increased until the early 2000s, but has since declined as the services sector has grown. The rise of the services sector has been particularly pronounced in the Philippines, in large part due to the development of a sizeable business process outsourcing industry; the services sector now accounts for over 60 per cent of output.
Urbanisation rates in the region have increased significantly over recent decades (Graph 4). Urbanisation is typically associated with increasing industrialisation and higher productivity growth through economies of scale; it also makes public services, such as schooling and health care, more accessible and cheaper to deliver (World Bank 2013). Malaysia's urbanisation rate is now similar to that in many of the advanced economies; the urbanisation rates in Vietnam and the Philippines are still quite low. In contrast to the other ESEA economies, the urbanisation rate in the Phillipines has remained broadly stable in recent decades.
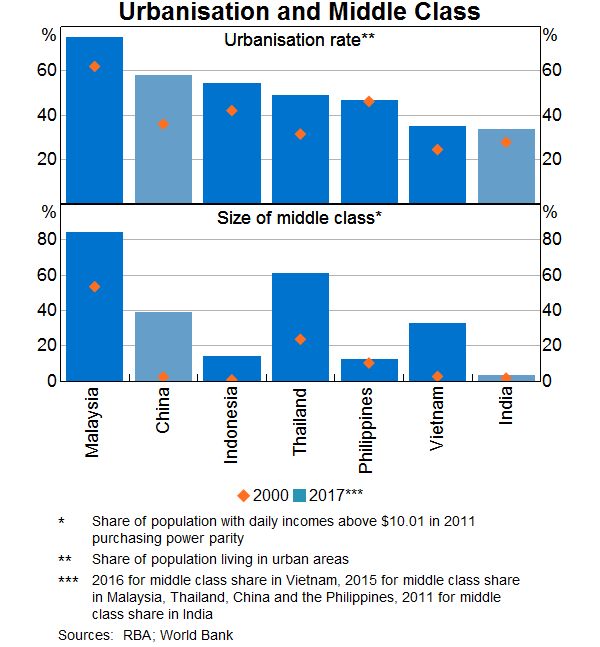
The strong growth in the region has led to a sizeable growth in the middle class, especially after the AFC. This has supported domestic demand, growth in the services sector and demand for education and travel (including to Australia). The size of the middle class in Malaysia is comparable to the advanced economies; the middle class is also relatively large in Thailand. Over the past two decades, high per capita GDP growth has led to considerable expansion of the middle class in Vietnam and Indonesia, though the middle class in Indonesia is still relatively small. In contrast, the middle class in the Philippines accounts for a small share of the population and has been little changed due to slower average per capita GDP growth and relatively high income inequality.
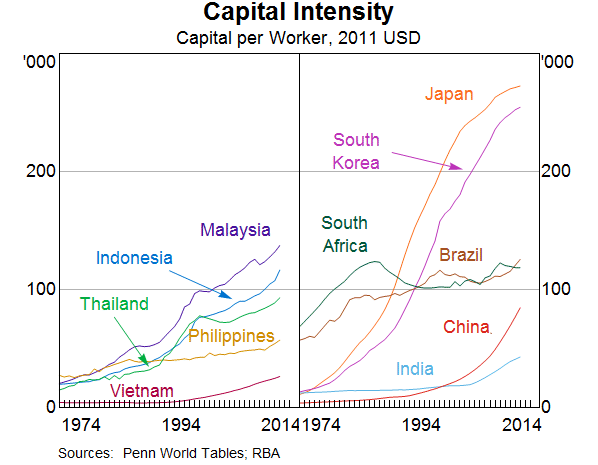
Capital deepening has been the primary source of growth in the ESEA region. Physical capital – for both the private and public sectors – has grown faster than the labour force. This has contributed significantly to the increase in labour productivity. Despite rapid growth, capital per worker remains at a relatively low level in the ESEA economies (Graph 5). Indonesia and Malaysia have the highest capital intensity in the region, comparable to that in some other large emerging economies like Brazil and South Africa. Capital intensity has grown rapidly in Vietnam over the past two decades – as fast as it has in China – but is still lower than in China. In part, this reflects the later start of economic development in Vietnam and that much of Vietnam's manufacturing production is concentrated in labour-intensive lower value-added goods. By comparison, capital per worker in China is now on par with capital intensity of workers in Thailand and remains on a strong upward trajectory.
Recent Developments and Reforms
Although there have been differences, the ESEA economies have performed strongly over the past decade, partly because they put in place a range of reforms after the AFC that increased their resilience (Graph 6). Since 2010, growth in most of the ESEA economies has been driven by robust domestic demand (Table A1). Strong population growth, ongoing urbanisation and a growing middle class have supported consumption growth. Investment growth has been strong in the region and has mainly been supported by political and macroeconomic stability, reforms aimed at improving the business environment as well as sizeable capital inflows. The region has weathered a few stress episodes well, including the ‘taper tantrum’ in 2013, the slowing in Chinese activity in 2015 and, so far, a tightening in global financial conditions over the past few years.[5] Inflation in the region has generally been stable, relatively low and in line with inflation targets. To some extent differences in performance reflect different degrees of trade openness, particularly to China, and the size and duration of countercyclical fiscal policy (Isnawangsih, Klyuev and Zhang 2013).
Macroeconomic reforms
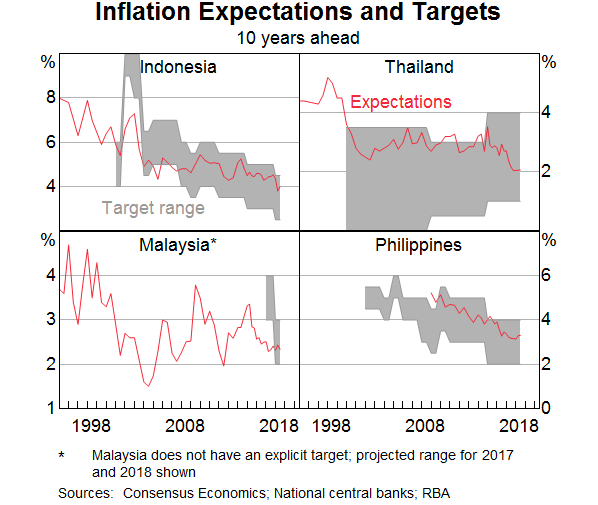
The ESEA economies carried out significant policy reforms following the AFC. Other than Vietnam, these economies have adopted inflation targeting (or in Malaysia's case, ‘inflation anchoring’).[6] Thailand began inflation targeting first in 2000. The Philippines followed in 2002 and Indonesia in 2005. Long-term inflation expectations have been well anchored to the inflation target ranges in these countries since the mid 2000s (Graph 7). This has reduced the size and persistence of the pass-through of short-term inflation shocks, such as currency fluctuations. Inflation targeting has allowed the central banks to tailor their policies more to domestic conditions, thus contributing to more sustainable economic developments (IMF 2018c).
The ESEA economies have maintained largely open capital accounts and moved to more flexible exchange rate regimes after the AFC. The exception is Vietnam, which has a de facto anchor to the US dollar and uses credit growth targets, as well as interest rate targets, to conduct its monetary policy. Central banks in the region have nevertheless increased their holdings of foreign exchange reserves to strengthen their economies' external positions and insulate themselves against capital flight and exchange rate volatility (Sunner 2017). The levels of these reserves are generally adequate according to IMF thresholds (IMF 2018a).[7]
Fiscal policy and external position
The fiscal positions vary significantly across the ESEA economies, but government debt levels are generally low by international standards (Graph 8). A challenge for some of these economies is relatively low levels of government revenue relative to GDP. In recent years, the Philippines Government has implemented a broad, multi-year tax reform to raise government revenues, with a view to funding higher public infrastructure investment and reduce poverty.[8] While Indonesia's fiscal deficit has increased since the GFC, this is in part due to weaker oil and gas tax revenues in recent years and increased spending on infrastructure investment. Despite attempts by the Indonesian authorities to improve tax collection, government revenues relative to GDP have remained the lowest in the region.[9] In Vietnam, government debt has increased substantially since 2012, following a sizeable decline in government revenues from maturing oil fields and a reduction in tariffs under the country's WTO commitments (IMF 2012). In Malaysia, government debt to GDP has stabilised.
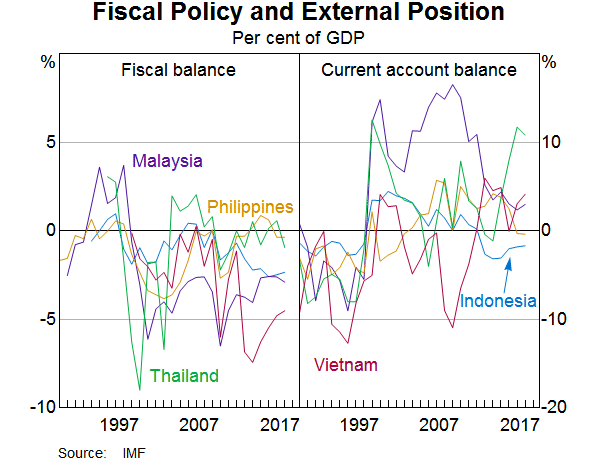
After the AFC, current account positions in ESEA economies moved from deficit into surplus, alongside sizeable capital outflow (Graph 8). They have also become less reliant on net inflows of foreign capital, which can reverse sharply during times of market stress. A range of factors have driven the changes in the current account balances, including commodity prices and domestic policies. For example, historically, Malaysia had a large current account surplus, because of high precautionary saving and large mandatory retirement savings, but this surplus has declined in the past decade due to a rise in investment and a fall in corporate savings. In contrast, Vietnam has run a current account deficit for most of the past 30 years because of an elevated investment rate, although this has turned into surplus in recent years alongside strong export growth.
Financial system development
The development of financial systems in ESEA has supported the strong and stable growth in the region since 2000. Financial market development has helped to address some the vulnerabilities that led to the AFC, such as short-term capital inflows, large savings-investment imbalances and unhedged foreign currency risks. Financial markets in ESEA have expanded relative to GDP since the early 2000s, but have remained small in Indonesia, Philippines and Vietnam (Graph 9). The pace of development has been strongest in Malaysia and Thailand; relative to GDP, their financial markets are approaching those in advanced economies and are comparable to those in China and Korea. Capital markets in the region have also grown in size relative to the banking system, which has resulted in a more diversified financial system, bringing with it increased competition and better access to credit (at least for larger corporate borrowers). Nevertheless, the ESEA economies, similar to most other emerging economies, remain more reliant on bank credit and bonds issued in foreign currency than advanced economies. This is especially the case in Indonesia, the Philippines and Vietnam.
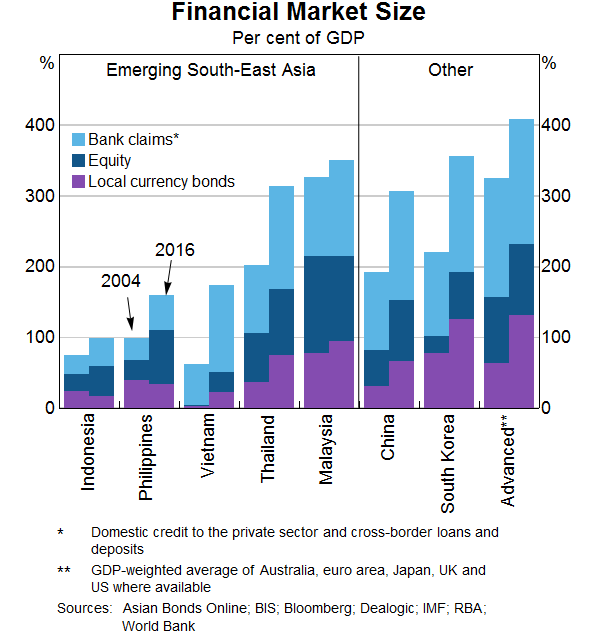
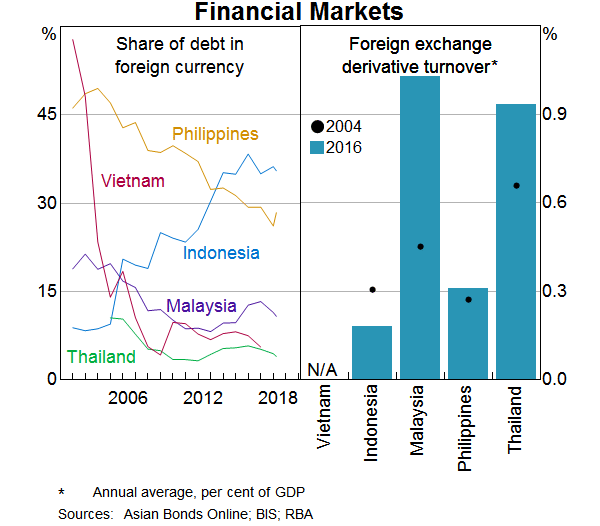
An important related development in the region has been the growth in markets for local currency bonds and foreign exchange derivatives (Graph 10). This has reduced reliance on foreign currency borrowing and allowed for better management of foreign exchange risk. However, in Indonesia and the Philippines, a sizeable share of debt is still denominated in foreign currency and the region's hedging markets generally remain underdeveloped (Ryan 2016).
The accessibility and efficiency of the financial system has generally improved in the ESEA economies since the early 2000s (Table B1). Equity market concentration, a proxy for the difficulties smaller firms have in accessing equity funding, has generally decreased, while ATM density, a proxy for the ease in accessing transactional financial services, has increased. Banks have become more efficient: the spreads between lending and deposit rates have narrowed in most countries, although developments in operating expenses have been more mixed. Liquidity conditions in capital markets have improved, trading volumes in currency markets have increased, and transaction costs in government bond markets (measured by ‘bid-offer’ spreads) have declined. Still, financial system access and liquidity remain lower in the region than in advanced economies and some other economies in Asia.
Relationship with the Rest of the World
Exports
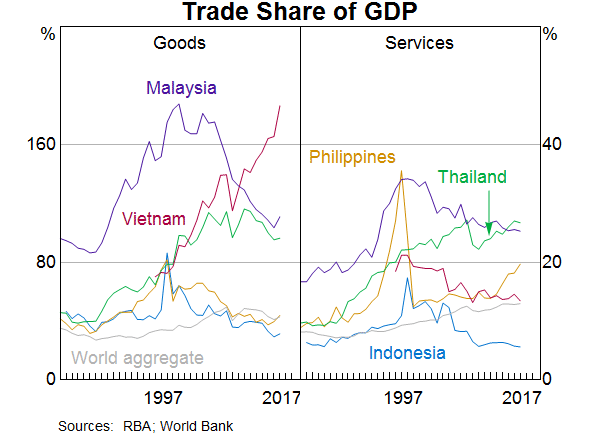
Many of the ESEA economies followed an export-led growth model, especially in the earlier stages of their development (Ando and Kimura 2003). Trade relative to GDP has increased significantly in Malaysia, Thailand and Vietnam since the 1980s, driven by strong growth in manufactured goods exports (Graph 11). The high trade openness of these economies has been a source of growth and development, but has also been a channel of transmission for global shocks. Goods trade has become a less important growth driver for Malaysia and Thailand since the GFC. In contrast, Indonesian exports have been stagnant over the past 40 years, in part because Indonesia is a less open economy and because of policy preferences towards self-sufficiency. The Philippines has developed a more service-orientated export system since the late 1990s, led by the development of business process outsourcing services, which have been attracted by the low labour costs, the population's English language proficiency, and government tax incentives (Errighi, Khatiwada and Bodwell 2016). Over the past decade service export growth in Thailand has been led by very strong growth in tourist arrivals from China (IMF 2018d).
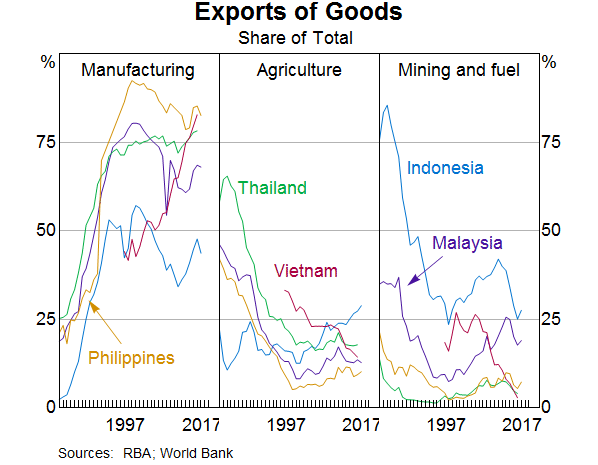
Industrialisation and opening to global trade over the past few decades have driven ESEA's manufacturing exports, which, apart from in Indonesia, have increased to 70–80 per cent of goods exports, while the share of agricultural exports has declined (Graph 12). For Malaysia, Thailand and Vietnam, the high share of manufacturing exports reflects their involvement in global value chains, especially in the production of electronics, which are their largest exports by value. Vietnam, in particular, has continued to see rapid development of its export-oriented manufacturing sector because of its cost competitiveness and policies encouraging foreign investment; Vietnam's exports have trebled since joining the WTO in 2007.
Only Indonesia and Malaysia currently have large commodity exports. Indonesia is the second largest coal exporter in the world, after Australia and ahead of Russia, and has benefited from strong demand from China and high commodity prices. Indonesia and Malaysia are significant oil producers, although Indonesia is a small net oil importer (because it imports most of its refined petroleum) while Malaysia is a small net exporter (because it exports high-quality crude oil and imports lower-quality crude for most of its domestic consumption). The two economies are significant LNG exporters and are the world's dominant palm oil exporters.
Global value chains
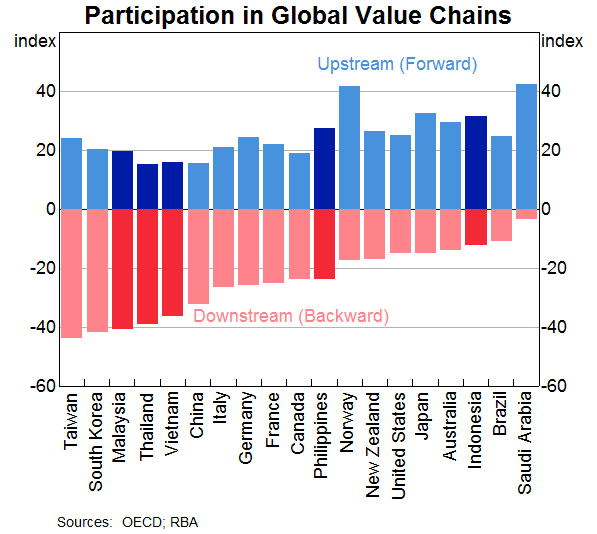
Malaysia, Thailand and Vietnam import components for electronics industries, similarly to China and Korea, and therefore play a significant role as downstream producers in global value chains (Graph 13).[10] As a result, exports from these economies use significant amounts of imported components, and the domestic value-added component of their exports is small. In contrast, the imported content of Philippines exports is relatively low, reflecting the size of the services export sector and that electronics production in the Philippines is earlier in the value chain. The domestic value-added component of Indonesian exports is high because a relatively large share of its exports are commodities used in the production of other economies' exports. This places Indonesia upstream in global value chains, which is similar to a range of other economies with substantial commodity exports, such as Australia, Norway and Saudi Arabia.
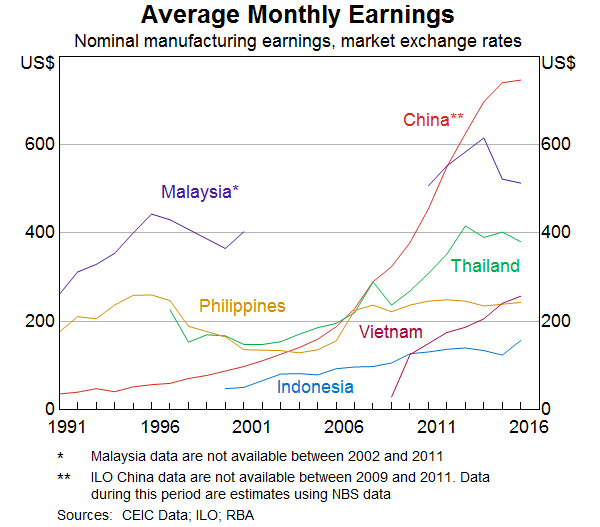
Overall, the ESEA economies are highly competitive as low-value manufacturing destinations because of their relatively low labour costs, particularly relative to China (Graph 14). This, combined with recent policies to attract foreign investment, improve infrastructure and expand access to export markets, has driven the shift of lower-value global manufacturing to these economies; this is likely to continue (The Economist 2018). For example, Vietnam has attracted some of the footwear, clothing and textiles production from China over the past two decades. This has been assisted by the Vietnamese authorities lowering corporate tax rates and establishing an extensive set of bilateral trade agreements, including with the United States in 2001, Japan in 2007 and the European Union in 2018.
Trading partners
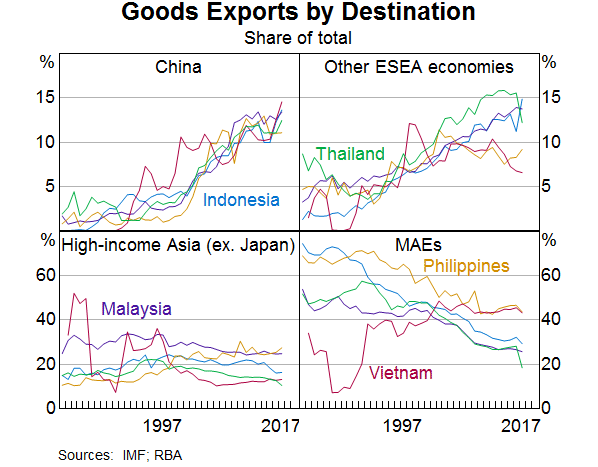
The major advanced economies (MAEs) – the United States, the euro area and Japan – have been, and remain, the main export destinations for ESEA economies.[11] However, the share of exports directly to the MAEs has declined over the past 25 years as export growth to China, Korea and ESEA itself has increased with the development of integrated production networks in the region, especially for electronics (Graph 15). Intraregional trade among the ESEA economies grew strongly from the mid 1990s, supported by the establishment of the Association of Southeast Asian Nations (ASEAN) Free Trade Area in 1992, which reduced tariffs, often to zero, on most manufactured products that originate within ASEAN.[12] Trade with Singapore has also grown strongly, because it is member of ASEAN and has central position in the local trading network. Economic growth in China has led to a rapid increase in the share of ESEA exports to China since the mid 1990s.
Foreign investment
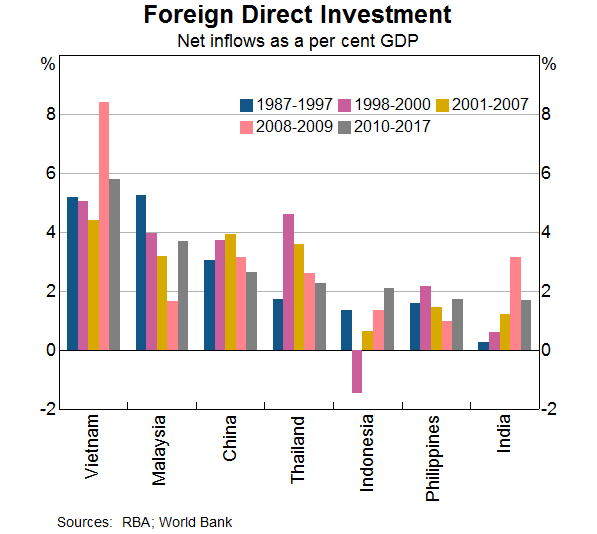
Foreign direct investment (FDI) over the past two decades has been strong in the region (Graph 16). Vietnam has continued to attract very large FDI inflows relative to its GDP, particularly from Japanese and Korean companies expanding their manufacturing operations into the country, encouraged by the privatisation of some state-owned enterprises, reduction in red tape and improved administrative procedures (IMF 2018e). Heightened political uncertainty has led to lower foreign investment flows to Thailand. In Indonesia, the surge in commodity prices between 2010 and 2013 and the improvement in the business environment have supported an increase in FDI inflows.
Links with Australia
The ESEA economies have had longstanding strong trade ties with Australia. In the decade before the AFC, Australian exports to ESEA increased considerably to 11 per cent of total exports in 1997. Australia's exports to the region declined during the AFC, and have been stable at around 8 per cent of total exports since. Vietnam has become an increasingly important destination, with its share of Australian exports tripling over the past 10 years (Graph 17).
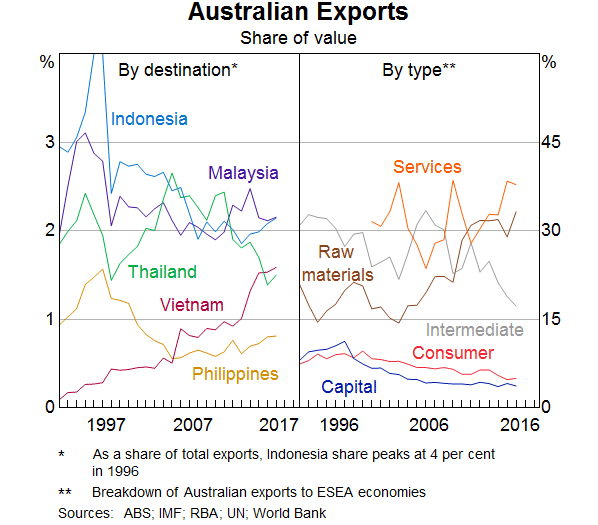
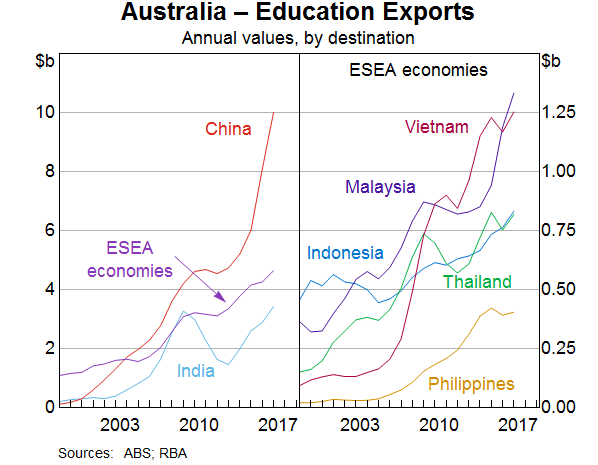
The composition of Australia's exports to the region has also changed. Exports of raw materials have increased from around a third of all Australian merchandise exports to ESEA economies in 1997 to around half. Much of this increase has been driven by Vietnam. Australia's service exports to the region have also increased rapidly, driven by very strong growth in education exports (Graph 18). ESEA economies are the second largest source of foreign students in Australia behind China. As the economies in the region develop and their middle classes continue to grow, their demand for Australian exports, particularly, educational services and tourism, is likely to continue to rise.
Investment between Australia and the ESEA economies is less substantial than other trade links. Investment into Australia by the region accounts for less than 1 per cent of foreign investment in Australia. Australian investment into the ESEA region is also small and only accounts for 1½ per cent of all Australian investment abroad. The ASEAN-Australia-New Zealand Free Trade Agreement, the Trans-Pacific Partnership and bilateral trade agreements with the ESEA economies will support the development of Australia's economic ties with the region.
Economic Convergence and Outlook
The rapid economic growth in the region has seen the ESEA economies move closer to the income levels of the advanced economies. While this trend is expected to continue, the ESEA economies will face two main headwinds in the next few decades – rapidly ageing populations in some economies and maintaining productivity growth. Overcoming these challenges will be important for avoiding stagnation at middle-income levels, commonly referred to as the ‘middle income trap’ (Asian Development Bank 2017).
Demographics
All five economies have experienced a ‘demographic dividend’ since 1970 with steadily declining dependency ratios (Graph 19).[13] As a result, until recently, each of the ESEA economies saw a positive contribution to economic growth from an increase in the size of the labour force. However, declining birth rates and increasing life expectancy mean that some of these economies will experience considerable ageing and slower labour force growth. The dependency ratio troughed in Thailand and Vietnam in 2013 and 2014, respectively, and the Thai population is projected to begin declining within two decades.
The demographic outlook in the other three economies is much more positive. The Philippines has a young and fast-growing population, and its dependency ratio is projected to continue declining for an extended period. Similarly, Indonesia has yet to reach the peak of its demographic dividend, but its population is growing more slowly than in the Philippines. Malaysia is past the peak of its demographic dividend, but its dependency ratio is projected to be remarkably steady until 2050 and to be the lowest among the ESEA economies after 2030.
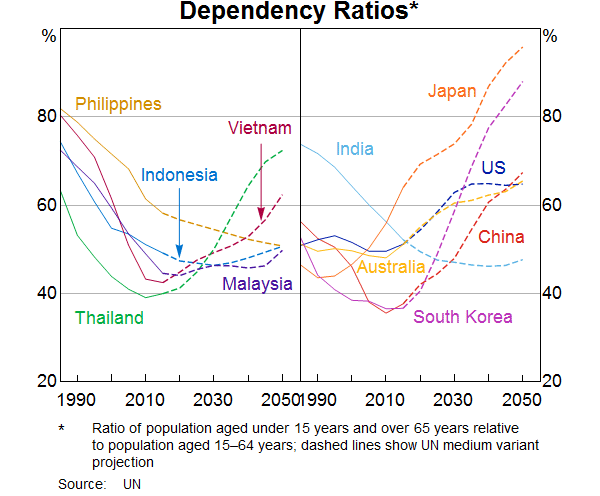
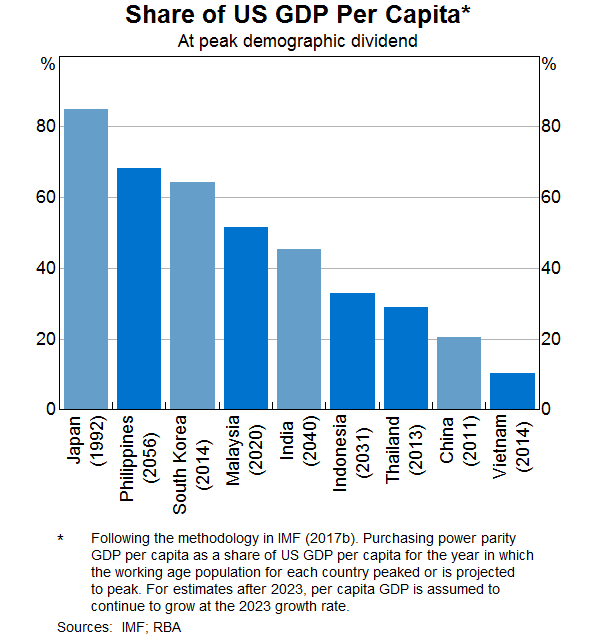
As a result of the demographic outlook, per capita income levels in most of the ESEA economies are projected to be much lower when they reach their peak working-age population share than those in many advanced economies (Graph 20).[14] This is particularly the case for Thailand and Vietnam, which are facing the pressures of rapidly ageing populations at much earlier stages of economic development than many other economies. Population ageing can weigh on growth beyond its direct effect on the size of the labour force by lowering productivity growth (IMF 2017b), which highlights the need for ESEA economies to find ways to maintain productivity growth in the face of ageing.
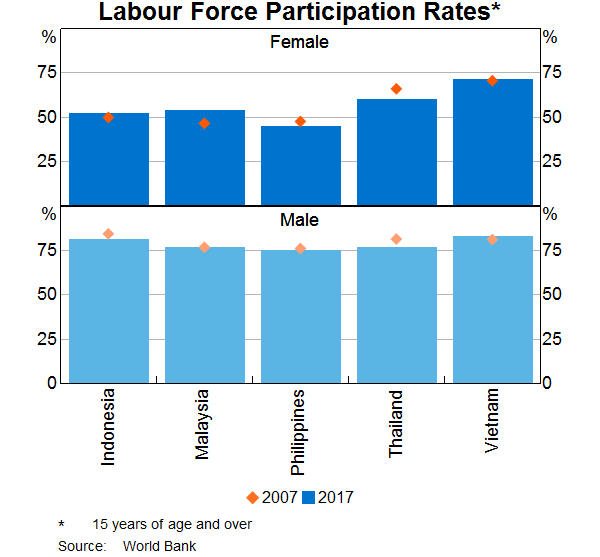
Higher labour force participation would offset some of the effects of ageing. Government policy could play a role in encouraging an increase in female labour force participation rates, which are relatively low across the region, other than in Vietnam (Graph 21). Higher rates of immigration could also help offset the effects of population ageing, although the lower income levels of the ESEA economies may limit the scope for net inward migration (UN 2008).
Policies to increase productivity growth
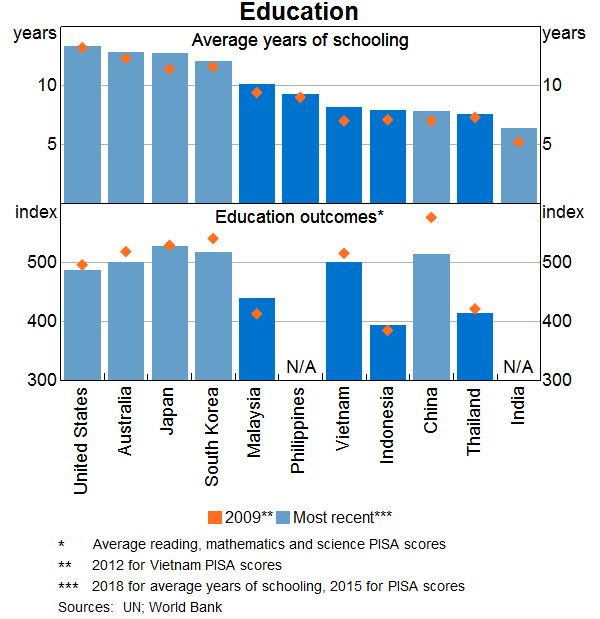
Increasing education is an important way to boost productivity growth. Despite increasing, years of schooling in the ESEA economies are lower than in the advanced economies, but are generally higher than India and China (Graph 22). The quality and access to education is below that in the advanced Asian economies; although Vietnam achieves good results based on international standards such as the Programme for International Student Assessment.
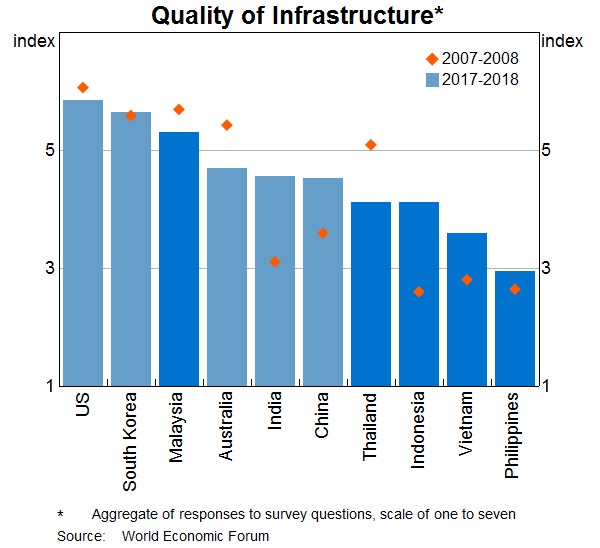
Strengthening of transport and other infrastructure in the region is likely to support investment and productivity growth. However, planning and financing new infrastructure can be challenging (Global Infrastructure Hub 2017). The geography of Indonesia and the Philippines, which are spread over large archipelagos, presents unique challenges in the development of high-quality infrastructure. Nonetheless, the quality of infrastructure in Indonesia, the Philippines and Vietnam has improved over the past decade, although it remains low in the Philippines (Graph 23).[15] Infrastructure quality has deteriorated in Thailand, where investment has been low over the past decade, and Malaysia. Much of the recent infrastructure improvement in ESEA has been in roads and ports, while telephony and electricity infrastructure quality has been little improved outside Indonesia and the Philippines.
Conclusion
The ESEA economies have recorded strong and stable growth since the setback of the AFC. They have increased their macroeconomic flexibility, continued to industrialise, urbanise and integrate into the global economy, and have experienced favourable demographic developments. In the future, these demographic developments are projected to diverge across the region. The populations in Thailand and, to a lesser extent, Vietnam are expected to age considerably, while the other three economies will continue to enjoy favourable demographics for some time. Infrastructure has improved in Indonesia, the Philippines and Vietnam over recent years. Malaysia has continued to approach the ranks of high-income economies, while Thailand has lagged behind.
Although the ESEA economies face a number of challenges, their growth is projected to remain strong. The latest IMF forecasts are that real GDP growth in the region will increase to an average rate of around 5½ per cent per year over the five years to 2023. As these economies become wealthier, their demand for Australian exports is likely to increase. Given Australia's long-established economic links with the region, close proximity, and the positive economic outlook for the region, there is significant scope for Australia's economic relationship with these five economies to strengthen.
Appendix A: GDP Growth and Expenditure Components
| 1987–97(a) | 1998–2000 | 2001–07 | 2008–09 | 2010–17(b) | |
|---|---|---|---|---|---|
| Indonesia | |||||
| GDP | 6.7 | −2.5 | 5.1 | 5.3 | 5.5 |
| Private consumption | 6.8 | 0.0 | 4.0 | 5.1 | 5.1 |
| Government consumption | 3.7 | −2.7 | 7.8 | 13.1 | 3.2 |
| Investment | 10.3 | −11.5 | 7.0 | 7.6 | 6.4 |
| Net exports(c) | −0.2 | 2.3 | −0.1 | 0.6 | 0.1 |
| Malaysia | |||||
| GDP | 8.9 | 2.5 | 5.1 | 1.7 | 5.5 |
| Private consumption | 8.3 | 1.9 | 7.3 | 4.6 | 6.9 |
| Government consumption | 5.8 | 3.3 | 9.0 | 5.9 | 5.4 |
| Investment | 16.5 | −7.7 | 3.8 | 0.0 | 7.7 |
| Net exports(c) | 0.3 | 5.6 | 0.6 | −0.5 | −0.8 |
| Thailand | |||||
| GDP | 8.2 | 0.5 | 5.4 | 0.5 | 3.7 |
| Private consumption | 7.6 | 0.3 | 5.0 | 1.0 | 3.0 |
| Government consumption | 5.4 | 3.7 | 4.8 | 7.7 | 4.2 |
| Investment | 11.8 | −15.1 | 7.9 | −4.3 | 4.5 |
| Net exports(c) | −0.8 | 3.5 | 0.1 | 1.3 | 0.3 |
| Philippines | |||||
| GDP | 3.8 | 2.3 | 5.0 | 2.7 | 6.4 |
| Private consumption | 4.2 | 4.2 | 4.8 | 3.0 | 5.7 |
| Government consumption | 4.7 | −2.2 | 2.8 | 5.6 | 6.6 |
| Investment | 8.8 | −1.9 | 3.1 | 0.7 | 12.4 |
| Net exports(c) | −0.9 | 0.3 | 0.3 | −0.7 | −1.1 |
| Vietnam | |||||
| GDP | 9.0 | 5.8 | 6.9 | 5.5 | 6.1 |
| Private consumption | 7.4 | 3.4 | 7.4 | 5.0 | 6.6 |
| Government consumption | 6.6 | 0.8 | 7.5 | 7.6 | 7.8 |
| Investment | 13.0 | 8.1 | 12.8 | 6.3 | 6.0 |
| Net exports(c) | 0.2 | 1.2 | −1.5 | −0.1 | −0.2 |
|
(a) 1995–97 for Vietnam Sources: CEIC; RBA |
|||||
Appendix B: Measures of Financial System Development
| Access | Financial market efficiency | Banking system efficiency | ||||
|---|---|---|---|---|---|---|
| Equity market concentration(b) | ATM density(c) | Foreign exchange turnover | Bond market transaction costs(d) | Interest rate spread(e) | Overhead costs | |
| % | no | US$b | Bps | % | % of assets | |
| Emerging South-East Asia | ||||||
| Indonesia | 51 | 53 | 5 | 9 | 4 | 3.1 |
| (7) | (45) | (2) | (−12) | (−12) | (−0.3) | |
| Malaysia | 64 | 50 | 8 | 2 | 1 | 1.1 |
| (1) | (23) | (7) | (−1) | (−4) | (0.3) | |
| Philippines | 58 | 25 | 3 | 3 | 4 | 2.1 |
| (23) | (15) | (2) | (−22) | (−8) | (−3.8) | |
| Thailand | 67 | 113 | 11 | 2 | 3 | 1.7 |
| (11) | (93) | (7) | (−6) | (−7) | (−0.1) | |
| Vietnam | 48 | 24 | N/A | 15 | 2 | 1.7 |
| (−12) | (23) | N/A | (−6) | (−6) | (−0.1) | |
| Other | ||||||
| China | 85 | 77 | 73 | 5 | 3 | 1.7 |
| (7) | (67) | (72) | (−27) | (−6) | (0.7) | |
| South Korea | 71 | 276 | 48 | 1 | 2 | 1.7 |
| (21) | (68) | (27) | (−4) | (−4) | (−0.4) | |
| Advanced(f) | 72 | 142 | 796 | <1 | 0 | 2.0 |
| (−1) | (49) | (461) | (0) | (−1) | (−0.4) | |
|
(a) Subject to data availability. Sources: Asian Bonds Online; Bloomberg; IMF; RBA; World Bank |
||||||
Footnotes
Max Alston, Ivailo Arsov and Peter Rickards are from Economic Analysis Department, Matthew Bunny is from International Department. [*]
The South-East Asia region as classified by the United Nations Statistical Division (UN 2018) is Brunei Darussalam, Cambodia, Indonesia, Lao People's Democratic Republic, Malaysia, Myanmar, Philippines, Singapore, Thailand, Timor-Leste and Vietnam. [1]
The 6th largest emerging economy in South-East Asia is Myanmar, and its PPP GDP is only a half of the 5th largest (Vietnam). Australia's total trade with the rest of the emerging economies in South-East Asia is a fraction of the trade with any one of the five economies discussed in the article. [2]
Most of the decline in poverty from 1995 to 2015 has been in Indonesia (60 million) and Vietnam (25 million). Population in a state of poverty is defined as those living on incomes below the $1.25 (2011 PPP) poverty line as defined by ASEAN. [3]
Labour productivity in the agricultural sector in the ESEA economies is low and, as a result, the employment share of the sector is much higher than its output share. The agricultural sector's employment share is the highest in Vietnam (40 per cent). It also quite high in Indonesia and Thailand (around 30 percent) and the Philippines (26 per cent), but relatively low in Malaysia (11 per cent). [4]
For further information see Box A in RBA (2018). [5]
Malaysia's central bank has price stability as a policy objective, but does not have a singular target for inflation. It is widely considered to have an implicit inflation targeting framework and the policy outcome, stable inflation, is the same (Dany-Knedlik and Garcia 2018) and (IMF 2018c). The Malaysian central bank refers to this as ‘inflation anchoring’ (bin Ibrahim 2018). [6]
The IMF calculates thresholds which take into account several possible sources of drains in reserves and cross-country differences in exchange rate regimes and capital controls. [7]
The 2017 tranche of the tax reforms – Tax Reform for Acceleration and Inclusion (TRAIN) – lowered and simplified personal income taxes, simplified estate and donor's taxes, expanded the VAT base, adjusted oil and automobile excise taxes, and introduced an excise tax on sugar-sweetened beverages. For further details see Department of Finance (2017). [8]
More recently these measures included a tax amnesty in 2016 and 2017. General government revenue in the Indonesia was 14 per cent of GDP in 2017, while the ratio in the other four economies was 19½–23½ per cent. In 2011 the ratio was 17 per cent as government revenues were boosted by higher commodity prices. Some of the decline since 2011 is due to the fall in oil prices in 2014 and 2015, but non-oil revenue has also declined (IMF 2017c). [9]
For example, Vietnam has become the second largest exporter of smartphones after China as it has become a key assembly facility for Korean manufacturers; Samsung alone accounted for almost one quarter of Vietnam's total exports in 2017 (The Economist 2018). [10]
Vietnam is an exception to this trend. Its exports to the MAEs rose sharply in the mid 1990s and has been steady since then. This largely reflects the restoration of US-Vietnamese economic relations in 1994. Exports to the United States are now around a fifth of Vietnam's total goods exports and the bulk of them are finished consumer goods; exports to the euro area have also grown strongly over this period. [11]
ASEAN includes the ESEA economies, as well as Brunei Darussalam, Cambodia, Lao People's Democratic Republic, Myanmar and Singapore. [12]
The dependency ratio measures the size of the population that would typically be supported economically relative to the size of the population that is of working age (Lee and Mason 2006). When the ratio declines, an economy is said to be experiencing a ‘demographic dividend’, as an increasing share of the population is available to be engaged in productive activity (Lee and Mason 2006). [13]
The notable exception to this is the Philippines, which is projected to reach its peak working age population share in 2056. However, projections of per capita growth rates over such long period are highly uncertain. The projection in Graph 20 assumes that the Philippines maintains a relatively high GDP per capita growth rate for three decades. Such an outcome is unlikely as growth rates tend not to be persistent over such a long period and to revert to the mean (Pritchett and Summers 2014). As result, the relative per capita GDP in the Philippines at the peak of its working age population share is likely to be somewhat lower than shown in Graph 20. [14]
Measuring the quality of infrastructure is difficult and highly subjective, particularly in large countries, such as India and China, where there are large disparities in the quality of infrastructure between urban and rural areas. The most widely used measures are based on surveys of business executives conducted by the World Economic Forum. [15]
References
Ando M and F Kimura (2003), ‘The Formation of International Production and Distribution Networks in East Asia’, NBER Working Paper 10167.
ASEAN (2016), ‘Master Plan on ASEAN Connectivity 2025’, 6 September. Available at <https://asean.org/wp-content/uploads/2016/09/Master-Plan-on-ASEAN-Connectivity-20251.pdf>.
ASEAN (2017), ‘Statistical Report on Millennium Development Goals 2017’, 6 October. Available at <https://asean.org/wp-content/uploads/2012/05/ASEAN_MDG_2017.pdf>.
Asian Development Bank (2017), ‘Asian Development Outlook (ADO) 2017: Transcending the Middle-Income Challenge’.
Bank of Thailand (2013), ‘Labor Constraints and Economic Growth’, Monetary Policy Report.
Bank of Thailand (2017), ‘Household Debt Deleveragoing and Implications for the Economy’, Monetary Policy Report, September. Available at <https://www.bot.or.th/English/MonetaryPolicy/MonetPolicyComittee/MPR/BOX_MRP/BOX_MPR_EN_Q32017_2.pdf>.
bin Ibrahim M (2018), ‘Public policy perspective - some thoughts and contemplations from a central banker’, 40th Harvard Business School Alumni Club Malaysia Anniversary Dinner, Kuala Lumpur, 9 February. Available at <https://www.bis.org/review/r180209d.pdf>.
Bosch M and W Maloney (2008), ‘Cyclical Movements in Unemployment and Informality in Developing Countries’, World Bank Policy Research Working Paper 4648.
Busch M (2017), ‘The Missing Middle: A Political Economy of Economic Restructuring in Vietnam’, Lowy Institute site, 8 December. Available at <https://www.lowyinstitute.org/publications/missing-middle-political-economy-economic-restructuring-vietnam#section_34051>.
Chun N (2010), ‘Middle Class Size in the Past, Present and Future: A Description of Trends in Asia’, ADB Economics Working Paper Series 217.
Dany-Knedlik G and JA Garcia (2018), ‘Monetary Policy and Inflation Dynamics in ASEAN Economies’, IMF Working Paper 18/147.
Debelle G (2015), ‘Bond Market Liquidity, Long-term Rates and China’, Actuaries Institute ‘Banking on Change’ Seminar, Sydney, 16 September.
Department of Finance (2017), ‘What is the Comprehensive Tax Reform?’. Available at <http://www.dof.gov.ph/taxreform/>.
Elias S and C Noone (2011), ‘The Growth and Development of the Indonesian Economy’, RBA Bulletin, December, pp 33–43.
Errighi L, S Khatiwada and C Bodwell (2016), ‘Business process outsourcing in the Philippines: Challenges for decent work’, ILO Asia-Pacific Working Paper Series.
Global Infrastructure Hub (2017), ‘Global Infrastructure Outlook’, Infrastructure investment needs: 50 countries, 7 sectors to 2040, 25 July. Available at <https://outlook.gihub.org/>.
Hidalgo C and R Hausmann (2009), ‘The building blocks of economic complexity’, Proceedings of the National Academy of Sciences of the United States of America, 106(26), pp 10570–10575.
IMF (2012), ‘Vietnam: Staff Report for the Article IV Consultation’, 27 April.
IMF (2013), ‘Is Middle-Income Asia at Risk of a Sustained Growth Slowdown?’, Asia and Pacific Regional Economic Outlook: Shifting Risks, New Foundations for Growth.
IMF (2016), ‘ASEAN-5 Cluster Report – Evolution of Monetary Policy Frameworks’, June. Available at <https://www.imf.org/external/pubs/ft/scr/2016/cr16176.pdf>.
IMF (2017a), ‘Malaysia: Staff Report for the 2017 Article IV Consultation’, 28 April.
IMF (2017b), ‘Asia: At Risk of Growing Old before Becoming Rich?’, Regional Economic Outlook: Asia and Pacific, May 2017: Preparing for Choppy Seas.
IMF (2017c), ‘Indonesia: Staff Report for the 2017 Article IV Consultation’, 21 December.
IMF (2018a), ‘Global Financial Stability Report April 2018: A Bumpy Road Ahead’, 2 April. Available at <https://www.imf.org/en/Publications/GFSR/Issues/2018/04/02/Global-Financial-Stability-Report-April-2018>.
IMF (2018b), ‘Chart of the Week: Malaysia Needs More Women in the Workforce’ IMF Blog, 2 April. Available at <https://blogs.imf.org/2018/04/02/chart-of-the-week-malaysia-needs-more-women-in-the-workforce/>.
IMF (2018c), ‘Annual Report on Exchange Arrangements and Exchange Restrictions 2017’, 30 April. Available at <https://www.imf.org/en/Publications/Annual-Report-on-Exchange-Arrangements-and-Exchange-Restrictions/Issues/2018/08/10/Annual-Report-on-Exchange-Arrangements-and-Exchange-Restrictions-2017-44930>.
IMF (2018d), ‘Thailand: Staff Report for the 2018 Article IV Consultation’, 4 June.
IMF (2018e), ‘Vietnam: Staff Report for the 2018 Article IV Consultation’, 10 July.
Isnawangsih A, Klyuev and L Zhang (2013), ‘The Big Split: Why Did Output Trajectories in the ASEAN-4 Diverge after the Global’, IMF Working Paper 13/222.
Ito T (2007), ‘Asian Currency Crisis and the International Monetary Fund, 10 Years Later: Overview’, Asian Economic Policy Review, 2(1), pp 16–49.
Lee R and A Mason (2006), ‘What is the Demographic Dividend?’, IMF Finance and Development, 43(3).
OECD (2014), ‘Long-term baseline projections, No. 95 (Edition 2014)’, OECD Economic Outlook: Statistics and Projections (database).
Pritchett L and L Summers (2014), ‘Asiaphoria Meets Regression to the Mean’, NBER Working Paper 20573.
RBA (2011), ‘Box A: The Japanese Earthquake and Global Supply Chains’, RBA Statement on Monetary Policy, August, pp 17–19.
RBA (2018), ‘Box A: Financial Market Resilience of Emerging Asia’, Statement on Monetary Policy, August.
Roberts I, T Saunders, G Spence and N Cassidy (2016), ‘China's Evolving Demand for Commodities’, in I Day and J Simon (eds), Structural Change in China: Implications for Australia and the World, Proceedings of a Conference, Reserve Bank of Australia, Sydney, pp 107–158.
Ryan C (2016), ‘The Development of Hedging Markets in Asia’, Speech at the 7th Pan Asian Regulatory Summit, Hong Kong, 8 November.
Sarma V, S Paul and G Wan (2017), ‘Structural Transformation, Growth and Inequality: Evidence from Viet Nam’, Asian Development Bank Institute Working Paper 681.
Stevens G (2007), ‘The Asian Crisis: A Retrospective’, Address to The Anika Foundation Luncheon, Sydney, 18 July.
Sunner D (2017), ‘Trends in Global Foreign Currency Reserves’, RBA Bulletin, September, pp 75–84.
The Economist (2018), ‘Why Samsung of South Korea is the biggest firm in Vietnam’, 12 April.
UN (2008), ‘Situation Report on International Migration in East and South-East Asia’, Regional Thematic Working Group on International Migration Including Human Trafficking.
UN (2018), ‘Standard country or area codes for statistical use (M49)’. Available at <https://unstats.un.org/unsd/methodology/m49/>.
United Nations Conference on Trade and Development (2017), ‘Review of Maritime Transport 2017’, 25 October. Available at <https://unctad.org/en/pages/PublicationWebflyer.aspx?publicationid=1890>.
Venzon C (2017), ‘Duterte thinks big on Philippine infrastructure’, Nikkei Asian Review, 25 January. Available at <https://asia.nikkei.com/Economy/Duterte-thinks-big-on-Philippine-infrastructure>.
World Bank (2013), ‘Rural-Urban Disparities and Dynamics’, Global Monitoring Report 2013: Rural-Urban, World Bank, Washington, DC.
Zuk P, S Li, EK Polgar, JL Diaz del Hoyo and P Konig (2018), ‘Real Convergence in Central, Eastern and South-Eastern Europe’, ECB Economic Bulletin, Issue 3, pp 36–65.