Reserve Bank of Australia Annual Report – 1974 The Australian Economy
Economic activity in Australia remained at a very high level in 1973/74. Strong pressures on resources continued throughout the year, despite a very large rise in imports. Monetary policy, which had become less easy towards the end of the previous financial year, was tightened sharply in the first half of 1973/74. A heavier than usual flow of taxes to the Government, and a growing current account deficit, produced very tight liquidity conditions in the second half of the year, with considerable competition amongst financial intermediaries for available funds. However inflationary expectations, built up during the period from late 1971/72 when money supply had begun to grow excessively, continued to strengthen, helping to sustain extremely large rises in wages and prices. In the face of these continued pressures on resources and prices, restrictive monetary policy was pressed more strongly towards the end of the year; at the same time there were some restrictive fiscal initiatives.
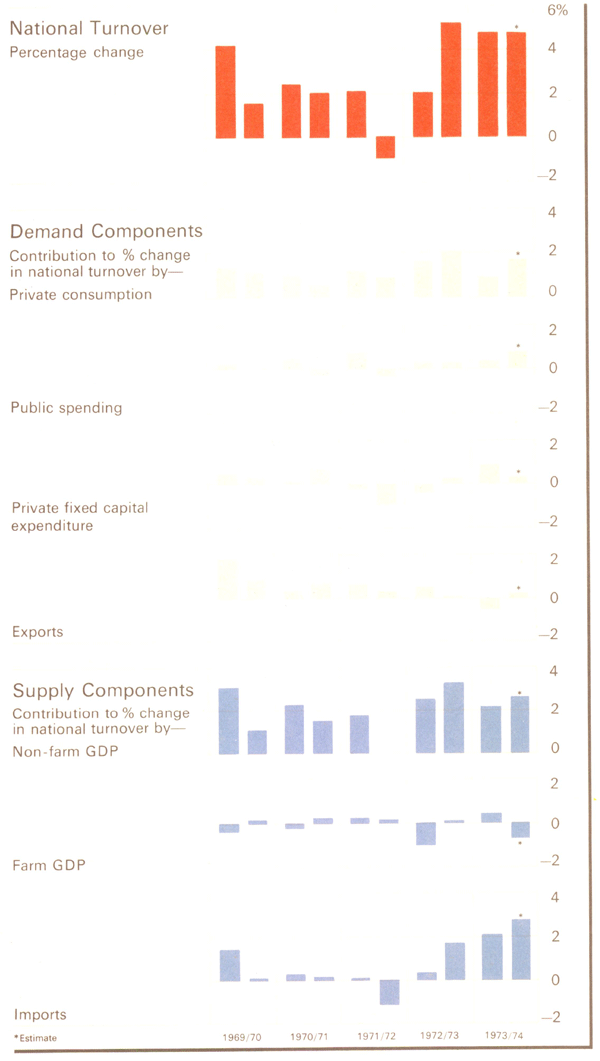
9 National Turnover of Goods and Services
1966/67 PRICES-SEASONALLY ADJUSTED-HALF YEARLY
Economic Activity
Spending in Australia rose much more quickly than domestic output in 1973/74. A surge in imports helped bridge the gap but pressures on domestic resources increased during much of the year, with a further tightening in the labour market, significant supply shortages and continued stresses on prices. Towards the close of the year there were some signs of an easing of strains in certain goods and factor markets, but activity generally remained at a high level.
Demand
Gross national expenditure rose by over 12 per cent in constant prices during 1973/74, more than three times as quickly as in 1972/73. The quantity of goods and services exported was not quite as large as in 1972/73 but this mainly reflected supply constraints, and pressures on resources were not commensurately lowered.
Demand growth quickened in the last half of 1972/73; this continued into 1973/74, though as the middle of the year approached some indicators suggested a slowing in the growth of real spending. With hindsight, however, it appears that supply shortages, and some uncertainties flowing from the anti-inflationary measures introduced in September, were mainly responsible for some confusing signals. In the event, real spending grew strongly in the second half of the year.
Business fixed investment provided considerable stimulus to demand early in 1973/74. After falling for the best part of two years, business fixed investment had shown positive signs of recovery only towards the end of 1972/73, well after most other forms of spending had turned firmly upward. The strong growth in business investment in the first half of 1973/74 took place despite factors such as the move to higher interest rates and the appreciation of the Australian dollar, tariff cuts, changes in company tax arrangements and the ending of some investment tax concessions. Of course, programmes with long gestation periods are not lightly cancelled. Later in the financial year business fixed investment weakened, but so far it is not entirely clear what part supply difficulties may have played in keeping outlays below the exuberant levels predicted earlier by businesses. Business investment was higher during the financial year just ended both in buildings and, particularly, plant and equipment; expenditure on buildings appears to have been increasingly on factories and shops rather than offices. Investment in the mining sector, which had lagged for some time, recovered significantly. Stocks, which were at relatively low levels at the end of 1972/73, rose only slightly in early 1973/74; later in the year a much higher proportion of available supplies went towards replenishing stock levels.
The Australian Government in 1973/74 budgeted for a rise in total outlays of 19 per cent, compared with a rise of 13 per cent in 1972/73. Increases were foreshadowed particularly for education, social security and housing, and community activities. Total budget expenditures in the outcome rose by 20 per cent in 1973/74, including rises of 18 per cent in spending on goods and services and 19 per cent in transfer payments, of which nearly 10 percentage points reflected increased payments to the States.
After allowing for price increases there was moderate growth in government spending in the first half of the year, although this was mainly due to outlays on F111 and Boeing 747 aircraft. Public sector consumption grew firmly during this period but capital spending, especially by state and local governments, was lower in real terms. Later in the year government capital spending rose strongly, although growth in current outlays slackened. Growth in government spending added further during the year to the already excessive pressures on resources.
Real private consumption expanded strongly in 1973/74, though not quite at the rate of the previous financial year. Purchases of motor vehicles fell away after the September quarter, but recovered late in the year: spending on household durables generally remained strong throughout. Supply shortages were a major limiting factor for a time. A continued strong expansion of disposable personal incomes outstripped the growth in consumer spending; personal savings grew further, even though expectations of continued rapid price rises were strengthening.
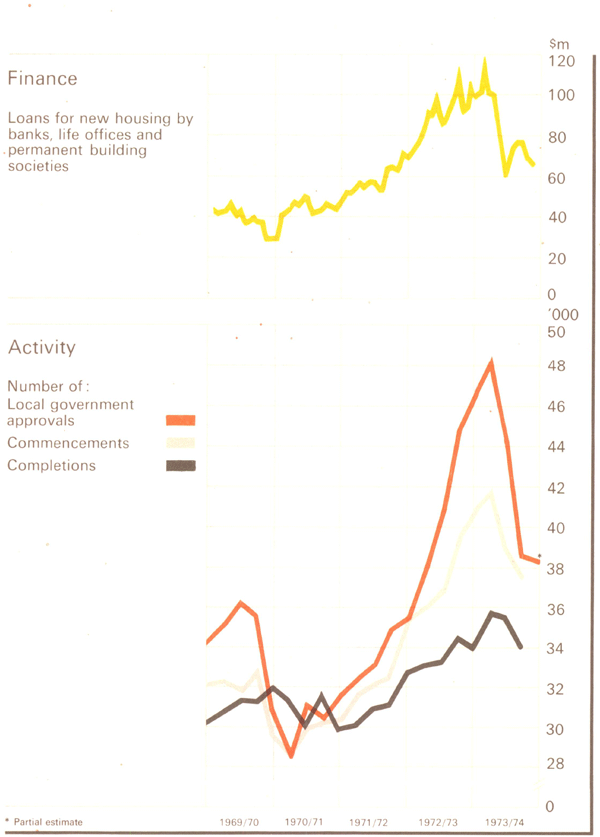
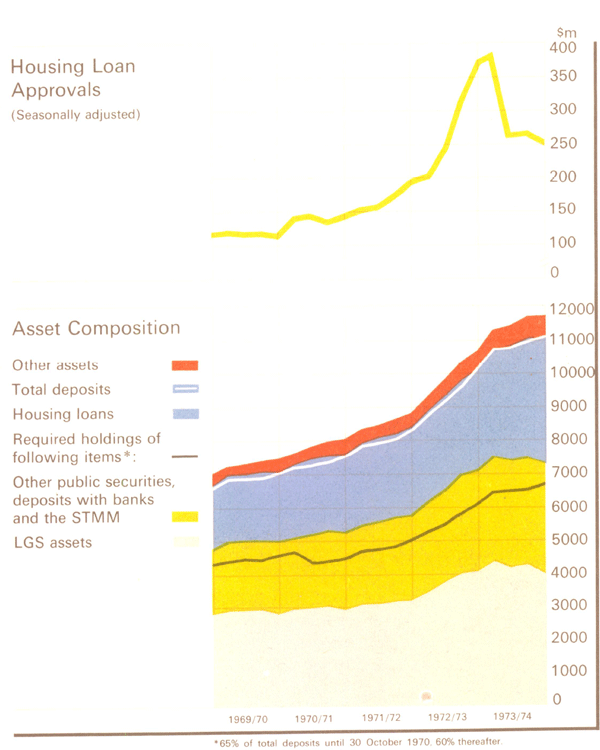
Private investment in dwellings had expanded rapidly in 1972/73. This growth had been accompanied by increasing pressures on capacity, lengthening construction times and large price increases; it had been facilitated by very high rates of new lending by the housing finance sector. In his Budget speech in August the Treasurer indicated the need to seek some moderate abatement in rates of private housing construction to correct these emerging imbalances, and to make way for additional public sector housing for low income groups. Savings banks were asked in August to contain their rates of new lending for housing. Finance for housing provided by the major private lenders in aggregate fell in the months following the September measures to a rate more than one-third below the August peak. Numbers of both private and government dwellings approved came down in the December quarter; commencements also fell yet dwellings under construction continued to rise—evidence that there were still serious delays in building operations. The supply of housing finance continued at reduced rates over the remainder of the year. Numbers of approvals and commencements fell further but at the end of the year there was still a very considerable number of dwellings under construction, and it appeared that it would be some time before activity in the industry fell to more manageable levels. Overall, real private spending on dwellings in 1973/74 grew by around 6 per cent, compared with about 9 per cent in the previous twelve months, and an average annual growth of 8 per cent over the last decade.
10 Private Housing
SEASONALLY ADJUSTED
The volume of goods and services exported, which had declined towards the end of 1972/73, remained fairly stable until late in 1973/74. Supply constraints reduced the quantity of wool and sugar exported, while lower overseas demand and protectionist measures in some markets reflected in much smaller shipments of beef in the second half of the year. The increase in the volume of non-rural exports was much smaller than in other recent years.
Supplies
Real gross domestic product seems to have risen by over 6 per cent in 1973/74 compared with a little under 4 per cent in the previous twelve months. The rise of about one-third in the quantity of goods and services imported, an increase greater than in any financial year since the early 1950's, added almost as much to available supplies as did the growth in domestic production.
The rise in real non-farm domestic product in 1973/74 appears to have approached 7 per cent, a rather larger increase than in the previous twelve months. Industrial production rose strongly in the early part of 1973/74 but shortages of labour and materials, with industrial disputes, acted to constrain output in the three months to December. Production rose again in the March quarter and in the final three months of the financial year was about 6 per cent above that for the June quarter of 1972/73. Production increases were especially marked for a wide range of durable goods. Production of minerals and fuels was also higher, though the increase was less than in other recent years. Building and construction added to the growth in non-farm product in 1973/74; the smaller growth in dwelling. construction was more than offset by the recovery in non-residential building and construction.
Gross domestic farm product, which had fallen through much of 1972/73, rose modestly in 1973/74. Output of wheat virtually doubled, and production of other grains rose by about 40 per cent. Beef production fell sharply in the second half of the year, but with less beef exported, more became available locally. Lower average sheep numbers led to a fall for the fourth successive year in the quantity of wool produced. High average wool prices, combined with the lower sheep numbers, resulted in a further sharp drop in mutton and lamb production.
11 Earnings, Productivity, Unit Labour Costs
NON-FARM SECTOR, HALF-YEARLY PERCENTAGE CHANGES-SEASONALLY ADJUSTED
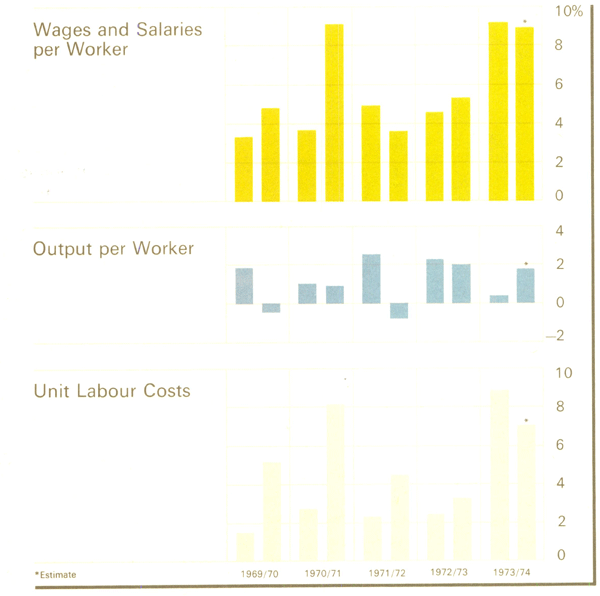
Output per worker rose more slowly in 1973/74 than in the previous twelve months. Factors affecting this indicator include the ratio of capital per worker, the level of skills in the workforce and hours of work. Output per worker typically rises more slowly as the peak of an upswing is approached, when capacity becomes fully used. This factor, as well as the effects of industrial disputes, applied in Australia in 1973/74. There are also transitional effects on output per worker from structural changes such as tariff cuts and moves to expand the relative size of the public sector. Although in the longer run these changes should improve efficiency and increase community welfare, a cost may be a temporary reduction in productivity.
With net migration remaining subdued the population of working age rose by a comparatively low 1.9 per cent in 1973/74. However, an increase in the proportion of the working age population, especially of women, available for employment saw the labour force rise by about 3.5 per cent during the financial year. With demand for labour continuing to outstrip available supplies there was a further net fall to 1.5 per cent in the proportion of the workforce registered as unemployed; numbers in civilian employment rose by over 4 per cent during 1973/74.
Employment in the private sector grew much more quickly than government civilian employment during the financial year. Growth in government employment was held down initially by the phasing out of the Australian Government's unemployment relief schemes but rose more quickly in the second half of the year. Private civilian employment rose at the very high average annual rate of 6.5 per cent in the first six months of the year, a rate not maintained over the balance of the period. Numbers of females in civilian employment rose about 2½ times as quickly over 1973/74 as numbers of males. Growth in employment was strongest in the tertiary industries, although growth in the manufacturing sector was also substantial. There was little net change in employment in building and construction, probably reflecting shortages of suitably qualified labour and the winding down of relief schemes. Although there was some easing in the final months of the year, a very large amount of overtime was worked throughout 1973/74. There were some indications that this may in part have reflected reductions in normal hours of work.
Unemployment fell slightly in 1973/74, but the number of applicants remained higher than might have been expected, given the degree of pressure on resources. This was in line with experience in other countries. In Australia recent increases in unemployment benefits relative to average earnings, and rises in minimum awards, may have tended to increase the proportion of the labour force recorded as unemployed at any given level of activity. Higher benefits encourage some people to substitute leisure for work, and those who become unemployed for any reason are under less pressure to seek immediate reemployment. In particular the proportion of juniors unemployed may have been affected by these changes. Higher minimum awards tend to make the gaining of employment more difficult for groups disadvantaged, for one reason or another, in the eyes of employers.
Applicants for employment fell during the September quarter, despite the ending of the Australian Government's unemployment relief scheme. Numbers of applicants rose in the following four months; in January flooding in two states was at least partly responsible. After falling from February through April inclusive, applicants rose again in the final two months of the year. Vacancies rose relatively more quickly than applicants fell in 1973/74. The rise in vacancies through the end of 1972/73 and early 1973/74 was faster than in previous upswings; growth in vacancies for less skilled labour in this period probably reflected in part the relatively subdued levels of migration. Vacancies fell through the December quarter. The September measures may have engendered some uncertainties, and production was disrupted by supply shortages and industrial unrest. In the three months to March vacancies rose strongly once more, but declined in the final quarter of the year. The labour situation tightened for most occupational groups in the workforce during the year, particularly for skilled metal and electrical workers.
Despite supply shortages abroad, pressure on domestic resources and changes in relative prices led to a very considerable upsurge in the quantity of goods and services imported in 1973/74. The 25 per cent across-the-board tariff cut announced in July, and the later cuts on certain electrical and household goods, provided stimulus, as did the relative appreciations of the Australian dollar. The rise in imports covered a wide range of producer and consumer goods; increases were particularly strong in textiles and footwear, a range of consumer durables, and motor vehicles. By the June quarter of 1974 imports of textiles, motor vehicles, and electrical machinery were running at rates close to double those of twelve months earlier.
Incomes and Prices
As previously noted, a reversal of the 1972/73 decline in farm output contributed to the faster growth in real gross domestic product in 1973/74. Growth in prices of farm products, although slower than in the previous 12 months, on average was still very high, and growth in non-farm prices accelerated. In money terms gross domestic product in 1973/74 rose by over 20 per cent, compared with 13 per cent in the previous twelve months.
Although export prices of some major commodities such as wool and meat came down in the course of 1973/74, prices of rural products on average were about 40 per cent higher than in 1972/73; in that year rural prices had risen by 55 per cent from what were in many cases very low levels. With larger quantities of rural goods produced, farm sector incomes rose by over 40 per cent in 1973/74, much the same increase as in 1972/73.
In the non-farm sector, the price of output rose by over 12 per cent during 1973/74, compared with 6 per cent in 1972/73. Incomes rose by 20 per cent in the latest 12 months. Aggregate wages and salaries rose by 22 per cent in 1973/74, about twice as quickly as in the previous financial year. This was a result both of faster growth in employment and higher earnings. Increases flowing from the 1973 National Wage Case, and the second part of the Metal Trades Industries Agreement, at the end of 1972/73, together with high levels of overtime, boosted earnings in the first quarter of 1973/74. Earnings grew a little less quickly through the middle of the financial year. However, the $15 per week increase in the new Metal Trades Industries Agreement in April was matched by equivalent or in many cases greater increases in other major awards. At the same time an average increase in award wages of about $4 per week flowed from the National Wage Case decision in May. These wage increases pushed average earnings up very sharply towards the end of the year, with more effects to follow in early 1974/75. The acceleration in earnings, together with the cut-back in productivity growth mentioned earlier, saw labour costs per unit of output rise in 1973/74 at more than double the rate of the previous twelve months.
The gross operating surplus of private non-farm companies expanded a little faster in 1973/74 than in the previous twelve months. However with non-farm output also growing more quickly, there was only a slight increase in the rate of growth of profits per unit of output in 1973/74. The gross operating surplus of public enterprises fell in 1973/74. However measures taken in the 1973 Budget increased the rate of growth of net indirect taxes quite substantially.
The terms of trade moved further in Australia's favour in 1973/74, but with a fairly sharp decline towards the end of the year the overall improvement was considerably smaller than in the previous twelve months. Export prices on average rose at about the same rate as in 1972/73. The rise in average returns to exporters of rural commodities in 1973/74 did not match the very rapid increase of the previous twelve months, but this was roughly offset by faster growth in average prices of non-rural goods, particularly non-ferrous metals. Currency realignments acted to limit the domestic impact of the rise in prices of imported goods for part of 1973/74, though by the June quarter import prices were reflecting clearly the accelerating rises in prices overseas. As well as making a direct contribution to restraining inflation, the currency appreciations, and the tariff cuts, by inducing extra imports and promoting more efficient allocation of productive resources, can be expected to exercise a longer term restraining influence on domestically generated price increases.
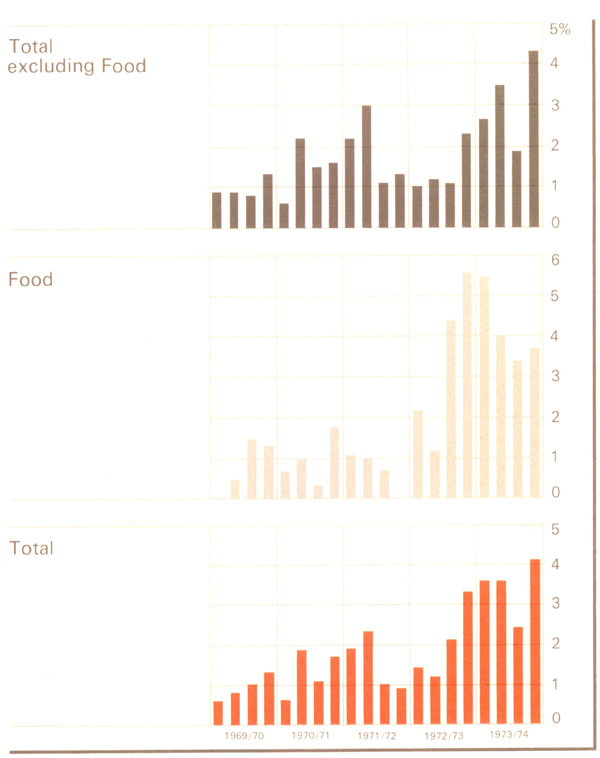
The rate of growth of prices of domestically consumed goods and services, despite the retarding effect of the measures taken through the balance of payments, and the operations of the newly established Prices Justification Tribunal, accelerated sharply in 1973/74. The Consumer Price Index rose by 14.4 per cent between the June quarters of 1973 and 1974, compared with an increase of 8.2 per cent over the preceding twelve months. Food prices continued to grow strongly and in 1973/74 rose by 17.6 per cent, compared with 14.0 per cent in 1972/73. This accounted for over one-third of the rise in the total index; meat prices in turn accounted for almost half the rise in food prices. Rises in a wide range of non-food prices accelerated during 1973/74; for the year as a whole non-food prices rose by 13.0 per cent compared with 6.0 per cent last financial year. In the three months to December more than a quarter of the rise in the non-food index (or a little over one-sixth of the rise in the total index) reflected taxation measures in the August Budget.
12 Consumer Price Index
QUARTERLY PERCENTAGE CHANGE
Financial Developments
Private sector expenditures were moderately in excess of incomes in 1973/74, in contrast to the very large net surplus of incomes in the previous twelve months. There was a fairly substantial increase in Australia's net indebtedness to the rest of the world in 1973/74, while the net financial deficit of the public sector was a little over half the size of that recorded in 1972/73.
A number of policy initiatives had resulted in the financial climate becoming less easy towards the end of 1972/73. However most financial aggregates continued to expand rapidly in early 1973/74. To restrain the contribution of the banking system to the growth in aggregate demand and prices, the Statutory Reserve Deposit ratio of the major trading banks was increased by 2 percentage points (offset to the extent of 0.6 percentage points transferred to banks' Term and Farm Development Loan Fund Accounts) during August. Trading banks were asked to reduce appreciably their rates of new lending, and savings banks were asked to limit their lending for housing.
However activity remained at an excessive level and the rate of growth of prices continued to accelerate. Price increases both at home and abroad were eroding the restrictive stance of stabilisation policy. Rapid growth in overseas prices was reducing the effectiveness of the currency appreciations and the 25 per cent across-the-board tariff cut which had been made in July; domestic price rises were increasing the attractiveness of real, as compared with financial, assets. Although the July loan had attracted considerable funds, there was a tendency for yields in short term markets to move upwards and some expectations emerged of further rises in rates. The August Budget seemed likely to add considerably to pressures on domestic resources as the year progressed.
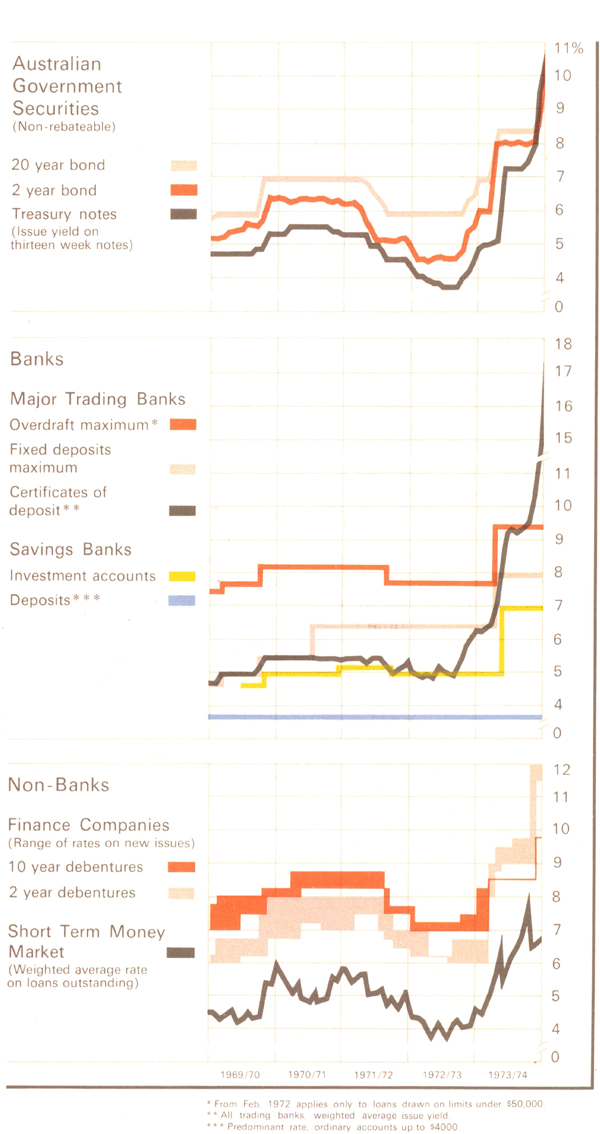
In these circumstances it was important for the rate of growth of financial aggregates to be restrained, and for yields on government securities to be fully competitive. With foreign exchange reserves high, it was also possible and useful for exchange rate policy to be brought to bear on the situation. Accordingly, on 9 September the Australian dollar was appreciated 5 per cent, and the Reserve Bank took action to press sales of government securities. A higher pattern of yields on government securities emerged, with increases of about 2 percentage points on short bonds and 1.5 percentage points (to 8.5 per cent) on the longest maturities. Trading and savings bank interest rates were adjusted following the rises in bond and other market rates, and with the higher government security yields the October loan was well supported, especially at the longer end. The issue of Treasury notes, which was suspended for a time, recommenced on 5 October with yields a little over 2 percentage points higher than in early September.
Within the prime objective of limiting the growth of liquidity and money supply as a means of helping to curb inflation, there was an effort to shield some home owners and home buyers from the full impact of the new measures by seeking to limit the rise in interest rates on housing loans made by banks and permanent building societies. However, it became apparent that attempts to use interest rate policy to protect the positions of selected groups (in this case, buyers of homes of moderate cost) can be to a considerable degree ineffective and even perverse; more direct means of safeguarding the welfare of groups judged to be under-privileged are probably more effective. The distortion of the market mechanism involved in restricting interest rates paid and/or charged to levels below those required to meet the market in general involves reduced efficiency, and can quickly become counter-productive.
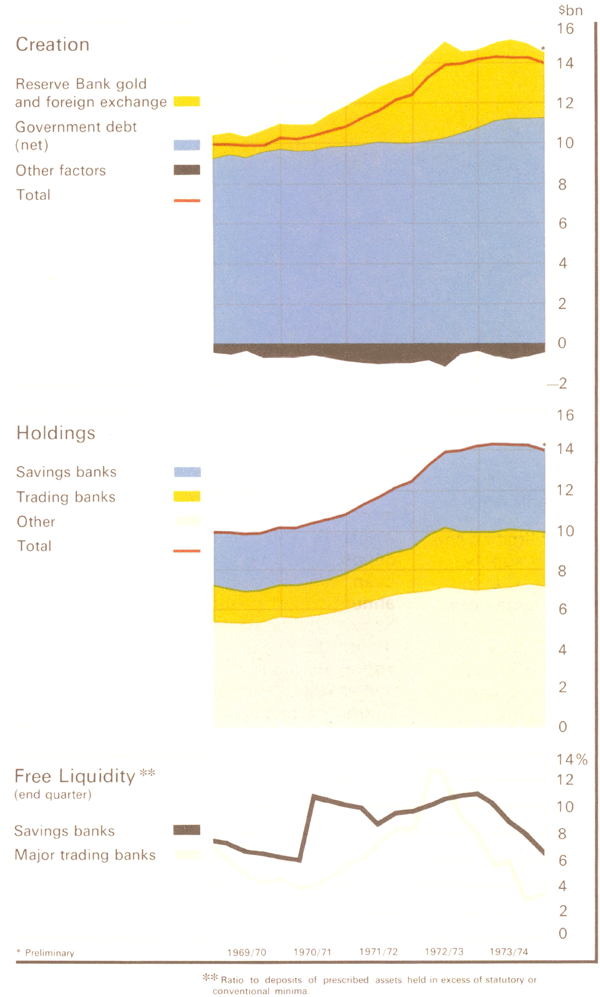
Growth in the liquidity of the private sector had been comparatively restrained in early 1973/74. In the main this had reflected the closing off of avenues of overseas finance which in previous years had been the source of a considerable volume of funds. Liquidity growth remained subdued following the September measures. Additionally the duration of the seasonal run-up in liquidity was limited by the introduction of the first step in new arrangements designed to spread the payment of company taxes more evenly throughout the year. This slower growth in private sector liquidity affected the banking system more than non-bank groups. In seasonally adjusted terms the LGS ratio of the major trading banks fell from August through October, but showed some increase towards the end of the December quarter. Savings banks' holdings of LGS assets, after growing fairly slowly in the September quarter, fell from October through January.
Other financial aggregates grew much more slowly following the September measures. The sum of cash and current deposits with trading banks, which had been rising at a seasonally adjusted annual rate of about 20 per cent in the September quarter, fell during the three months to December. Growth in the aggregate money supply, including term and savings deposits, did not drop so sharply as trading banks, making use of newly modified arrangements, used certificates of deposit to compete vigorously for funds. The growth of trading bank advances slowed by more than 50 per cent in the three months to December; savings bank advances outstanding for housing, although a little slower to react, also grew less quickly. New lending by trading and savings banks was reduced during these months. The net inflow of funds to permanent building societies, which had increased in July and August following earlier dips, fell again.
Financial conditions tightened very sharply in the second half of the year. Rapidly rising imports led to a sharply expanding current account deficit in the balance of payments, and high 1972/73 money incomes produced a much larger flow of provisional and company taxes to the Government. Money supply narrowly defined fell slightly in the March quarter and contracted again in the three months to June. The seasonal rundown in private sector liquidity, about 30 per cent greater than in the same period of 1972/73, was a very heavy one; the fall was particularly marked early in the June quarter. Trading bank liquidity fell sharply from December onwards, and by the end of the financial year some banks had borrowed from the Reserve Bank to maintain their ratios of LGS assets to deposits above the 18 per cent conventional minimum. The drain on trading bank funds was to some extent eased by releases of funds from banks' Statutory Reserve Deposit Accounts. Savings banks' LGS assets fell sharply after the February/March period. Banks, by use of certificates of deposit and bill finance, were in 1973/74 better able than in earlier years to spread liquidity constraints to other parts of the finance sector, and with banks competing actively for short term funds, liquidity pressures spread quickly. Growth of trading bank advances was rapid in the March quarter and was still comparatively high in the three months to June. This growth in advances was in part caused by fuller use by borrowers of their existing overdraft limits. Savings banks' non-housing advances rose strongly until April, partly reflecting the transmission of pressures being felt by trading banks.
13 LGS Assets
AT END OF QUARTER SEASONALLY ADJUSTED
The much sharper than usual tightening of liquidity brought about very large rises in interest rates in private short term markets during the June quarter, and some pressure on bond yields. To help meet its spending commitments the private sector made use of approvals to borrow overseas dating from before the restriction of borrowings introduced in 1972. In one or two cases fresh approvals to borrow were secured and exercised, and borrowers met the requirement to deposit part of the proceeds with the Reserve Bank. In the main, however, payments for imports and tax commitments were met by the private sector from its resources within Australia.
This necessitated an exchange of official paper for cash, which the Reserve Bank facilitated by purchasing a substantial volume of short term government securities; however with monetary policy restrictive, and an underlying rising trend in private interest rates, the Bank reduced its buying prices for this paper. Through April and early May yields on short bonds edged up by about 0.5 per cent; prices of Treasury notes were also lowered successively. These increases only partly mirrored the very sharp upswing in private sector short term interest rates.
In the June quarter holdings of government paper by banks and the non-bank private sector fell by about $800 million, and a little over $350 million, respectively. In view of the tight liquidity situation and the continuing rise in private sector interest rates, the Treasurer announced that no loan would be offered in May, and that the $346 million of securities maturing in that month would be redeemed. Not a great deal of additional liquidity flowed from the redemptions as about 85 per cent of the maturing securities were already in official hands. From the end of May the Reserve Bank, as an additional measure designed to ease slightly the very tight liquidity position, bought from official money market dealers small quantities of short commercial bills which had been accepted by banks.
As the year drew to a close pressures on resources were still high and a severe wage/price spiral was under way, supported by strengthening expectations of further price rises. Although financial conditions were very tight and, with the growing balance of payments deficit, seemed likely to remain relatively constrained in 1974/75, an early return to more moderate growth in prices did not seem in prospect. Under these circumstances, it was appropriate to continue to press the restrictive stance of monetary policy, and the Reserve Bank further reduced its buying prices for government securities in late May and June. Yields on short term government paper increased by a further 2.5 percentage points to 11.0 per cent, while yields on long bonds rose by 1.0 percentage points to 9.5 per cent during the same period. This new yield pattern was confirmed with the announcement on 8 July 1974 of the terms of the government loan to be made in that month. Officially administered trading and savings bank interest rates were increased in the main by 2.0 percentage points from 9 July 1974.
To avoid a financial stringency during the seasonal liquidity trough which went beyond the needs of policy, two reductions, each of 0.75 percentage points, were made in the SRD ratio of the major trading banks in mid June. It was made known that these funds could be subject to recall when the seasonal upswing in liquidity commenced. The deposit requirement on foreign borrowings was also reduced in late June, but the effects of this are yet to be seen. By the end of the year financial markets were a little easier and some private short term interest rates had turned down. Major trading bank liquidity benefited to a degree from the replenishment of the Term and Farm Development Loan Fund Accounts in early July 1974. The replenishment enabled banks to refinance some term and farm development loans which had been financed from their own LGS assets. In mid July there were two further reductions of 0.9 and 0.5 percentage points respectively in the SRD ratio; these releases of funds only partially offset the continuing drain on liquidity being experienced by the banks, and did not represent any easing of monetary policy.
The additional monetary measures taken towards the end of the financial year were devised in the context of the Government's announcement in early June of action to restrain official spending in the coming year, and increases in public enterprise charges. The intention was for these measures to lead to an easing of pressures on resources; expectations of continued rapid price rises could take longer to dissipate.
14 Interest Rates
Public Sector Finance
The Budget brought down in August 1973 provided for a rise in total expenditure of 18.9 per cent and in total receipts of 20.6 per cent. About 17 percentage points of the rise in receipts was forecast to flow automatically from the impact of unchanged tax scales on higher incomes and prices. In the event a larger than predicted rise in incomes led to an over-run of receipts well above the over-run of expenditure, and the deficit for the year at $293 million, was less than half as large as in 1972/73. The 1972/73 deficit had been of course the largest for many years. The amount to be financed domestically in 1973/74 totalled $296 million, also less than half as much as in the previous financial year.
The seasonal deficit in the Government's transactions in the early months of the fiscal year expanded much more quickly than in 1972/73. Because of changes designed to spread payment of company taxes more evenly throughout the year, the deficit ended earlier. The spreading of the hitherto increasingly uneven flow of payments to the Government will make the community's management of its finances less of a switchback, and will also make for more steadiness in the application of monetary policies. The Government's seasonal domestic borrowing requirement reached its peak at the end of December, a month earlier than usual, at a figure of $1,867 million. Net sales of bonds, and a rundown of cash balances with the Reserve Bank, each provided about 40 per cent of the finance needed by the Government during the seasonal upswing; the remainder came from net issues of Treasury notes. About two-thirds of the funded debt issued during the seasonal upswing was taken up by the banking system, mostly by the major trading banks; the Reserve Bank sold a net $113 million of bonds to the private sector during this period. With sales of Treasury notes comparatively subdued, government balances with the Reserve Bank were reduced by $779 million in the July/December period.
The sharper than usual seasonal rise in the Government's deficit in the first half of 1973/74 was followed by a notably sharp rundown in the final six months of the year. Net funded debt on issue rose a little further in the December/June period. However private sector holdings of bonds fell by about $840 million during this six months; most of these securities were acquired by the Reserve Bank. Treasury notes on issue also fell sharply during the liquidity rundown; over the year as a whole there was a net fall of $38 million in the outstanding level of these claims. Government cash balances with the Reserve Bank rose very sharply in the second half of the year, bringing the net rise over the year as a whole to $481 million.
Loan raisings by local and semi-government authorities in 1973/74—roughly $700 million gross—were not a great deal higher than in the previous financial year. The maximum rates approved by the Loan Council for public and private issues by local and semi-government authorities retained margins of 0.3 percentage points and 0.4 percentage points respectively above the long term rate on Australian Government securities for most of 1973/74. In June, following the sharp rises in market yields on government securities, the Loan Council fixed higher rates for local and semi-government raisings; rates were further adjusted in conjunction with the yields determined for the Australian Government's July loan.
Private Financial Markets
As previously noted, the private sector recorded a moderate net financial deficit in 1973/74. As usual, incomes of private finance groups exceeded expenditures, but in contrast to 1972/73 this was outweighed by the net deficit of private non-finance groups.
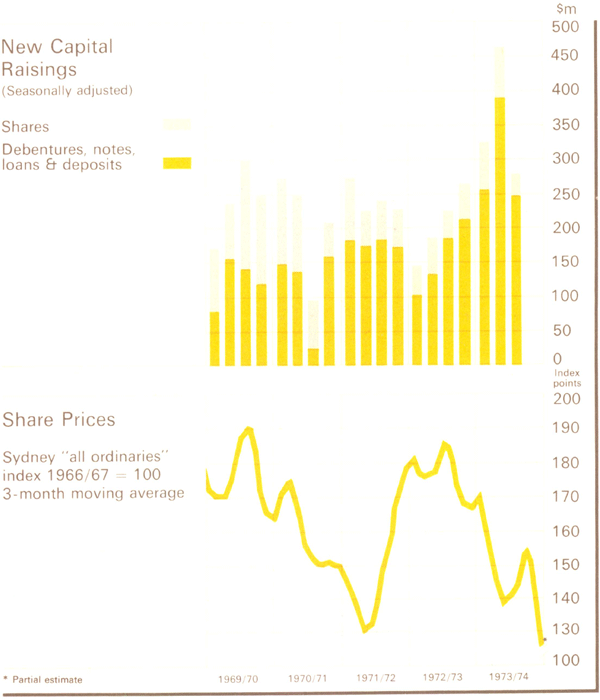
With the switch from overseas to domestic sources of finance, and the growth in private capital spending, there was a very sharp increase in new money raised on the domestic capital market in the first half of 1973/74; in the March quarter however new raisings returned to more normal levels. Much of the increase in new money raised took the form of short term (less than twelve months) debentures, notes, loans and deposits, by hire purchase and other companies engaged in financing; issues of share capital were also up a little. There was considerable activity in intercompany and bill markets as liquidity tightened during the financial year. Interest rates rose very sharply, especially in the June quarter when funds became extremely scarce. In most markets inverse yield curves were established, suggesting the judgment that in the longer term interest rates and/or inflation would come down. Interest rates on one to two year debentures offered by the major finance companies ranged from 5.5 per cent to 7.5 per cent at the beginning of 1973/74; at the end of the year the range was 11.0 per cent to 12.0 per cent. In contrast, rates for ten year debentures rose less sharply from a range of 7.0/8.25 per cent to 9.75 per cent over the same period, though this end of the market was very thin. The weighted average rate on loans with the official short term money market rose to over 8.0 per cent during April but subsequently fell as dealers competed less actively for funds. Rates on inter-company call money, in contrast to those on loans to dealers, rose very sharply to high levels; rates on bank bills rose still more sharply. Share prices declined substantially during 1973/74 as yields on financial claims rose and asset values were reduced; the downturn was particularly sharp in late May/early June. During the twelve months the Sydney index of ordinary share prices fell by almost 30 per cent.
The tight financial conditions saw intermediaries competing very vigorously indeed for funds in 1973/74, particularly towards the end of the year and at the short end of the market. The rate of growth of private sector deposits with banks slowed sharply during the year as interest rate structures for fixed deposits and ordinary savings accounts became progressively less competitive. Certificates of deposit, following the removal of the maximum interest rate restrictions, became the main source of bank deposit growth; in June 1974 certificates of deposit outstanding represented 10 per cent of total bank deposits, compared with 2 per cent a year earlier.
15 Private Capital Market
Growth in the volume of funds in short term markets also slowed during the twelve months. The operations of authorised dealers, merchant banks and other participants in these markets were especially affected by the vigorous competition for funds over the closing stages of the year. In particular, loans to authorised dealers fell very sharply. Finance companies concentrated more on attracting shorter term funds and continued to expand strongly through the early part of the year, though they also experienced difficulties in maintaining the desired growth in their balance sheets in later months. The net intake of funds by permanent building societies in 1973/74 was about 28 per cent lower than in the previous twelve months.
Financial Intermediation
In 1973/74 the Australian Government brought forward legislation providing for the direct regulation of a wide range of financial intermediaries other than banks. The proposed legislation aimed at supplementing the information available to the authorities on the activities of non-bank intermediaries, and at providing the possibility of applying direct controls for economic management purposes to a range of financial institutions other than banks. In the banking field, of course, a good deal has been achieved through consultation and without the direct exercise of statutory powers contained in the Banking Act, and the proposed legislation made provision for consultation on matters to be included in Regulations made under it. Parliament was dissolved before the legislation was passed, but a similar Bill completed its passage through the new Parliament in early August 1974.
From the point of view of economic management, powers of regulation over financial intermediaries provide a supplement to market-oriented monetary policy. In this role, direct regulation of non-bank intermediaries can be of value when applied in those areas of financing presenting specific short run difficulties for economic management, or in those circumstances when problems arise which delay the transmission of monetary policy. Of course, direct controls involve economic costs which can become substantial if the controls are used intensively and over long periods; these costs are to be weighed against expected benefits in decisions about the use of direct controls. Experience with the regulation of banking in Australia has provided instances of both the costs and benefits of direct regulation. The new legislation widens the scope of both potential costs and benefits.
The claims issued by financial institutions form the major group of financial assets held by the private sector. The following sections look at some of the activities of the major groups of intermediaries.
Trading banks
Private non-bank holdings of trading bank deposits rose by about 18 per cent in 1973/74, a good deal less rapidly than in the previous twelve months. Almost half the 1973/74 increase was in the first three months of the year. Certificates of deposit provided the growth element in trading bank deposits over the year. In September the ceiling of 6.5 per cent on interest rates on certificates of deposit was removed, and the maximum term extended from two years to four years. The response was quite spectacular; average issue yields on these claims rose quickly from just over 6 per cent to between 9.0 per cent and 9.5 per cent, and by the March quarter the rise in certificates of deposit outstanding averaged around $300 million a month; the amount on issue rose by about 470 per cent over the year. Most new issues were for terms of less than six months, and as these claims began to fall due for renewal, growth in outstandings tapered. By end May, when banks were heavily pressed for funds, average yields on short term certificates of deposit approached 20 per cent for a short period. Subsequently yields fell, and at the end of the year were averaging around 16 per cent; yields fell further in July. A good deal of the growth in certificates of deposit was at the expense of banks' existing holdings of other deposits. The maximum rate on fixed deposits was raised from 6.5 per cent to 8 per cent in September, but this increase did not match the growth in rates on competing assets, especially in the tight monetary situation which developed in the final months of the financial year; in July 1974 the maximum rate on fixed deposits was raised further to 10 per cent. Current deposits with trading banks tended to decline after the September 1973 quarter.
New lending by major trading banks was under some constraint from the outset of 1973/74. It was announced on 6 July that monetary policy was being directed further towards restraint, and a request to banks to achieve an appreciably lower level of new lending received added emphasis from the tightening of bank liquidity. New overdraft lending approvals, after peaking in July 1973, fell quite sharply over the remainder of the year, apart from a brief up-turn in March and April. The reductions in new approvals during the year reflected in lending to all categories of borrowers, with agriculture and manufacturing the two groups least affected.
In July 1973 it was announced that banks' Term and Farm Development Loan Funds would be replenished by $62 million and $41 million respectively to enable finance from these funds to continue to be available to support longer term loans to industry, commerce and rural producers. A good deal of these replenishments were used to cover term and farm development loans previously approved and drawn, and balances in the Farm Development Loan Fund Account in particular soon returned to quite low levels. New term lending was at rather higher rates for most of 1973/74 than in the previous 12 months; in the main this reflected much larger amounts re-financed through the Australian Resources Development Bank. The rate of new farm development lending declined fairly steadily through the first half of the year, but showed little net change in the final six months. In July 1974 it was announced that banks' Term and Farm Development Loan Funds would be further replenished by $73 million and $36 million respectively.
16 Major Trading Banks
SEASONALLY ADJUSTED
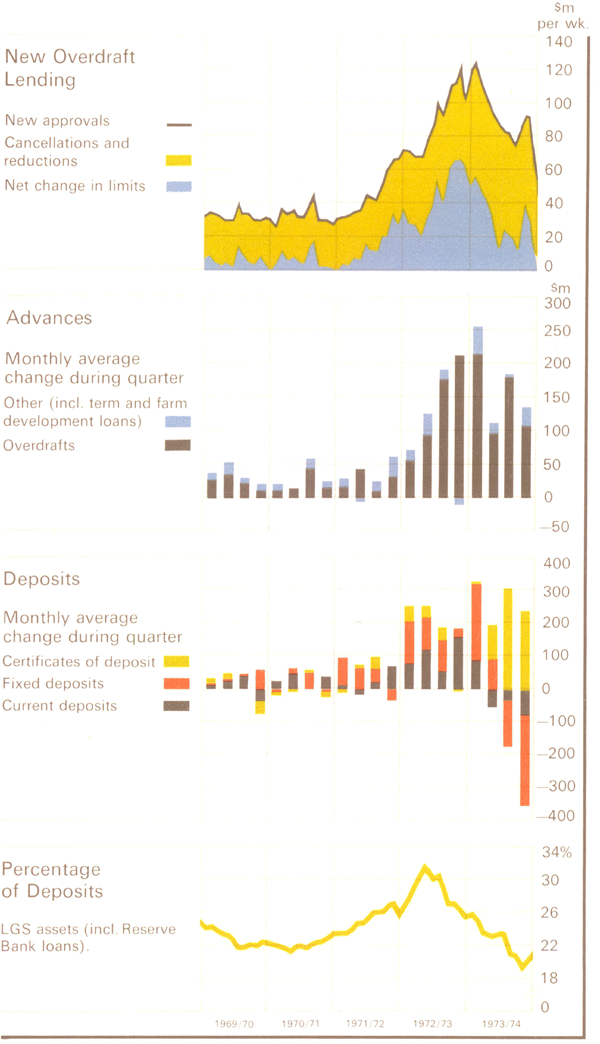
Prior to the September measures growth in overdraft advances of the major trading banks was accelerating; subsequently the growth rate declined fairly sharply, although there was an upsurge in the March quarter. Over the year as a whole overdraft advances rose by about 35 per cent, following an increase approaching 40 per cent in the previous twelve months. Lower rates of new lending and higher levels of cancellations and reductions kept the growth in overdraft limits outstanding well below that of advances in 1973/74; the proportion of limits drawn reached very high levels. Growth in term loans outstanding picked up in the middle of 1973/74 but farm development loans outstanding rose more slowly as the year progressed. Advances of trading banks other than the major banks grew at about the same rate in 1973/74 as in the previous financial year.
On 17 September 1973 the maximum overdraft rate, which applies only to loans drawn under limits of less than $50,000, was raised from 7.75 per cent to 9.5 per cent. Most other bank lending rates, including those on term and farm development loans, rose to broadly the same extent. At the same time, in view of the buoyant state of the economy, requests to banks to offer concessional rates on several categories of loans such as those to exporters and rural producers were withdrawn; banks subsequently reviewed these rates in the light of the circumstances surrounding individual borrowings. As discussed on page 28 trading banks agreed to limit to 1 per cent the rise in interest rates on loans for dwellings of moderate value occupied by a borrower who owned no other dwelling. On 9 July 1974, following the sharp rises in yields on government securities and other market rates, the maximum overdraft rate was raised by a further 2.0 percentage points to 11.5 per cent. Other trading bank rates were adjusted accordingly.
Major trading bank liquidity had fallen fairly sharply towards the end of 1972/73. In August/September of 1973/74 banks' free liquidity was reduced by the calls to Statutory Reserve Deposit Accounts and the proportion of the replenishment of the Term and Farm Development Loan Funds which came from banks' own LGS assets. After a temporary rise in November/December, bank liquidity showed a further very sharp fall, and by the end of the financial year several banks had been obliged to take Reserve Bank loans to maintain their LGS assets above the conventional minimum of 18 per cent of deposits. The reductions in the SRD ratio in June and July offset part only of the heavy drain of funds experienced by banks.
Savings banks
Savings bank deposits had risen very strongly for most of 1972/73. Strong growth in these claims continued into early 1973/74. On 1 October, following the general increases in bond yields, the maximum interest rate on depositors' balances was raised from 5 per cent to 7 per cent. The general pattern of the change by the savings banks was a rise from 5 per cent to 7 per cent in the rate on investment accounts; an increase from 4.25 per cent to 6 per cent for balances over $4,000 in ordinary accounts; and no change in rates on other balances in ordinary accounts. Following these changes investment accounts grew strongly for a time, but balances in ordinary accounts fell as rates on them were not fully competitive. In March, the limits on the maximum amounts in ordinary and investment accounts on which interest could be paid were removed, and the three months' notice requirement for withdrawals from investment accounts was replaced with a requirement of one month's notice subject to a minimum term of three months. Early in the new year the transfer of interest-sensitive funds to other forms of investment apparently slowed and total deposits grew rather more quickly for a time. However this improvement generally was not sustained. Savings bank deposits became progressively less attractive, and for the full year rose by 9 per cent, less than half as strongly as in the very buoyant previous financial year. At the same time as the increase in trading bank rates in July 1974, the maximum interest rate on savings banks' deposit accounts was raised to 9 per cent. Savings banks increased interest rates on investment accounts, but generally left rates on ordinary accounts unchanged.
Savings banks had approved a record amount of new lending for housing in 1972/73, and their rates of new lending rose further in the early part of 1973/74. In view of the clearly over-stretched position of the housing industry, savings banks were asked towards the end of August to limit their total housing loan approvals in the half year to December to not more than twice the total in the June 1973 quarter; lending in the June quarter had been very high. The fall in lending subsequent to this request was such that further specific ceilings did not need to be set in the second half of the financial year. On 1 October the maximum interest rate payable on savings bank loans of less than $50,000 was raised to 9.5 per cent. In parallel with the arrangements reached with trading banks, savings banks agreed to limit the rise in rates on the majority of their housing loans to 1 per cent (i.e. from 7 per cent or less to 8 per cent or less); larger increases were confined to loans of more than customary size or where the circumstances of the borrower clearly justified it. The savings banks agreed to extend the terms of loans if borrowers wished, so that repayment instalments would be unchanged.
Lending approvals for housing by savings banks were considerably lower from September onwards, though for the full year approvals still slightly exceeded the 1972/73 total. The rise of about 20 per cent in housing loans outstanding exceeded the rate of growth of deposits, and the requirement that savings banks subject to the Banking Act hold at least 60 per cent of depositors' balances in defined liquid assets and public securities appeared to constrain new lending for housing by some banks. On 9 July 1974 the maximum interest rate payable on savings bank loans of less than $50,000 was raised further to 11.5 per cent, subject to the rate on any class of loan, or any individual loan, not increasing by more than 2.0 percentage points. Savings banks did not propose generally to increase repayment instalments on existing loans.
17 Savings Banks
The composition of savings banks' other investments altered during the year. Fixed deposits with the Reserve Bank fell by a net $273 million and holdings of Treasury notes and deposits with the official money market also dropped; these declines were only partly offset by rises in holdings of bonds and deposits with trading banks. Holdings of local and semi-government securities rose by $393 million, about 35 per cent more than in 1972/73. Loans other than for housing rose by $203 million, over three times the previous year's increase.
Other
Reflecting an increase in demand for finance for developmental projects, new lending commitments by the Australian Resources Development Bank rose strongly in 1973/74. Loan drawings did not rise as fast as new commitments, resulting in a strong increase over the year in undrawn approvals. Loans outstanding rose by about 20 per cent during the year to $351 million. The bank raised little in the way of funds from the public in the first half of the year, and the rise in loans outstanding during this period was financed mainly from liquid assets. In the second half of the year the bank made an issue of transferable deposits, and obtained additional funds from bridging loans by shareholder banks and the Reserve Bank. Interest rates were raised to take account of movements in other market rates. Marginal reductions were made in overseas borrowings outstanding.
The net intake of funds by permanent building societies fell to low levels towards the end of 1972/73, especially in New South Wales. Borrowing rates in several states were raised in July and August and the net intake of funds rose in those two months. When interest rates were increased generally in September, permanent building societies, in conjunction with trading and savings banks, agreed that the increase in interest rates on the great majority of their housing loans would not exceed 1 per cent. This subdued rise in lending rates was matched by correspondingly low increases in rates on funds invested with them. The net inflow of funds to the permanent building societies, which had fallen sharply in September, remained low in following months. Societies in Victoria and in Queensland reacted by raising interest rates in December; in New
South Wales and Western Australia, borrowing rates were raised in April/early May. Towards the end of the financial year funds became increasingly difficult to attract, and in June most societies announced further substantial increases in their borrowing and lending interest rates. In aggregate, the net inflow of funds to societies in 1973/74 was about 28 per cent less than in the previous twelve months.
The substantially lower intake of funds by permanent building societies, and their desire to build up liquidity, reflected in correspondingly reduced rates of new lending in 1973/74. After running at very high levels, new lending approvals had fallen sharply in the June quarter of 1973. New lending increased a little in the three months to September, but subsequently fell again and remained subdued over the balance of the financial year. Approvals in 1973/74 as a whole were about 35 per cent lower than in the previous twelve months. Mortgages outstanding rose less quickly than net withdrawable funds during the greater part of the year, with consequent improvements in the liquid positions of most societies.
Finance companies grew strongly in 1973/74, especially in the first half of the year. By introducing new types of claims, and offering competitive interest rates, these intermediaries managed to attract a considerable volume of funds for much of the period, though the terms for which funds were sought shortened appreciably. The amount of new finance provided by these companies dropped a little around the middle of the financial year. However with collections and other liquidations also lower, growth in balances outstanding, although diminishing as the year progressed, remained quite high. Over the year as a whole balances outstanding seem likely to have risen by about 35 per cent, a considerably larger increase than in other recent years. Balances outstanding on instalment credit for retail sales fell, reflecting particularly a decline in the numbers of motor vehicles financed; on the other hand sharply increased amounts of finance had been provided for housing and land development towards the end of 1972/73 and this continued well into 1973/74.
Authorised dealers in the short term money market had reduced the size and shortened the maturity structure of their portfolios during 1972/73, in anticipation of higher interest rates. However the September increases, following on earlier rises, were greater than had been expected and dealers made heavy losses in the first half of 1973/74. Conditions were also difficult for them in the second half of the year. Following the rise in interest rates in September, and the consequent reduction in the value of their shareholders' funds, aggregate borrowing limits of dealers—which are set by a gearing ratio—were reduced sharply. Dealers were cautious during the remainder of 1973/74 and the level of loans accepted was well below the permitted maximum. The earlier payment of part of the year's company tax put the market under some pressure around the end of January. Subsequently, in the very sharp tightening in liquidity in the June quarter the dealers, for much of the period, partly withdrew from active competition for funds and further ran down their portfolios.
Dealers' aggregate portfolios were reduced by about $400 million during 1973/74, and the term structure of their security holdings shortened. The proportion of bank and other non-government paper in dealers' portfolios rose towards the end of the year, reflecting both the sharp rundown in holdings of government securities and attempts to minimise the losses being made through the very high interest rates needed to attract loans from clients. Dealers were permitted to expand the composition of their portfolios a little during the year to include a modest holding of claims issued by the Australian Industry Development Corporation maturing within five years.
The average interest rate on loans from clients, which had been running at a little under 5 per cent towards the end of 1972/73, reached over 8 per cent in April, but subsequently fell to just under 7 per cent in June.
Life insurance companies have benefited for many years from concessional taxation arrangements in a number of areas. Some of these concessions have recently been removed, and the value of others has been eroded over time. Inflation has reduced the attractiveness of the traditional claims offered by these companies. There appeared to be some decline in the number of new policies issued by these companies during the year, and slower growth in premium income.
Because of the fairly predictable nature of their income flows, life companies generally plan, and enter into, lending and investment commitments well in advance, relying on liquid reserves to meet sudden and unexpected demands on them for funds. As the year progressed and liquidity conditions tightened life companies came under increasing pressure from various sources to supply funds. For some companies this pressure was so sustained that they found it necessary to modify their planned investment programmes. Over the year as a whole, the proportion of total assets of life companies held in mortgage loans continued to decline, and holdings of fixed assets gained further in relative importance.
Balance sheets of pastoral finance companies expanded moderately in 1973/74, though not nearly as quickly as in the previous twelve months. Rural advances outstanding of this group of institutions, which had shown only a small net rise during 1972/73, grew much more strongly in 1973/74. Non-rural advances also expanded, while holdings of government securities were reduced fairly sharply.