Reserve Bank of Australia Annual Report – 1974 Australia and the World Economy
Conditions Overseas
The economic environment overseas, which can so profoundly affect affairs in Australia, was marked in 1973/74 by substantial developments, some in individual countries and some, such as the oil crisis, more general in character.
Prices and Activity
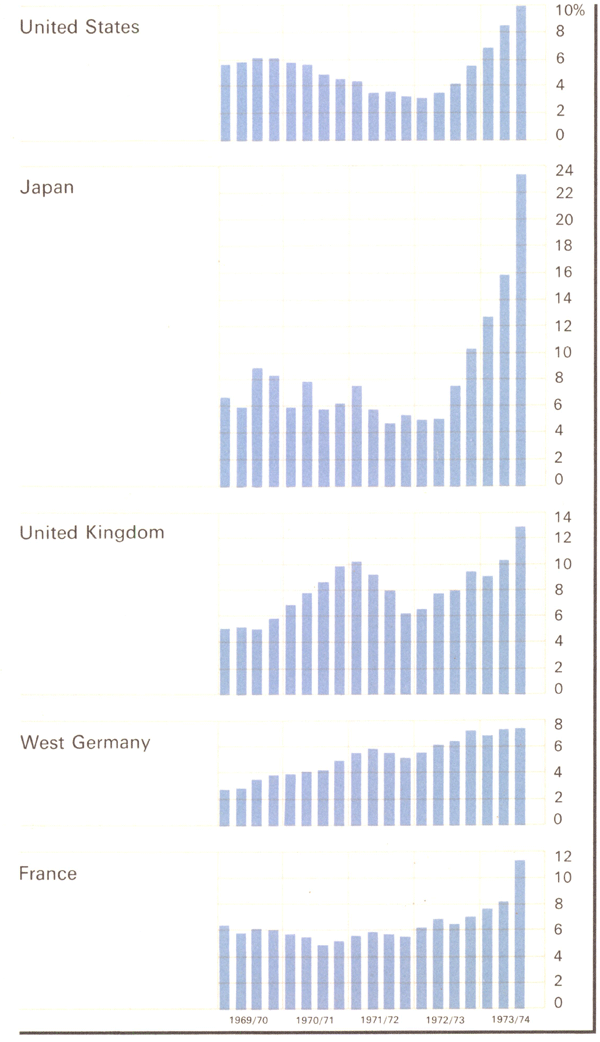
In the major industrial countries the annual rate of growth of prices averaged about 10 per cent in the first half of 1973/74, and probably approached 15 per cent in the final six months of the year. Much of the accelerated inflation in all but the final part of the year reflected higher commodity prices. About half the rise in consumer prices in the first half of the year was accounted for by higher food prices alone. The very sharp rise in oil prices came at a time when many other commodity prices were close to, or in some cases past, their peaks. The rise in commodity prices flowed from a mixture of supply shortages, the sharp and simultaneous upswing in demand in virtually all the OECD countries, speculation, and exploitation of the monopoly positions of the oil exporting countries.
In the latter part of 1973/74 pressures on resources eased and numerous commodity prices turned downward. However, a good many countries suffered from severe wage/price spirals during this period. Price rises meant that despite very large increases in money wages, real incomes had risen less rapidly than expected, and pressure for larger wage and salary rises built up. With lower rates of growth of output per worker accompanying the downturn in the activity cycle, accelerating growth in unit labour costs was widespread. These higher unit costs quickly reflected in additional price increases. Japan and some western European countries suffered particularly from accelerating wage rises.
Most countries took additional steps to curb inflation during 1973/74. Many used direct price controls of various kinds. In the United States a freeze on most prices imposed in mid June 1973 was replaced in following months by further controls under the Economic Stabilisation Act; in turn these were removed on an industry by industry basis from the beginning of 1974. In the United Kingdom the wage controls introduced from 7 November under the Counter Inflation Act were considerably loosened with the change of government in March 1974, although the prices provisions received some strengthening. In Japan, where price rises have been more severe than in other major countries, anti-inflationary measures adopted in early 1973/74 included the reinforcement of previously introduced controls on prices of a range of major commodities; after being stiffened considerably in March 1974 these price controls were relaxed for some major commodities in the June quarter. Although the changes during the year in the kinds of measures used make interpretation of the data a little difficult, direct controls seem to have had at best only temporary effects on rates of inflation in the countries in which they were tried.
Growth in real output fell sharply in most major economies in the final months of 1972/73, and remained subdued in the first half of 1973/74. In spite of these slowdowns and a range of policies directed towards limiting demand, capacity use remained generally high and supply constraints were still evident in a number of areas. Cut-backs in oil supplies affected industrial production in a number of developed countries in the third quarter of 1973/74. In the United Kingdom, where for a time the constraints imposed by oil shortages were overshadowed by severe industrial unrest, the United States and Japan, real output fell substantially in this period. Although there were signs of a slightly better performance in the final three months of the year, for 1973/74 as a whole real output in the OECD countries may have risen by less than 2 per cent, compared with about 7 per cent in the previous twelve months.
3 Consumer Prices Overseas
PERCENTAGE CHANGE OVER SAME QUARTER OF PREVIOUS YEAR
While the United Kingdom and Italy were the only major industrial countries in which unemployment fell to any marked degree in the first half of 1973/74, labour markets in most countries were generally fairly tight through this period. However the second half of 1973/74 saw unemployment increasing in most of the developed countries. Noteworthy, in the light of recent trends in Australia, were the comparatively high rates of unemployment which existed in most overseas countries even at the peak of the 1972/73 upswing. Suggested explanations include the pace of the upswing which revealed some structural imbalances in labour markets and, with investment at low levels and unable to respond sufficiently quickly, disclosed supply bottle-necks sooner than in previous cycles. Rapidly rising labour costs provided an incentive to economise on labour, and investment may have been directed increasingly towards capital-intensive processes. In North America and France strong growth in the labour force helped to limit the drop in unemployment. Additionally, increased participation rates tended to lessen the difficulties caused by having a member of a family unemployed, while changes in social security arrangements may have increased the incentive for people to register as unemployed.
Finance
The closing months of 1972/73 saw increasingly restrictive monetary policies adopted in all the major western economies. Interest rates were increased sharply and a variety of measures taken to restrict the availability of bank credit. Generally, these measures were not supported by complementary fiscal policies and proved insufficient to bring down rates of growth of money supply.
There were further increases, often to extremely high levels, in interest rates in most countries in early 1973/74; these increases were accompanied usually by additional measures to limit the availability of credit. In a number of countries interest rates moved to something of a plateau as the middle of the year approached, although there were further rises in Japan and the United Kingdom. Although some countries managed to bring money supply more under control in the first half of 1973/74, overall these attempts at restraint were not conspicuously successful.
4 Interest Rate Comparisons
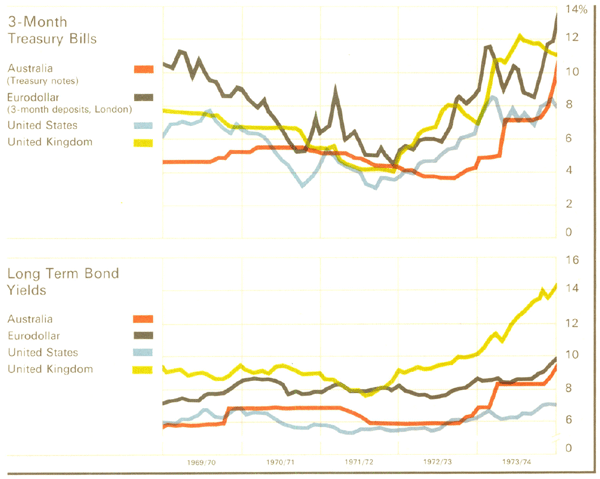
Financial conditions eased temporarily in most major centres early in the second half of 1973/74, and interest rates were generally lower. In some cases this reflected concern over activity and employment, compounded by fears about the impact of higher oil prices, outweighing worries about the rate of growth of prices. Euro-dollar and other offshore rates tended to be brought into closer alignment with the lower rates then ruling in the United States by the ending in that country of the interest equalisation tax and the lifting of restrictions on direct investment overseas. In March financial conditions tightened again with interest rates rising sharply in most countries. The strengthening of many currencies against the United States dollar through this period reinforced the restrictive effects of these higher rates. Monetary policies remained generally restrictive into the June quarter although in the United Kingdom and one or two other western European countries conditions became a little easier. Money supply grew less quickly in a number of major countries early in the second half of 1973/74, though rates of growth were often still relatively high.
The Oil Crisis
In October 1973 the major oil exporters raised posted oil prices by 70 per cent, and in December a further rise of nearly 130 per cent was announced. This brought posted prices to over four times the level ruling twelve months earlier. In early 1974 there were signs that some oil importers had over-reacted a little; prices at petroleum auctions tended to level out and in some cases fell slightly. In March a meeting of oil exporters in Tripoli announced a three month freeze on posted prices; a further meeting of exporters in Quito in June announced continuation of the price freeze for an additional three months. At the same time most exporting countries decided to increase their royalty charges by 2 per cent, which probably will feed through to prices paid by consumers.
The rise in oil prices in October was accompanied by cuts in production and a total embargo on supplies to certain countries. However the production cuts were eased late in December, and in mid March the embargo on supplies to the United States was substantially relaxed. Some suppliers also removed the residual limitations on production at that time. Most countries took steps to conserve oil as the full implications of these developments became clear. The embargo tended to affect Europe, Japan and the developing countries more than the United States, at which the restrictions were primarily directed. Australia, which is currently about two-thirds self-sufficient in crude oil supplies, and which has good alternative sources of energy, was much less affected.
Discussions took place in various forums on ways of alleviating the financial difficulties of these developments in oil markets. Approaches were made to the major oil exporting countries to recycle their currency surpluses to help finance importers' deficits. Work proceeded on a scheme to establish a new lending facility through the International Monetary Fund, financed largely with borrowings from governments of the major oil exporting countries, which would help to finance balance of payment difficulties resulting from the higher oil prices. Special steps were envisaged to aid developing countries.
The higher prices are unlikely to change substantially the demand for oil products, at least in the short term, although in the longer run there could be some significant switching to alternative energy sources. Some forecasts put the improvement in the balance of payments of the oil producers, and the consequent deterioration in the position of other countries, at around US$50 billion in calendar 1974. Dealing with this situation is especially difficult. The comparatively small economies of the oil producers are unlikely to be able to absorb sufficient quantities of goods and services to make possible an early restoration of current account equilibria. Oil importers, in the absence of surplus foreign exchange reserves, may therefore seek to balance their external accounts through restrictive domestic policies, or by borrowing. There may of course be limits to the extent to which oil producers are prepared to recycle funds even to advanced countries. To the extent that the relative increase in oil prices holds, oil exporters have gained a greater command over the world's resources and will be looking to exchange their newfound wealth for real assets. The degree to which any country is obliged to adjust to this new situation is in part dependent on its command of energy resources. For some countries adjustments may mean, initially at least, reduced real living standards.
International Trade and Payments
Trade of the OECD countries grew at an annual rate of a little over 40 per cent, in terms of current United States dollars, in the last half of 1972/73. A similar growth rate was maintained in early 1973/74 though by the December quarter there were signs of a slowdown. In volume terms growth through this period may have been a little under 15 per cent per annum. Slower expansion in the industrial countries, and difficulties with Middle East oil, seem to have reduced growth in the volume of trade to an annual rate of not much more than 5 per cent in the second half of 1973/74. Exports of agricultural products were affected to a degree by controls previously introduced in several countries, though some of these restrictions were removed early in the financial year; agricultural trade also was affected towards the end of 1973/74 by improved Russian and Chinese harvests and a lack of shipping.
Other than oil prices, commodity prices generally rose very sharply in 1972/73 and early 1973/74 but the rate of growth slowed a little by the December quarter. Prices of non-edible agricultural produce rose somewhat more quickly than those of foodstuffs over much of this period; prices of minerals and metals, which had fallen a little in the first half of 1972/73, soared in the following twelve months. Factors behind the upswing were the strong growth in many economies in much of 1972/73, supply constraints, and lower stock levels. Additionally currency uncertainties produced some speculative hedging. Under the impact of slower growth in demand for foodstuffs and industrial materials, and an improved supply situation, most commodity prices other than oil decreased in the final months of 1973/74. Although changes in currency values and relative price movements in different countries tended to blur the outcome, the rise in commodity prices acted towards improving the terms of trade of most primary producing countries, other than some relatively heavy importers of oil; countries which import mainly primary products and export largely manufactures suffered accordingly.
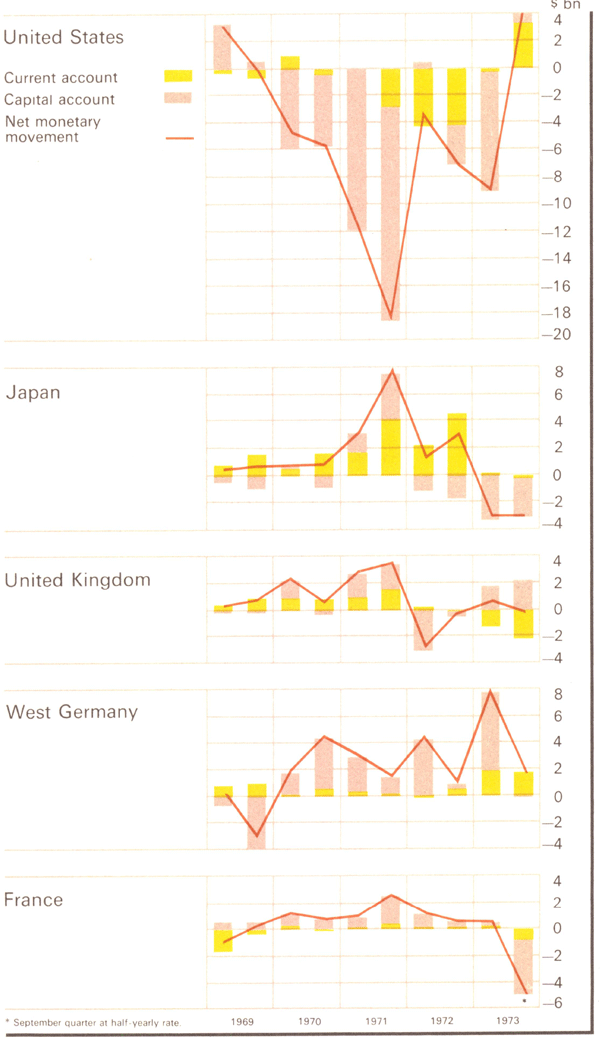
There were some very large shifts in the pattern of international trade and payments in 1973/74; the changed positions of the United States and Japan were particularly conspicuous. Reflecting in both cases sharply altered trading positions, the United States' current account showed increasing surpluses, and that of Japan increasing deficits, in the first half of 1973/74. The counterpart to the growing United States' surplus was a deterioration in the current accounts of most other industrial countries although West Germany, despite the earlier appreciations of the Deutschemark, also generated very large positive balances. Some of the United States' surplus also reflected in trade with China and the Soviet Union, and in the current accounts of developing countries other than oil producers. Independent price movements make it difficult to isolate the extent to which exchange rate changes improved the position of the United States. Indications are that while exchange rate changes substantially affect flows of goods and services across national boundaries, these effects are felt after fairly long lags. Thus these changes may have stemmed partly from the currency realignments of 1971, which took some eighteen months to work through the system. In the second half of the year the oil crisis led to sharp deteriorations in the current account positions of most countries, while raising the prospect of much larger current account surpluses for the oil producers.
Changes in capital flows acted to improve further the external account of the United States, and worsen that of Japan, in early 1973/74. In the United States in this period there was the first substantial net inflow of private long term capital for several years; in Japan a sharply increased net outflow of long term capital in the last half of 1972/73 continued into 1973/74. With the change in its balance of payments and developments in exchange markets, the United States in late January removed the interest equalisation tax and eliminated controls on private lending overseas. Japan, on the other hand, strengthened controls on capital outflows and relaxed those on inflows. The United Kingdom at the end of March also tightened controls on investment abroad. Most other western European countries made it easier for capital to enter. In the case of the more developed countries at least, capital flows, including some substantial government borrowings, acted towards offsetting the adverse current account movements produced in the second half of the year by the oil crisis.
5 Balance of Payments Overseas
With the improvement in the United States balance of payments, and later that country's relatively favourable position as an energy source, exchange markets appeared to view the dollar as undervalued. The United States dollar strengthened quite markedly after mid July 1973, and with this movement the Australian dollar, which was appreciated 5 per cent from its former gold parity on 9 September, effectively rose further through its link with the United States currency.
The United States dollar peaked in January 1974 and subsequently declined on a trade-weighted basis by a little over 11 percentage points to a low point in early May. This weakening followed the relaxation of controls on capital flows in the United States and Europe, the (albeit temporary) downturn in interest rates in the United States, and the emergence of a feeling that the reaction to the oil crisis had been a little over-pessimistic and that consequently the United States was not likely to be as advantaged as had been thought. A number of major currencies strengthened considerably against the dollar early in the second half of 1973/74. The two-tier foreign exchange system in France was abolished following that country's withdrawal in January from the joint European float; Italy also abandoned its dual rate system. The external values of most major currencies showed comparatively little net change in the final months of the financial year.
| End of | United Kingdom | West Germany | France(1) | Switzerland | Japan | Australia |
|---|---|---|---|---|---|---|
| POUND | MARK | FRANC | FRANC | YEN | DOLLAR | |
| 1971/72 | ||||||
| Dec. | +6.4 | +12.0 | +6.3 | +11.6 | +14.5 | +6.3 |
| June | +1.8 | +16.2 | +11.1 | +16.8 | +20.0 | +6.3 |
| 1972/73 | ||||||
| Dec. | −2.2 | +14.3 | +8.6 | +16.1 | +19.2 | +13.8 |
| June | +7.6 | +51.0 | +34.1 | +49.6 | +36.8 | +26.5 |
| 1973/74 | ||||||
| Sep. | +0.6 | +51.6 | +30.8 | +44.4 | +35.6 | +32.8 |
| Dec. | −3.2 | +35.4 | +18.2 | +34.6 | +28.5 | +32.8 |
| Mar. | −0.3 | +44.8 | +16.4 | +45.2 | +30.5 | +32.8 |
| June | −0.4 | +43.7 | +15.2 | +46.1 | +26.8 | +32.8 |
| * United States dollar devalued in effect by 7.9 per cent on 19/12/71 and
10 per cent on 12/2/73. (1) Commercial franc until the abolition of the two-tier market in March 1974. |
||||||
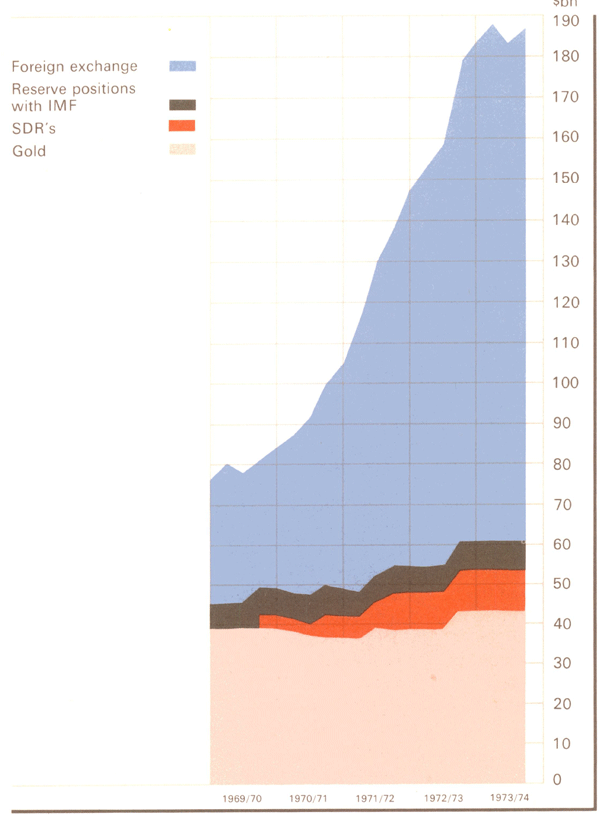
The growth in world holdings of reserves was comparatively low in the final quarter of 1972/73. In the September quarter of 1973/74 reserves increased a little further but this was cancelled by an equivalent fall in the three months to December, as United States liabilities dropped in line with the improvement in that country's balance of payments. World reserves again expanded slightly in the March quarter of 1974.
With the improved performance of the United States dollar the free market price of gold fell in early 1973/74. On 13 November it was announced that the United States and six other signatories had terminated the Washington Agreement of March 1968 which had established the two-tier market for gold. This further depressed gold prices on the London market. However in succeeding months the weakening dollar, uncertainties about the world economic outlook, and soaring base metal prices saw gold reach a new record price in London of US$180 an ounce by early April. Gold prices subsequently fluctuated sharply and there was a fairly marked net retreat from this price over the balance of the financial year.
International Monetary Reform
Discussions on reforming the international monetary system began in September 1972 with the formation of the “Committee of Twenty”, a committee of the Board of Governors of the International Monetary Fund. In September 1973, the Committee published a first “Outline of Reform” which was considered by the annual meeting of the Fund in Nairobi; four new technical groups were established to deal with specific aspects of reform, and it was agreed that outstanding issues should be finalised by July 1974.
The rapid changes in the world economic situation, including widespread high rates of inflation and the effects of the sharp increases in oil prices, made it evident that a fully reformed system would take time to devise. The trend of discussions shifted to interim measures which could be implemented fairly quickly to cope with current and prospective world conditions; longer term issues were confined for the time being to the establishment of general principles.
6 World Holdings of International Reserves
AT END OF QUARTER
The Committee of Twenty concluded its work at a final meeting in Washington in June, and agreed on a programme of immediate action. A report on the Committee's work, together with a final “Outline of Reform”, was transmitted to the Board of Governors of the Fund. The programme of immediate action included acceptance of the view that the Special Drawing Right should be promoted as the basis of the international monetary system. The SDR will, for the interim, be valued in terms of a “basket” of 16 individual currencies, including the Australian dollar; initially it will carry a rate of interest of 5 per cent per annum. With a return to more stable rates of exchange unlikely in the near future, there was also agreement on guidelines to be followed by countries with floating exchange rates. These guidelines recognise situations where intervention to moderate market movements may be desirable, but are designed to avoid competitive devaluations and other exchange rate policies harmful to other member countries; they provide for general surveillance of intervention by the International Monetary Fund. Procedures in the Fund for the management of global liquidity are to be improved. A consensus was reached on the need to avoid controls on current account transactions for balance of payments purposes, and on capital flows instead of appropriate adjustment action. The Committee suggested members might voluntarily pledge not to introduce or intensify trade and other current account controls. A facility is to be established in the International Monetary Fund to assist members in meeting the initial impact of the increase in oil import costs.
There is to be further study of arrangements for gold in the light of the agreed objectives of reform. Also reserved for further study was the question of additional development assistance for less-developed countries, although an extended Fund facility is to be established to provide developing countries with longer term balance of payments finance. The Committee recommended the establishment of a joint Ministerial Committee of the Fund and World Bank to study the broader aspects of transferring real resources to developing countries.
A major recommendation of the Committee was for the formation of a new Council of Governors, with decision-making powers, to oversee the adjustment process and ensure that the work on reform is carried on. It is proposed that an interim Committee take over the work of the Committee of Twenty and serve until this Council can be established.
Australian Balance of Payments
Current Account
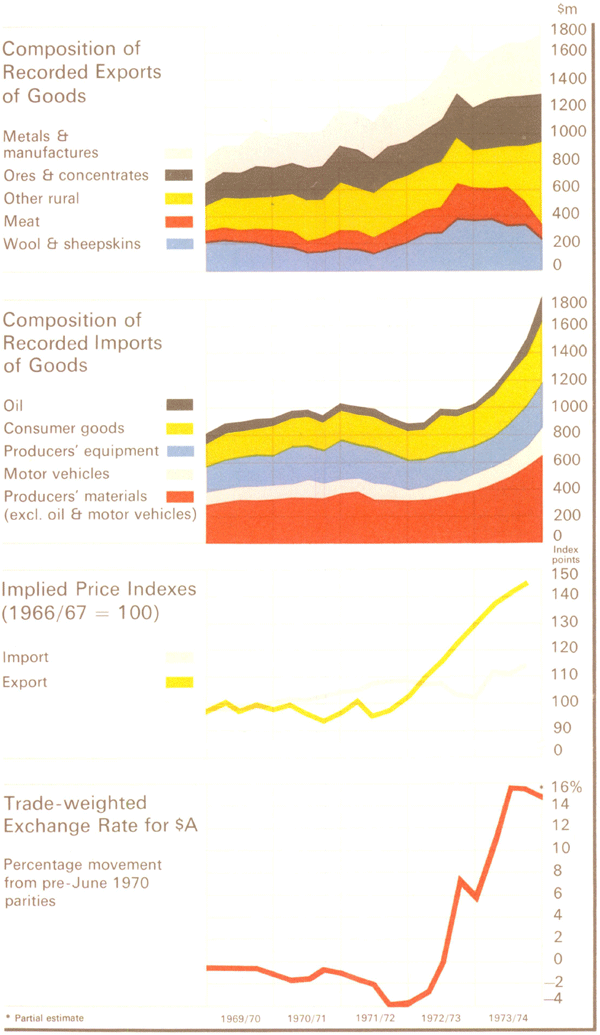
The high and rising prices and slower growth in activity which characterised most of the major developed economies in 1973/74 substantially influenced the pattern of Australia's trade during the year. The quantity of goods exported in 1973/74 was slightly lower than in the previous financial year; the rise of about 13 per cent to $6,760 million in the value of exports was more than accounted for by higher average prices overseas, particularly for rural produce. The volume of rural exports shipped in 1973/74 fell by almost 20 per cent but prices averaged about 30 per cent higher. Wool and meat export prices each came down by about one-third during the year but average prices of these two commodities were still higher than in 1972/73. Wheat prices rose very sharply through much of the year, but eased in the June quarter. World sugar prices virtually doubled after December, although there are lags before this will reflect fully in export returns. The value of non-rural exports of goods in aggregate rose by almost 20 per cent in 1973/74; quantities rose by less than 10 per cent with the balance accounted for by prices. Exports of manufactures rose considerably more slowly in value terms than in other recent years. Prices received for manufactures increased but quantities exported, particularly of motor vehicles, were lower.
Imports in 1973/74 were stimulated strongly by the increasing pressures on domestic supplies, as well as by the earlier relative appreciations of the Australian dollar, and the reductions in tariffs. The value of goods imported, at $5,740 million, was about 50 per cent higher than in the previous financial year; in quantity terms the rise was close to 40 per cent. Appreciation of the Australian dollar, and its subsequent upward movement in conjunction with the United States currency, steadied the domestic prices of imports in the second and third quarters of the financial year. Outside this period growth in import prices more fully reflected the inflationary conditions overseas.
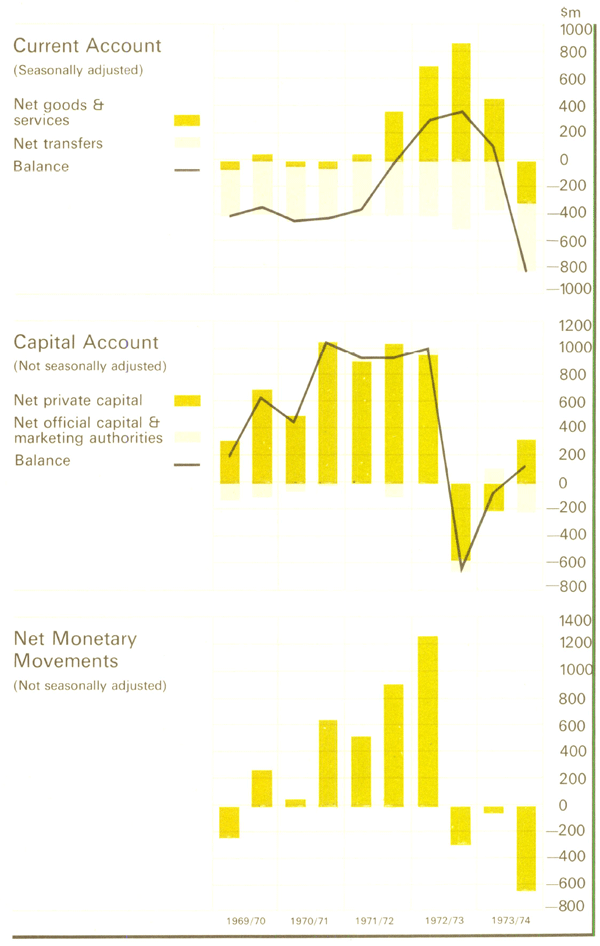
The surplus on visible trade in 1973/74 was $1,020 million, less than half that in 1972/73 but still the second highest recorded. In the three months to June however the trade account was in a roughly balanced position. There was a rise of about 40 per cent in the deficit in Australia's trade in services in 1973/74; this was largely due to rapid increases in transportation costs, reflecting both the large rise in the quantity of imports and higher freight rates. However, in contrast to previous years, net property and other transfer payments fell slightly. Property income credits rose substantially, and controls on foreign borrowings helped to limit the growth of property income debits. In total the deficit on invisible transactions came to about $1,730 million, some 14 per cent greater than in 1972/73. Overall, there was a negative balance on current account of about $700 million in 1973/74, in contrast to the surplus of $665 million in 1972/73. In the June quarter, the current account deficit was running at an annual rate of more than $2,000 million.
The Bank's operations in forward exchange underwent a marked change during 1973/74. Its net forward purchases of foreign exchange had increased towards the end of 1972/73, reaching a peak in June. Subsequently with the strengthening of the Australian dollar, forward covering by exporters, while still at relatively high levels, declined. In the second half of 1973/74 this falling trend continued, as traders reassessed the cost of forward cover against the risks of currency changes. Importers began to make greater use of the forward facility and the Bank's forward sales of foreign exchange increased.
At the end of May, the Bank reduced its basic selling discount from 4 per cent per annum to nil; the basic buying margin of 4 per cent per annum remained unchanged. At the same time, the Bank moved to limit the period within which forward cover could be arranged by traders. From 17 June, availability of forward cover in respect of an eligible transaction was limited to applications made within seven days of acquiring a coverable foreign currency risk relating to that transaction; previously cover could be written at any time such a risk existed. Demand for forward cover generally slackened after the new arrangements became effective. In contrast to the position at June 1973, when the Bank had heavy net commitments to buy foreign currency forward, at the end of June 1974 the Bank had considerable net sales of forward exchange outstanding.
7 Features of Overseas Trade
Capital Account
There was little overall net capital movement in 1973/74. Official capital transactions were roughly in balance, with the repayment of official loans previously raised overseas being offset by the arrival of military aircraft for which payment had been made in advance. Higher wheat sales on credit resulted in a moderate net capital outflow from marketing authority transactions. Net apparent private capital inflow totalled about $140 million in 1973/74, the smallest net inflow for two decades. There was a net apparent outflow of about $200 million in the first half of the year and a net apparent inflow approaching $350 million in the second half. Retained earnings of foreign companies rose sharply during the year. Exchange control data of inward capital movements suggest that some quite substantial net borrowings abroad in the June quarter may have produced a small net inflow of loan capital during the year as a whole. There was also a modest net inflow of funds other than borrowings, mainly in the month of June itself. On the other hand there appears to have been a fairly substantial increase in Australian investment overseas in 1973/74.
The pattern of private capital flows had altered radically in 1972/73, reflecting the changes made during that year in policy on overseas investment in Australia and the relative appreciations of the Australian dollar. There was a sharp rise in apparent private capital inflow in July, but this proved to be only temporary. The effective exchange rate for the Australian dollar moved up in August from its July low point, and on 9 September the Australian currency was appreciated 5 per cent as part of a general package of measures aimed at curbing the rate of growth of prices. With commodity prices high the balance of payments had remained strong, despite the previous relative currency appreciations and various exchange control measures. Reserves, excluding changes due to parity adjustments, had in fact risen a little in the months prior to September and were very high relative to likely needs. With supply shortages emerging domestically it was thought appropriate to seek to transfer some of these reserves into goods and services. At the same time, with a fixed exchange rate, rising prices overseas relative to those in Australia had tended to reduce the effective external value of the Australian dollar; in these circumstances appreciation was a means of limiting the international transmission of price rises to Australia.
8 Balance of Payments
The September measures were not followed by a sharp outflow of capital, such as there had been following the currency appreciations of 1972/73. There had been no prior build-up of capital inflow, and the prospect of tight liquidity probably gave an incentive to hold funds in Australia rather than repatriate them. In fact the increases in domestic interest rates made in conjunction with the appreciation, and the prospect of tight money, caused some people to re-assess their views on borrowing in Australia as opposed to borrowing abroad. Borrowing abroad for two years or less had been prohibited under arrangements introduced in 1972. Now questions were raised about the effectiveness, as a deterrent, of the 25 per cent deposit requirement on foreign borrowings for terms of more than two years which had been introduced in December of that year, and from 26 October 1973 the deposit requirement was increased to one-third.
On 29 October the Prime Minister outlined new guidelines on foreign investment in Australia at the Australia/Japan Ministerial Committee meeting in Tokyo. Although no general prohibition applied to foreign investment in Australia, it was the Government's firm policy to achieve the highest possible level of Australian ownership and control of local resources and industries. There was a particular objective of 100 per cent Australian ownership in some energy source industries. In addition to the sectors such as banking in which foreign investment has been traditionally restricted, foreign investment for the establishment of new life and general insurance companies, and non-bank financial intermediaries, was not generally favoured. As background to this point, the Government has a general wish to prevent increases in foreign ownership and control of existing financial institutions. Reference was also made by the Prime Minister to the statement by the Treasurer on 20 March 1973 which outlined a more restrictive attitude towards foreign investment in rural and urban real estate.
Subsequently, on 12 June 1974, the Prime Minister announced formation of a new advisory committee to complement the existing Committee on Foreign Takeovers established in 1972. The new committee will examine foreign investment proposals which come under notice through the exchange control mechanism and which do not involve the takeover of Australian businesses. Additionally, the new committee will bring forward proposals for the screening of foreign investment activities which do not come under the notice of the exchange control.
The Australian exchange rate on a trade-weighted basis strengthened further through the December quarter and peaked on 23 January. A small net outflow of private capital continued during this period, in part reflecting higher loan repayments. However from February onward there was a substantial net inflow, coinciding with the sharp tightening in domestic liquidity. Repatriation of capital fell sharply through these months and companies exercised some borrowing approvals granted prior to the changes made in policy on overseas loan raisings in 1972. In isolated cases borrowers sought new approvals to raise loans overseas, despite the requirement to deposit one-third of the proceeds with the Reserve Bank. On 25 June, with liquidity tight and likely to remain so for some time, the deposit requirement was reduced to the 25 per cent ruling prior to October 1973. At the end of the year funds lodged with the Reserve Bank under the variable deposit requirement totalled $9 million. The effective external value of the Australian dollar fell appreciably from its mid-January peak, reaching a trough in early May only a little above the level established by the September appreciation. There was a small net appreciation in the effective value of the Australian dollar in the final weeks of the year.
Investment abroad by Australian residents increased in 1973/74. Exchange control statistics indicate most of the increase was in direct, rather than portfolio, investment. Policy on portfolio investment abroad had been relaxed in September 1972. At that time it had been decided that exchange control applications for portfolio investment in tax havens generally would be subject to special consideration. On 25 October 1973 the Treasurer announced that further steps had been taken to combat the use of tax havens by Australian residents, and in December Section 39 of the Banking Act was amended to support these steps.
Monetary Movements and Reserves
Overall there was a deficit in Australia's balance of payments of about $680 million in 1973/74; this was the first negative balance since 1966/67. A small deficit in the first half of 1973/74 expanded sharply in following months, as the current account became increasingly negative. Most of the balance of payments deficit reflected in a fall in holdings of official reserves, but other foreign assets (mainly trading banks' net holdings of foreign exchange) also fell substantially.
The extent of the fall in Australia's international reserves during 1973/74 differs a little depending on whether holdings of foreign currency are valued at official or market rates of exchange. About $209 million of the fall at official parities resulted from the 5 per cent appreciation of the Australian dollar in September 1973. The slightly larger fall in 1973/74 at market rates mainly reflects the additional net strengthening of the Australian dollar in money markets during the year. The valuation adjustments to the Australian currency value of official reserve assets resulted in book losses to the Reserve Bank during the year, but did not affect domestic liquidity. At the end of 1973/74 the market value of Australia's holdings of official reserve assets was equivalent to about six months' imports, compared with about twelve months' imports a year earlier.
| 1972/73 | 1973/74 | ||||
|---|---|---|---|---|---|
| JUNE | SEP. | DEC. | MAR. | JUNE | |
| Gold | 220 | 210 | 209 | 210 | 210 |
| Special Drawing Rights with IMF | 200 | 190 | 190 | 190 | 150 |
| IMF Gold Tranche | 143 | 141 | 135 | 136 | 149 |
| U.S. Dollars | 2,028 | 1,954 | 1,994 | 1,823 | 1,806 |
| Sterling | 1,484 | 1,353 | 1,320 | 1,239 | 1,029 |
| Other Foreign Exchange | 255 | 241 | 243 | 293 | 328 |
| Total (Official Parities) | 4,331 | 4,090 | 4,091 | 3,892 | 3,673 |
| Adjustments for changes in | |||||
| – Market value of securities | +51 | +37 | +36 | +36 | +47 |
| – Market rates of foreign exchange | −134 | −195 | −256 | −178 | −160 |
| Total (Market Rates) | 4,248 | 3,932 | 3,871 | 3,750 | 3,560 |
| * Gold, SDR's and IMF gold tranche are converted to Australian dollars
on the basis of Australia's official parity with the IMF. The adjustment
in the basis of valuation from official parities to market rates involves
two main elements: (i) use of market valuations to calculate the foreign currency value of overseas securities (including accrued interest); in the calculation at official parities generally the lower of cost or face value has been used. (ii) use of market rates of exchange to convert the foreign exchange components. |
|||||
The Sterling Guarantee Agreement between the Australian and United Kingdom Governments was scheduled to end on 24 September 1973, but the United Kingdom offered to extend the guarantee, with minor modifications, to the end of March 1974. Australia complied with the arrangements and, as sterling weakened during that period against the United States dollar, received about £15.8 million compensation in May. The United Kingdom Government offered to continue to guarantee, with some further amendments to the arrangements, official sterling holdings until the end of 1974. The new scheme is based on the trade-weighted exchange rate for sterling, rather than the sterling/United States dollar rate. The minimum proportion of reserves countries need to hold in sterling in order to qualify under the new arrangements was reduced by 10 per cent.
There were further changes in the disposition of Australia's foreign exchange reserves in 1973/74. The proportion of reserves held in sterling fell, while that held in United States dollars continued to increase. The Bank also increased a little its holdings of assets denominated in several western European currencies and in Japanese yen. During June Australia used the equivalent of $41 million in Special Drawing Rights through the International Monetary Fund.