
Bulletin – August 2026 Australian Economy An Input-cost Decomposition of the Household Consumption Deflator

Abstract
Understanding the drivers of inflation is important for monetary policy. Focusing on the recent period of elevated inflation, this article examines how input costs (defined broadly as labour costs, business owner returns, dwelling rents and import prices), along with net taxes, have contributed to consumer price growth. Specifically, growth in the household consumption deflator is decomposed into contributions from each of these factors, extending an approach proposed by Hansen, Toscani and Zhou (2023). The decomposition shows that labour costs, business owner returns, dwelling rents and import prices have all contributed to elevated consumer price inflation since the COVID-19 pandemic, though their relative importance has varied over time.
Introduction
Inflation picked up sharply following the COVID-19 pandemic and has been above the RBA’s 2–3 per cent inflation target range for most of the period since then. Understanding the drivers of the increase in inflation is important for monetary policy because different drivers are likely to reflect different underlying economic forces, which can have implications for the appropriate monetary policy response. Strong growth in labour costs and/or business owner returns could be a signal that there is excess demand in the economy and that monetary policy tightening is needed to bring the economy back into balance. By contrast, other forms of price growth (e.g. import prices) could instead reflect supply shocks that central banks may be able to look through if they are expected to resolve quickly and inflation expectations remain anchored. Depending on the drivers, a given rate of inflation can therefore imply a different set of risks for the outlook.
A variety of approaches have been taken in previous RBA analysis to understand the drivers of inflation. For example, estimating statistical relationships between inflation and its theoretical determinants (Cassidy et al 2019), decomposing the relative contributions of supply and demand factors (Beckers, Hambur and Williams 2023), analysing businesses’ pricing behaviour (Fink and Hambur 2026; Hunter 2026) and assessing the role of specific components and/or sectors in aggregate outcomes (Plumb 2026; RBA 2026). This article adds another perspective, decomposing growth in the household consumption deflator – a measure of the prices paid by households for the goods and services they consume – into contributions from input costs. I use the term ‘input costs’ in this article to refer to the returns flowing to the factors of value-added production in the National Accounts, as well as the cost of imports. I use the approach in Hansen, Toscani and Zhou (2023), though I extend their methodology to incorporate dwelling rents.1 My analysis focuses on the period of elevated inflation since the COVID-19 pandemic.
For clarity, ‘business owner returns’ is used as a shorthand term for gross operating surplus (GOS) and gross mixed income (GMI) in the National Accounts. GOS includes both economic profit (i.e. the excess return to a business associated with factors such as market power or scarcity) and the return on capital used in production (i.e. the income required to compensate the owners of capital for the value generated by non-labour inputs used in production, depreciation, risk and the cost of financing investment). GMI captures the income earned by sole traders and small business owners, which conceptually includes both labour and capital income. As such, business owner returns can increase without businesses increasing their mark-up over marginal cost and may instead reflect other factors, such as that the cost of owning capital has risen.
Key findings
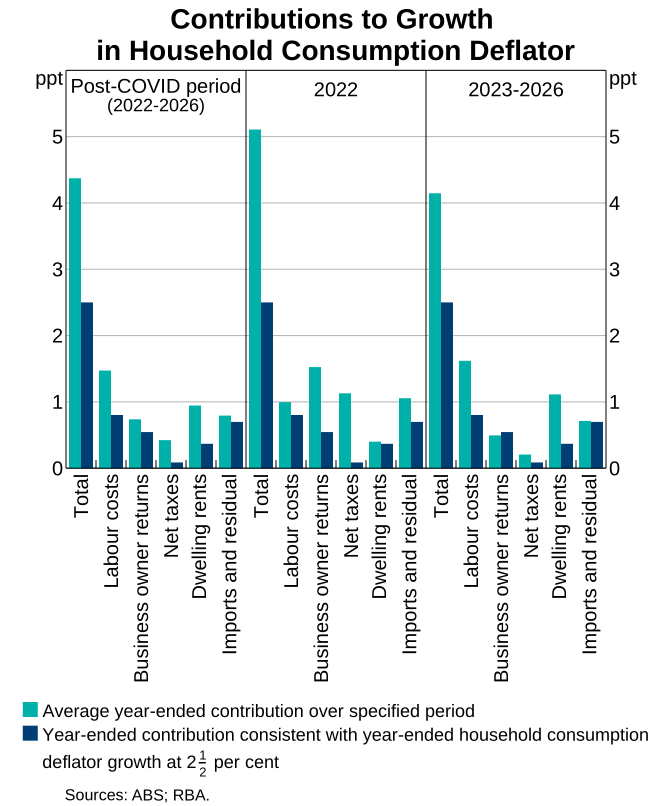
The decomposition in Graph 1 shows that from 2022 (when inflation picked up materially) to early 2026:
- All input costs contributed to growth in the household consumption deflator being above 2½ per cent.
- The relative size of the contribution from each input has varied over the period. Import prices and business owner returns accounted for a larger share of growth in the household consumption deflator immediately following the COVID-19 pandemic, with price pressures later shifting towards labour costs and dwelling rents.
- On average over the post-pandemic period, the contribution to overall price growth has been broadly based across inputs and relatively in line with its share in production.
What is the household consumption deflator?
The household consumption deflator is a broad measure of the prices households pay for the goods and services they consume within a given period. It is an implied price index derived by dividing the value of household consumption by the volume of household consumption. It is produced as part of the National Accounts, rather than as a standalone price index.
The household consumption deflator captures similar underlying trends in inflation to the more commonly cited Consumer Price Index (CPI), though there are some important differences between the two measures (ABS 2020) (Graph 2). The most significant differences are:
- The household consumption deflator reflects changes in both the prices of goods and services that households buy and the composition of those purchases, while the CPI reflects price changes only. The weights of different goods and services in the household consumption deflator vary each period in line with actual spending, while the weights in the CPI are only updated annually using recent spending patterns.
- The treatment of some goods and services across the two measures varies and the weights of common expenditure categories are generally not the same. The most significant difference is the treatment of owner-occupier housing costs. The household consumption deflator measures owner-occupier housing costs as the cost that a homeowner would pay if they rented their home (referred to as ‘imputed rents’), while the CPI captures the cost of constructing a new dwelling (referred to as ‘new dwelling purchases’).
- Net taxes are treated differently in the two measures, with most divergences driven by changes to government subsidies. The household consumption deflator is constructed using listed prices for goods and services that may not change with the introduction or removal of subsidies, while the CPI measures the out-of-pocket cost to a household of purchasing a particular good or service. For example, the introduction of government electricity bill rebates for households over recent years lowered measured electricity prices in the CPI as households paid less for the same quantity of electricity. But the rebates did not affect electricity costs in the household consumption deflator as the listed price of electricity did not change.
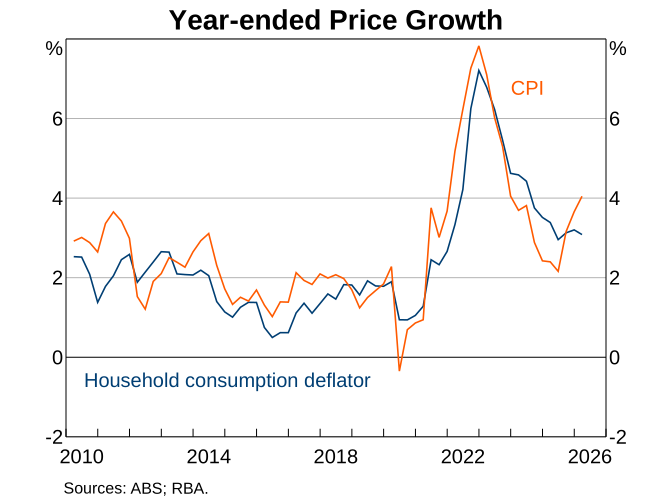
Growth in headline CPI was faster to pick up, faster to moderate, and peaked at a higher level than growth in the household consumption deflator during the recent period of elevated inflation. There are many reasons for this, but the different treatment of owner-occupier housing across the two measures was the most significant. Inflation in new dwelling purchases (i.e. the CPI measure of owner-occupier housing costs) grew at a much faster rate than imputed rents (i.e. the household consumption deflator measure of owner-occupier housing costs) between late 2021 and early 2023 and moderated more quickly from late 2023. Strong growth in fuel prices also contributed to the CPI growing more strongly than the household consumption deflator between late 2021 and mid-2022, as fuel has a larger weight in the CPI. More recently, the introduction and unwinding of government electricity bill rebates has contributed to volatility in the CPI but has had no effect on the household consumption deflator.
Decomposing the household consumption deflator
One way of thinking about the source of changes in consumer prices is to trace them back to the costs of the inputs used in producing consumption goods and services for households. At a broad level, there are four key input costs:
- labour costs
- business owner returns
- dwelling owner rental returns
- prices for imported inputs paid to overseas producers.
In addition, net taxes on the production and sale of goods and services affect the prices paid by consumers for those goods and services.
The extent to which each of these costs contribute to aggregate price growth depends on its role in the production process (Figure 1). Inputs that are used more intensively will have a larger effect on prices for a given change in their cost. Similarly, price changes in goods and services that account for a larger share of total household spending will have a greater influence on aggregate inflation.
In practice, the supply chains for the goods and services consumed by households are complex. A simple example is the production of a loaf of bread. While a bakery may produce and sell the final product, the bakery requires inputs from a range of other industries to operate, including agriculture (to supply wheat), utilities (to supply electricity), logistics (to transport goods from suppliers) and business services (to provide bookkeeping services). Different industries typically use different combinations of inputs as some goods and services require more capital to produce (e.g. electricity generation relies on a range of physical capital such as power stations), while others require more labour. Labour may also not be substitutable across industries and the balance of labour supply and labour demand may vary by industry such that labour costs may evolve differently across industries.
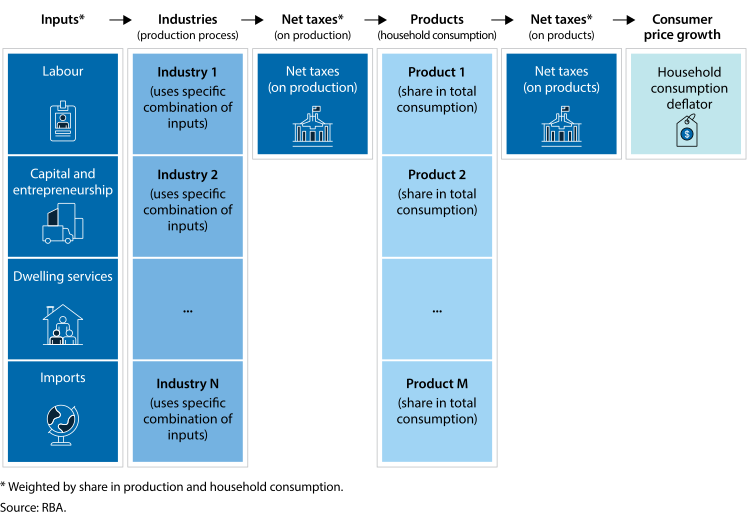
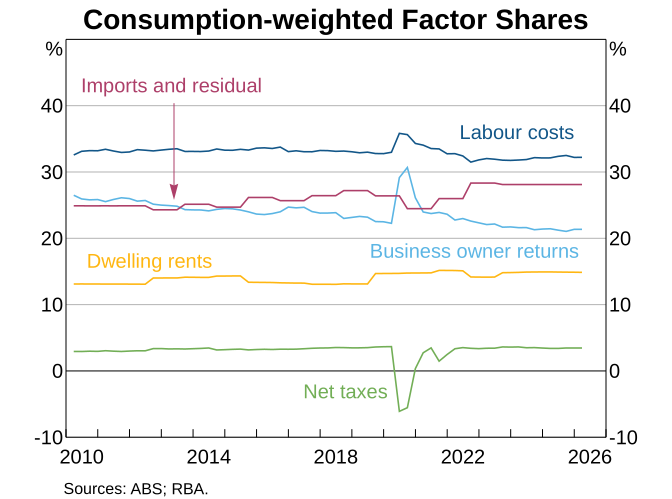
The decomposition presented in this article incorporates the features noted above by mapping changes in the costs of each production input at the industry level to growth in the household consumption deflator. These contributions are weighted to reflect both the importance of each input in production and the share of each good or service in household consumption. The weights are derived from the input-output tables from the Australian Bureau of Statistics and are known as the factor share of production for each input (Graph 3). Labour costs, business owner returns, dwelling rents and net taxes on production are included explicitly, while the remaining unexplained component (referred to as the ‘residual’) is assumed to primarily reflect import prices. Further mathematical detail is provided in Appendix A.
As in Hansen, Toscani and Zhou (2023), the weights used in my decomposition consider the role of intermediate inputs used through the entire supply chain, in addition to those used by the final seller. This is an important feature as it provides a more complete picture of where inflationary pressures are coming from, given that many products purchased by households are produced using inputs from a wide range of industries. As a result, industries that interface more directly with consumers (e.g. retail trade) receive a lower weight than in the case where only the contribution of the final seller is considered, while industries that primarily provide services to businesses receive a higher weight than otherwise. Imports also receive a greater weight when intermediate inputs are considered, as imported intermediate inputs play a significant role in domestic supply chains.
A limitation of my decomposition is that it provides descriptive evidence only. It shows how changes in different input costs and net taxes have contributed to growth in consumer prices over time, but does not shed light on why those input costs have changed. The causes of changes in input costs can matter for their ultimate impact on inflation; for example, as Davis et al (2026) argue in relation to businesses’ profit margins. Further, as noted above, business owner returns also capture the return on capital used in production and can increase without businesses increasing their mark-up over marginal cost.
Contributions since the COVID-19 pandemic
My decomposition shows that all input costs have made positive and, at times, large contributions to growth in the household consumption deflator since the COVID-19 pandemic (Graph 4). An important feature of growth in the household consumption deflator over this period is that the relative contributions of different inputs varied over time, with certain inputs playing a larger role in aggregate price growth at different points. Import prices and business owner returns picked up first following the COVID-19 pandemic, but price pressures from these sources eased from 2023 onwards. They were replaced by strong growth in labour costs and dwelling rents, consistent with tight conditions in labour and housing markets.2
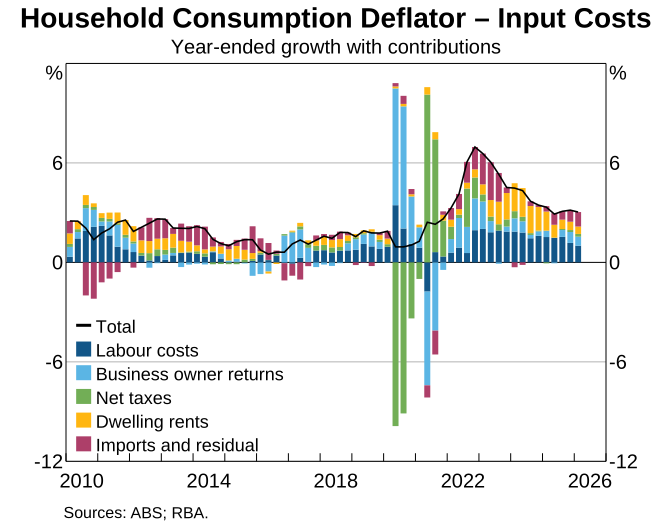
Nevertheless, some differences in the timing of input cost increases are to be expected as different costs exhibit different degrees of stickiness. On average over the period, growth in the household consumption deflator has been driven by a broad-based increase in the costs of all inputs. A more structured way of thinking about this is to compare actual contributions over recent years to the implied contributions in some hypothetical case. For example, when all input costs grow at the same rate, each input contributes to growth in the household consumption deflator at a rate proportional to its role in the production of goods and services for household consumption (i.e. its factor share).3 Importantly, this hypothetical is intended to be illustrative, rather than a realistic description of how input cost growth would be expected to evolve. All input costs growing at the same rate assumes that the economy is in equilibrium, which is rarely the case. Further, different input costs may respond to a given shock in distinct ways and this does not, in and of itself, indicate unusual behaviour. Factor shares can also change over time if the types of goods and services consumed by households shift or if cost growth in a particular input diverges from others for a period. For example, the factor share of business owner returns has fallen over time, largely driven by slower growth in GMI relative to other input costs.
Under this hypothetical, it is also possible to derive contributions from each input consistent with inflation at 2½ per cent, which is the midpoint of the RBA’s 2–3 per cent inflation target range. While the inflation target is defined relative to the CPI and not the household consumption deflator, Graph 2 shows that the two measures follow a similar trend. Graph 1 compares the decomposition of growth in the household consumption deflator to a hypothetical where the deflator – and each component input cost – grows at 2½ per cent. This example suggests that all input costs have contributed to the household consumption deflator growing above 2½ per cent. Further, growth in the various input costs has been distributed largely in line with shares in production with some small deviations. Dwelling rents, labour costs and net taxes made slightly larger contributions than would be implied by their production shares, while import prices and business owner returns have made slightly smaller contributions.
The initial increase in prices in 2022
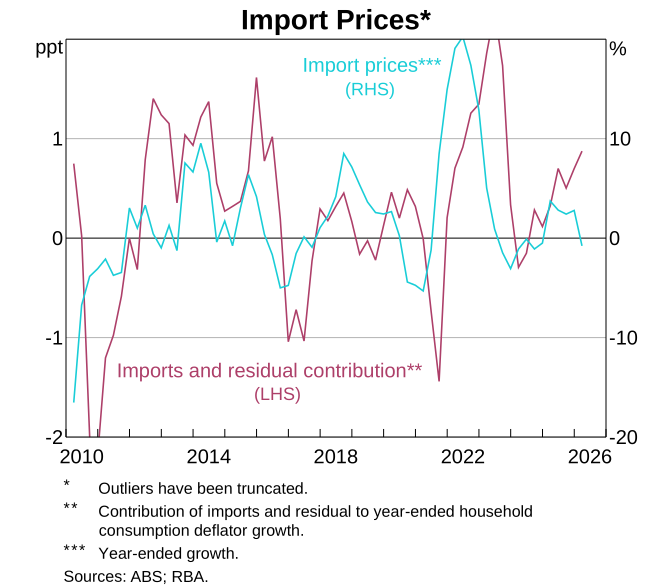
Inflation began to rise sharply from mid-to-late 2021. A significant portion of this initial increase in growth in the household consumption deflator falls into the residual of the decomposition. While the residual generally captures both import prices and sales taxes, its movement closely tracked growth in import prices over most of this period (Graph 5). The contribution from the residual picked up strongly from early 2022, coinciding with a sharp rise in global inflation, international supply chain disruptions and a depreciation of the Australian dollar. This finding is consistent with Beckers, Hambur and Williams (2023), who attribute a large share of the pick-up in CPI inflation in early 2022 to supply-side factors (which included a significant global component).
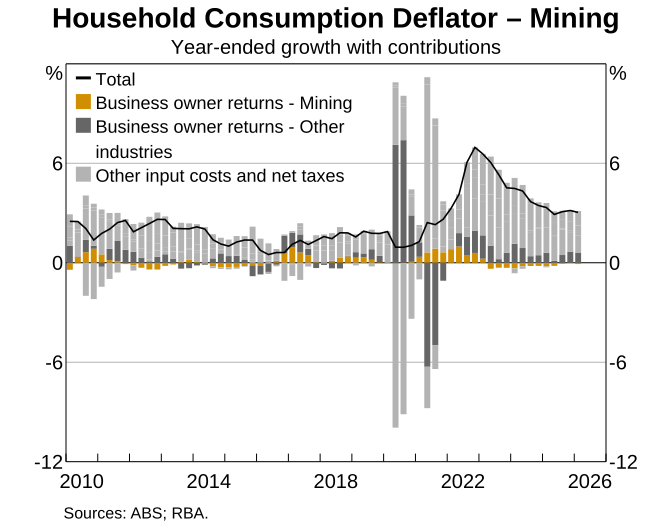
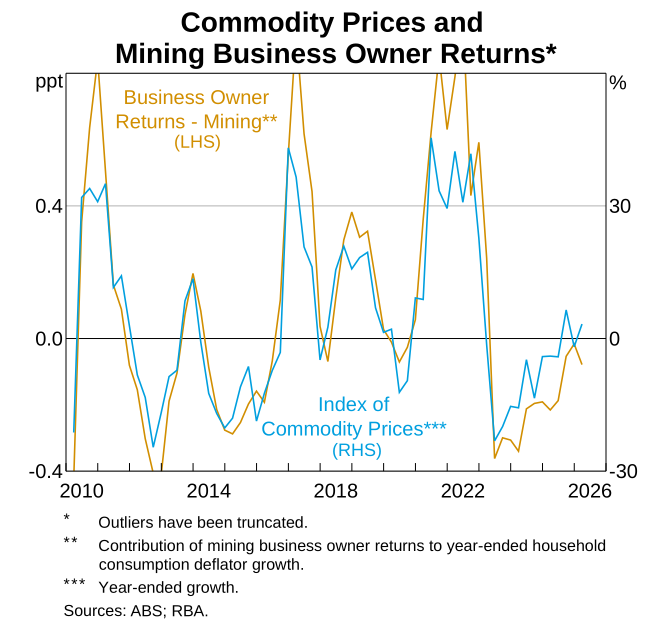
Business owner returns also accounted for a significant part of the growth in the household consumption deflator over 2022, though the increase was not uniform across industries. A relatively large share of this contribution can be explained by the mining industry (Graph 6). This is despite the mining industry supplying a small proportion of total inputs to household consumption (less than 2 per cent). Business owner returns in the mining industry grew strongly over 2022 and at a faster rate than business owner returns in other industries, owing to high global commodity prices (Graph 7).
By contrast, labour costs and dwelling rents accounted for a relatively small part of the growth in the consumption deflator over 2022. This reflects that it took some time for tight conditions in the labour and housing markets to flow through to higher labour costs and rental returns, consistent with usual lags.
Business owner returns and net taxes made large, volatile and broadly offsetting contributions to changes in the consumption deflator during the COVID-19 pandemic. This reflects the introduction and subsequent removal of government support measures (particularly JobKeeper) over this period.4 These policies continued to have a small effect on the year-ended contributions from business owner returns and net taxes to growth in the household consumption deflator into early 2022.
Price growth from 2023 to early 2026
From 2023 to early 2026, growth in the household consumption deflator has increasingly been accounted for by domestic factors. Although labour costs were relatively slow to respond to the initial increase in prices, they have made a large and persistent contribution to growth in the household consumption deflator since late 2022. The relatively slow speed of this pick-up in labour cost growth relative to the increase in business owner returns is consistent with evidence that labour costs are stickier than output prices in Australia, given the prevalence of multi-year enterprise bargaining agreements (Bishop and Cassidy 2019).
Dwelling rents have also made a sizeable and sustained contribution to household consumption deflator inflation since late 2022. Strong growth in dwelling rents over this period reflects the lagged effects of tight conditions in rental markets, with housing demand rising alongside factors such as the return of international migration following the pandemic (Agarwal, Gao and Garner 2023; Hanmer and Marquardt 2023; Hunter 2024; Twohig, Yadav and Hambur 2024). The pattern of rental price growth suggested by the decomposition is broadly consistent with that observed in the CPI, with movements in the two measures tracking each other in trend terms over time (Graph 8). However, the magnitude of the contribution to the household consumption deflator is around three times larger than for the CPI. This is because housing costs for both owner-occupiers and renters are measured by rents in the household consumption deflator, while rents in the CPI cover renters only. Rental subsidies – and particularly changes to Commonwealth Rent Assistance – have also driven divergences between the CPI and household consumption deflator measures of rents. Increases in these subsidies lowered rental inflation in the CPI, but are not captured by the household consumption deflator.
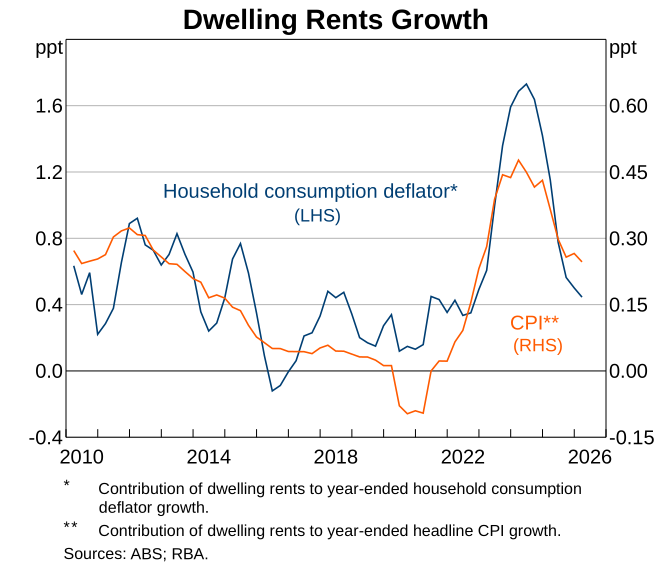
At the same time as domestic cost growth picked up, the contribution from import prices and business owner returns moderated significantly. In fact, business owner returns have dragged on aggregate consumer price growth a little in some quarters.
Conclusion
My decomposition suggests that the period of elevated inflation between 2022 and early 2026 was driven by a broad-based pick-up in the cost of production inputs. The costs of all key inputs to production grew at a faster rate than would be consistent with growth in the household consumption deflator at 2½ per cent. However, the relative contributions of each input have varied over time and so the recent inflationary episode has been characterised by a series of distinct phases. Business owner returns and import prices contributed materially to growth in the household consumption deflator immediately following the COVID-19 pandemic, while labour costs and dwelling rents were slower to rise but have made a more persistent contribution. Nevertheless, the relative contributions from each input have been broadly consistent with its share in production over the period as a whole.
While the framework presented here is descriptive and does not identify the underlying shocks driving the changes in input costs, it provides a useful lens for understanding inflation dynamics over recent years. My decomposition highlights that although the initial rise in inflation following the pandemic contained a significant global supply component, inflationary pressures broadened to include a substantial domestic component from early 2023. Consistent with other RBA analysis, this indicates that the recent inflationary episode has coincided with a period of excess demand in the Australian economy.
Appendix A: Decomposing the household consumption deflator
This appendix sets out the methodology used to generate my decomposition of the household consumption deflator.
Under the assumption that, in any given industry, the inputs used to produce goods and services for domestic consumption are the same as the inputs used to produce any other output, growth in the household consumption deflator can be represented by the following equation:
where:
- is the household consumption deflator
- is the share of consumption produced by industry derived from the input-output tables according to the method in Rayner and Bishop (2013)
- is labour costs
- is business owner returns
- is net taxes on production
- is dwelling rents
- is real gross value added
- is the gross value added deflator
- is import prices
- is sales taxes.
The decomposition relies on the assumption that each industry uses an identical combination of the domestic inputs regardless of who they are producing for. This assumption is required because industry-level input costs are not specific to the purchaser. The production of electricity – which is an important input to many production processes across the economy – is a useful example of what this means in practice. The decomposition assumes that utilities companies use the same mix of workers and machinery to produce electricity, whether that electricity is used by households, businesses or the government. While this assumption is likely to hold at the level of individual goods and services – and particularly for undifferentiated goods like electricity – it may be violated in industries that produce a relatively diverse range of goods and services in which households, businesses and the government consume very different mixes of products. For example, businesses purchase more specialised computing and electrical equipment than households and the manufacture of this specialised equipment may require a different mix of inputs.
Appendix B: Equilibrium contributions from input costs to household consumption deflator growth
This appendix sets out a mathematical proof for the contributions from each production input to growth in the household consumption deflator when all costs grow at the same rate. Uniform cost growth is one way of characterising the conditions that could occur if the economy was in equilibrium.
Assume that all inputs grow at a constant rate (equal to ) while real output is unchanged over time (equal to ). This is equivalent to assuming that all unit costs – the cost of using a given input to produce one additional unit of output – grow at the same rate as aggregate output prices. Let denote nominal gross value added in industry at time .
Impose these constraints on the equation in Appendix A and rearrange as shown:
The four terms within the brackets inside the summation are the respective factor shares of each input in industry . The sum of these terms is equal to 1 by construction, since the four terms capture all the domestic inputs used in production and gross value added is net of imports in the National Accounts. This implies that per unit of domestically generated price growth, a given input (given by ) will contribute:
The contribution of each input is simply a consumption-weighted sum of industry-level factor shares, adjusted for the share of consumption that is produced domestically.
Endnotes
* The author is from Economic Analysis Department. The author would like to thank Michelle Bergmann, Tomas Cokis, Iris Day, Jonathan Hambur, Martin McCarthy and Tom Williams for their help with this article.
1 Similar work decomposing consumer price indices overseas can be found in Dhingra (2023), Haskel (2023) and Schneider (2025).
2 The labour market was tightest in 2022, but it took some time for this to translate into higher labour costs, consistent with historical relationships. Housing market conditions were tightest in 2023, with dwelling rents also responding with a delay.
3 See Appendix B for a mathematical proof.
4 This is because these policies shifted some of the cost of the economy’s wage bill to the government. This meant that while labour costs were maintained from an individual’s perspective, labour costs from a business’s perspective fell significantly and by more than output, resulting in a temporary increase in business owner returns. The level of business owner returns later normalised as the policies were removed and businesses again became responsible for their wage costs.
References
Agarwal N, R Gao and M Garner (2023), ‘Renters, Rent Inflation and Renter Stress’, RBA Bulletin, March.
ABS (2020), ‘Understanding the Differences in Price Measures’, ABS Article, 2 September.
Beckers B, J Hambur and T Williams (2023), ‘Estimating the Relative Contributions of Supply and Demand Drivers to Inflation in Australia’, RBA Bulletin, June.
Bishop J and N Cassidy (2019), ‘Wages Growth by Pay-setting Method’, RBA Bulletin, June.
Cassidy N, E Rankin, M Read and C Seibold (2019), ‘Explaining Low Inflation Using Models’, RBA Bulletin, June.
Davis K, J Hambur, K Lane, D Megow, S Rafter and H Sullivan (2026), ‘Margins, Mark-ups and Consumer Prices: Theory, Measurement and Implications’, RBA Bulletin, May.
Dhingra S (2023), ‘A Cost-of-living Crisis: Inflation During an Unprecedented Terms of Trade Shock’, Speech at the Resolution Foundation, London, 8 March.
Fink M and J Hambur (2026), ‘Shifts in Australian Price-setting Behaviour around Large Shocks’, RBA Research Discussion Paper No 2026-02.
Hanmer F and M Marquardt (2023), ‘New Insights into the Rental Market’, RBA Bulletin, June.
Hansen N-JH, FG Toscani and J Zhou (2023), ‘Euro Area Inflation After the Pandemic and Energy Shock: Import Prices, Profits and Wages’, IMF Working Paper No 2023/131.
Haskel J (2023), ‘What’s Driving Inflation: Wages, Profits, or Energy Prices?’, Speech at Peterson Institute for International Economics, Washington DC, 25 May.
Hunter S (2024), ‘Housing Market Cycles and Fundamentals’, Speech at the REIA Centennial Congress, Hobart, 16 May.
Hunter S (2026), ‘Inflation and the Impact of the Middle East Conflict’, Speech at the Bloomberg Forum for Investment Managers, Sydney, 19 May.
Plumb M (2026), ‘Recent Developments in Inflation and the Economic Outlook’, Speech at the ABE Annual Forecasting Conference, Sydney, 24 February.
Rayner V and J Bishop (2013), ‘Industry Dimensions of the Resource Boom: An Input-Output Analysis’, RBA Research Discussion Paper No 2013-02.
RBA (2026), ‘Chapter 2: Economic Conditions’, Statement on Monetary Policy, August.
Schneider M (2025), ‘What Contributes to Consumer Price Inflation? A Novel Decomposition Framework With an Application to Austria’, Journal of Economic Structures, 14(2), pp 1–26.
Twohig D, A Yadav and J Hambur (2024), ‘Do Housing Investors Pass-through Changes in Their Interest Costs to Rents?’, RBA Bulletin, October.
Underlying data
Underlying data for selected graphs. Other data may be available upon request via our general enquiry page.