
Bulletin – May 2026 Australian Economy Margins, Mark-ups and Consumer Prices: Theory, Measurement and Implications

Abstract
Profit margins can provide useful information about how prices have evolved relative to costs, but simple narratives in which margins are said to have ‘driven’ inflation can be misleading. This article sets out a framework for understanding profit margins and their relationship with inflation. Margins can rise or fall for a variety of reasons, including changes in demand, costs or competitive conditions. The relationship between margins and inflation depends on why margins have changed: in some circumstances margins can rise alongside inflation, while in other situations margins can fall when inflation is rising. Developments in margins can sometimes provide useful insights into inflation dynamics, particularly when complemented by information from firms on the reasons for changes in their margins. Some of the disinflation observed in the first half of 2025 is likely to have reflected softer demand and downward pressure on margins, particularly in the retail and residential construction industries. In the second half of 2025, many firms indicated that downward pressure on margins had eased. In some cases, this reflected less discounting following a pick-up in demand, but in other cases it reflected efforts to cut costs or improve productivity rather than stronger prices growth.
Introduction
The prices that firms charge reflect two factors: their costs and their profit margin, with the margin capturing the share of revenue accruing to the firm’s owners after subtracting costs. Therefore, looking at changes in margins can provide some useful insights into what is happening with inflation, augmenting the other frameworks that the RBA uses to understand inflation dynamics, like the degree of excess demand or supply in the economy.1
Nevertheless, analysing developments in margins, by itself, generally cannot tell us what is causing inflation. This is because, depending on the underlying cause (i.e. the ‘economic shock’), an increase in margins can be accompanied by an increase or an easing in inflation.2 For example, if the underlying cause of an increase in margins is stronger demand, inflation could indeed rise alongside expanding margins. By contrast, an appreciation of the Australian dollar that lowers the cost of imported goods could lead margins to rise when inflation falls. This may arise because firms update their prices infrequently: if only some firms lower their prices immediately in response to lower costs, then overall costs in the economy could decline more quickly than prices. This would give rise to a scenario in which overall margins in the economy expand for a time, even as inflation eases. Assessing the implications of changes in margins for inflation therefore requires understanding why margins have changed.
In this analysis, the RBA tends to focus on shorter-run drivers of changes in margins, like shifts in demand or costs. While other factors like competition can affect the level of profit margins, changes in competition tend to evolve relatively gradually and so are generally less relevant for inflation over the horizon in which monetary policy seeks to return inflation to target. That said, longer-run influences on margins can be important for economic growth and productivity.
This article explains the concept of mark-ups and their connection to profit margins, and reviews the theoretical and empirical evidence on the relationships between mark-ups, margins and inflation. The article outlines a range of margin measures monitored by the RBA and discusses how these are used, alongside information from business liaison, to inform our assessment of inflation dynamics. While these measures differ in coverage and methodology, and can at times give divergent signals, tracking them remains valuable for building a broader picture of developments in prices and costs.
Mark-ups and margins compare prices to costs
Margins show the difference between revenue and costs. There are several different types of margins, each subtracting a different grouping of costs. A change in a specific type of margin indicates a change in total revenue relative to the corresponding grouping of costs, and hence a change in average price received relative to the average cost incurred.
Mark-ups show the difference between the price of an item and a firm’s marginal cost – that is, the cost of producing one more unit. Economic theory suggests that firms keep producing and selling up to the point where the cost of producing an extra unit exceeds the price that can be charged for it; as such, it is the marginal cost of an additional unit that matters for decision-making, not the average cost.3 According to this theory, firms set their price as a mark-up over marginal costs. The level of the mark-up chosen by the firm depends on the price sensitivity of demand – how much the quantity demanded changes in response to the price – which is influenced by the degree of competition and the consumers’ ability and willingness to shop around (see Appendix A for more detail).
Therefore, mark-ups and margins may not always behave in the same way because marginal and average costs are not the same. For example, the use of overtime to expand production would cause the marginal cost of labour to be higher than the average wage, if overtime pay rates are above average wage rates (Rotemberg and Woodford 1999). Similarly, when the labour market is tight, new hires may be brought on at higher wage rates than existing staff (Nekarda and Ramey 2020).4 In many cases, though, mark-ups and margins would be expected to move together, but mark-ups would generally be more volatile.
Although marginal costs and mark-ups are more theoretically relevant to price-setting decisions than average costs and margins, in practice mark-ups and marginal costs are difficult to observe. Due to data availability, most empirical analysis tends to focus on measures of margins and average costs. From here on, this article focuses on margins rather than mark-ups.
The relationship between margins and inflation depends on what caused margins to change
At first, it might seem natural to observe rising (falling) margins in the economy and then infer that margins have caused inflation to be higher (lower) than otherwise. However, economic theory and empirical evidence suggests that the relationship between profit margins and inflation is not that simple for two reasons.
First, firms’ margins should not be thought of as moving independently from other economic developments. Margins change in response to more fundamental developments in the economy – such as shifts in demand, changes in costs, or changes in competition – rather than because firms unilaterally choose to adjust their margins. Observed margins are better thought of as an outcome of these more fundamental ‘economic shocks’, rather than as a standalone driver of inflation.
Second, theory and evidence suggest that different economic shocks can drive margins and inflation in different directions. Some shocks will raise margins and increase inflation. But other shocks can raise margins while lowering inflation. The same is true for economic activity: some shocks can raise margins and economic activity, while others can raise margins but decrease economic activity. Accordingly, it is hard to make a definitive statement about changes in margins ‘causing’ inflation. Similarly, it can be hard to assess how margins move with the business cycle: whether they tend to increase when the economy is in a cyclical upswing (i.e. whether they are procyclical), or whether they rise in downturns (i.e. whether they are countercyclical).
Examples
In short, margins can increase for different reasons, and those reasons matter for what happens to inflation. In this section, we run through some of the key shocks and their effect on margins and inflation, as shown in Figure 1.
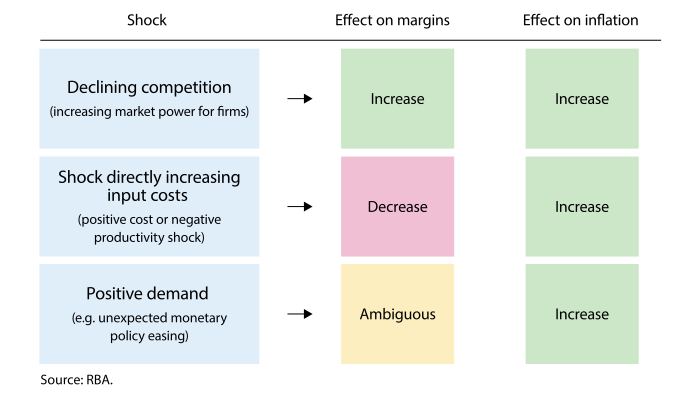
(a) The results in this figure can be reached intuitively based on a typical New Keynesian model marginal cost specification, and is consistent with Nekarda and Ramey (2020) and Macallan et al (2008).
One case where margins and inflation can rise together is when firms’ pricing power increases. If customers become less sensitive to price increases, or if competition weakens, firms may lift prices relative to costs (i.e. the mark-up and margin increases). In this case, the increase in margins and prices may lead to higher inflation.5 Output may also weaken, as higher prices weigh on demand. In practice, changes in competition tend to be more structural in nature, and their impacts on margins are likely to play out over a number of years. As such, while competition is important for setting the level of margins, it tends to be less important in accounting for shorter-term changes in margins and inflation (though there can be exceptions from time to time in individual sectors or for individual goods or services).
When prices are ‘sticky’, other shocks can cause margins to decrease alongside rising inflation. For example, an input cost shock, such as an increase in oil prices, can cause margins to decrease alongside rising inflation. This is because costs rise immediately, but firms may only pass those costs through to prices slowly, resulting in a pick-up in inflation alongside (temporary) margin compression.6
The same point applies in reverse when input costs fall. For example, if the Australian dollar appreciates, then foreign inputs will be cheaper for Australian firms. If some firms are slow to lower their prices, their costs could fall more quickly than their prices, leading to a widening in economy-wide margins even while inflation is easing.
Shocks to demand can also cause margins and inflation to change, but the relationships are more complex. When demand strengthens, firms will try to meet that extra demand by producing more. This will push up their costs, and they will want to raise prices accordingly. Whether margins rise or fall depends on how quickly prices adjust relative to costs. If overall costs in the economy rise more quickly than prices – for example, because some firms have long-term sales contracts – economy-wide margins may be compressed for a period even though inflation is increasing. But if prices adjust more quickly than costs, margins may rise alongside higher inflation.
Empirical evidence
The empirical evidence is consistent with the theoretical discussion above. It does not find a stable relationship between margins, the business cycle and inflation. Empirical evidence suggests the relationship between margins and inflation depends on the nature of the underlying shocks.
A large literature attempts to identify the correlation between margins and the business cycle. It tends to find no stable relationship between margins and the business cycle.7 An emerging literature attempts to estimate the causal effect on margins of particular economic shocks, and provides somewhat clearer insights. Nekarda and Ramey (2020) find evidence in line with Figure 1, with margins expanding in response to positive demand shocks, or deflationary cost or productivity shocks.8 Cantore et al (2020) have similar findings for demand shocks, including for Australia. These findings for demand shocks suggest that prices change more quickly than costs.9
The RBA monitors a range of margin measures, as each measure has strengths and limitations
Estimates of margins can be constructed from a variety of data sources and consider different sets of costs and revenues. These measures differ in terms of firm or industry coverage, which affects how relevant they are for understanding developments in the consumer price index. Each measure has its own strengths and limitations, as outlined below. In practice, a range of margin measures are typically considered to form a more complete view of the developments in profitability that may be relevant for understanding inflation dynamics.
National accounts
Measures of margins can be constructed using statistics published by the Australian Bureau of Statistics (ABS). These measures are useful indicators of margins, since they are of a high quality and comprehensive. Nonetheless, they can be somewhat unintuitive, reflecting the definitions of national accounting concepts. The most common national accounts measure of profits is gross operating surplus (GOS), which can broadly be considered the value of profits before deducting the returns to capital.10 There are four key caveats to consider when interpreting GOS as a measure of profits.
First, because returns to capital are not deducted from GOS, this measure of profits combines returns to capital used in production (i.e. the income required to compensate owners of capital for depreciation, risk and the opportunity cost of funds) and economic profits (additional returns often associated with market power, scarcity or temporary factors). In general, we are more interested in variation in economic profits, but changes in these profits could be masked by changes in returns to capital.11
Second, an intuitive way to convert GOS into a margin is to express it as a share of output, which would be loosely similar to the accounting concept of an operating margin in financial reports (discussed below). However, these data on output are available only at an annual frequency and with a substantial delay, with data released 12 months after the end of the financial year.
Third, as a result of this delay, it is more common to express GOS as a share of gross value added (GVA), since this can be calculated at a quarterly frequency about two months after the end of the reference quarter. Although this measure of margins is much more timely, it will exhibit counterintuitive and potentially misleading behaviour when intermediate input costs – such as fuel costs – are changing. This issue arises because GVA is calculated as the value of output less intermediate input costs, and so as a result both GOS and GVA exclude these costs. For example, if firms increase prices in response to an increase in fuel costs, so as to keep their prices as a constant percentage wedge over total costs, both GOS and GVA would increase by the same dollar amount (assuming all else constant).12 Because GOS excludes labour costs and is therefore smaller than GVA, the same absolute increase in both will raise the ratio of GOS to GVA. In other words, firms passing through an increase in the cost of an input such as fuel could incorrectly be perceived as increasing their margins.
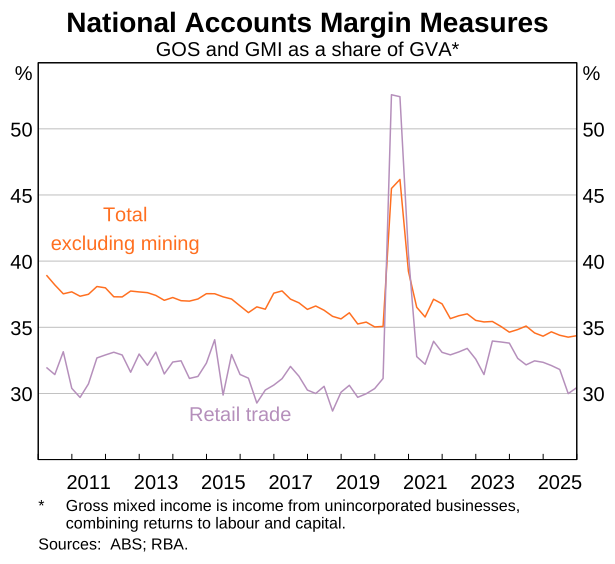
Fourth, national accounts measures of profits, such as GOS, capture a very different industry mix to the Consumer Price Index (CPI), making it hard to map changes in GOS to CPI. National accounts measures of margins consider total profit and income for an industry, or across the economy. Developments in GOS for industries whose output is largely sold to other businesses or exported, such as mining, therefore may be less relevant for understanding dynamics in consumer price inflation. The mining industry contributes the largest share to total national GOS, yet its outputs are not directly consumed by households and are therefore excluded from the basket of goods and services measured in the CPI. Developments in GOS for industries where the final consumer is likely to be mostly households, such as the retail trade industry, may be more informative (Graph 1).
Accounting records
Data from firms’ accounting records – such as public financial reports for listed firms or tax records and administrative data for other firms – can also be used to construct various measures of margins based on different groupings of costs. A gross margin shows revenue relative to the direct cost of goods sold (i.e. the costs directly involved in production and sale). An operating margin considers all income received (including revenue as well as other income) and deducts the cost of goods sold as well as operating costs not directly related to the production and sale of goods and services (such as wages, marketing expenses or consulting fees). An example of an operating margin is ‘earnings before interest, taxes, depreciation and amortisation’ (EBITDA) over revenue. A net margin deducts all costs faced by a firm, including taxes and interest expenses. A visual comparison of these measures is available in Appendix B.
These different measures may tell different stories about developments in profitability. For example, gross margins could widen if revenue increases relative to the cost of goods to be sold but, at the same time, net margins may narrow due higher operating costs (e.g. wages, property rents, compliance costs).
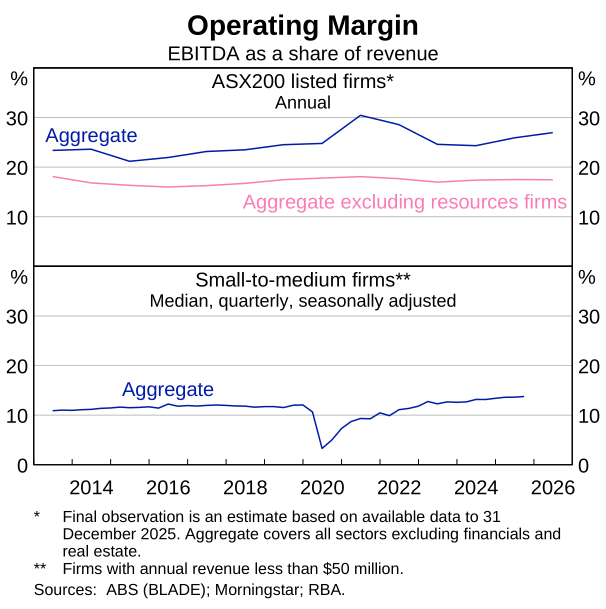
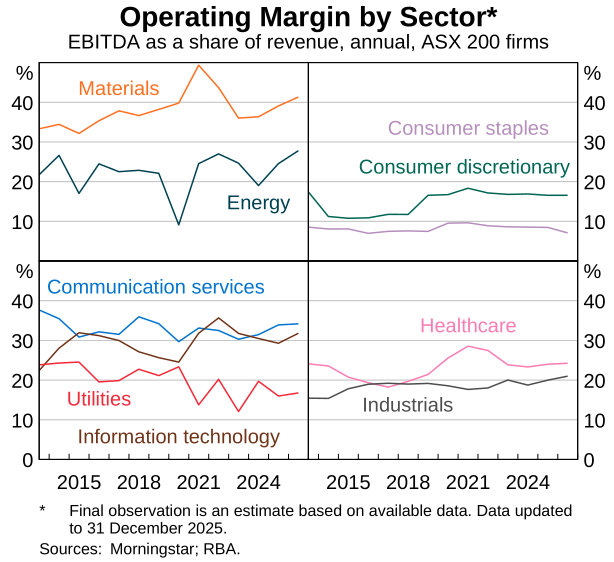
As with national accounts measures, margins for some industries will be more relevant than others for consumer price inflation. Aggregate measures based on listed firms’ published financial statements may be less informative as, for example, they include mining firms whose outputs are not directly consumed by households; these aggregate measures suggest margins have picked up recently (Graph 2). By contrast, measures focused on specific consumer-facing industries, such as consumer staples or consumer discretionary firms, may be more relevant for understanding consumer price inflation dynamics. In recent periods, operating margins for these industries have remained stable or eased slightly (Graph 3). Changes in the sample of listed firms over time, however, can mechanically affect margin measures even if firms’ revenue and costs have not changed. Many firms also operate across multiple industries, meaning that industry classifications are necessarily imperfect. Moreover, listed firms tend to be large and mature businesses, meaning their margins may not be representative of all firms relevant to consumer price inflation (Chow and Harris 2024).
In addition to listed firms’ published financial statements, these measures of margins can also be constructed using firm-level data from the Business Longitudinal Analysis Data Environment (BLADE), compiled by the ABS (Graph 2). BLADE consists of administrative data from the Australian Taxation Office (ATO) on the near universe of firms matched with ABS survey microdata, such as the Business Characteristics Survey (ABS 2026). Although these data provide wider coverage of the firms relevant to consumer price inflation, they also imperfectly capture the margins relevant for consumer price inflation because they do not distinguish between domestic sales and exports.
Price-cost ratios
Price-cost ratios are sometimes used as a rough proxy for developments in margins. These ratios compare final prices with input prices, and offer an intuitive way to assess whether the prices of final goods and services are growing faster or slower than the key inputs used to create them. Examples of price-costs ratios include the ratio of consumer prices to unit labour costs (Graph 4), or the ratio of the price of a new dwelling to the cost of building materials (Graph 5).
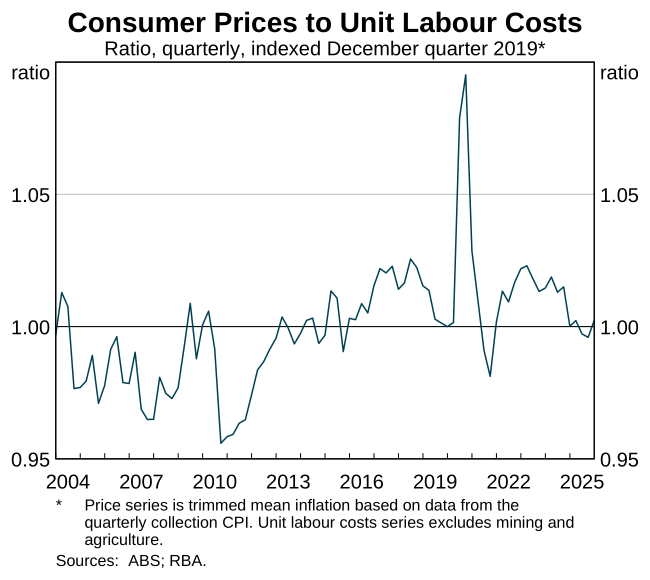
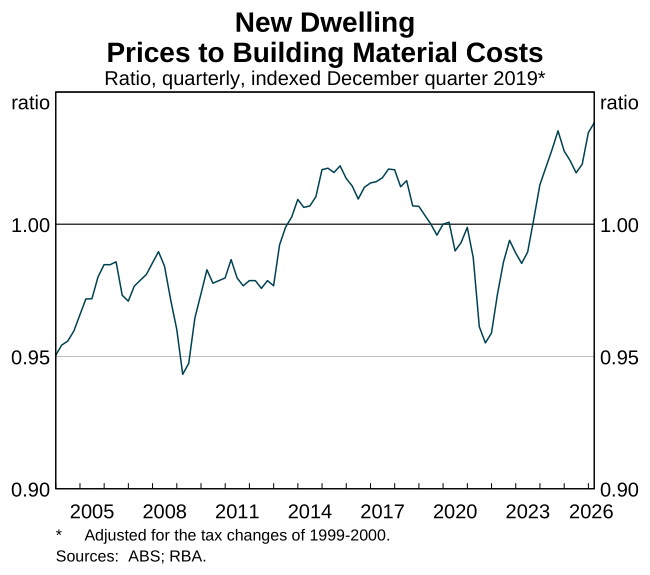
Price-cost ratios may or may not be a good proxy for developments in firm’s margins. Most price-cost ratios do not consider all costs faced by firms during production and so it is possible margins may be moving in a different direction than suggested by the movement in the price-cost ratio. Nevertheless, price-cost ratios are still useful given they can be used to compare price growth with cost growth for specific items within the CPI basket. This allows for a more granular comparison of price and cost growth than other data sources, which are limited in industry level detail. For example, while other margin measures only allow us to proxy margin movements at the industry level (i.e. construction), price-cost ratios enable analysis of potential movements for specific goods and services (i.e. detached residential construction), which are more relevant to consumer prices. Some price-cost ratios are also more timely than many measures of margins, including those from national accounts or financial reports.
Surveys
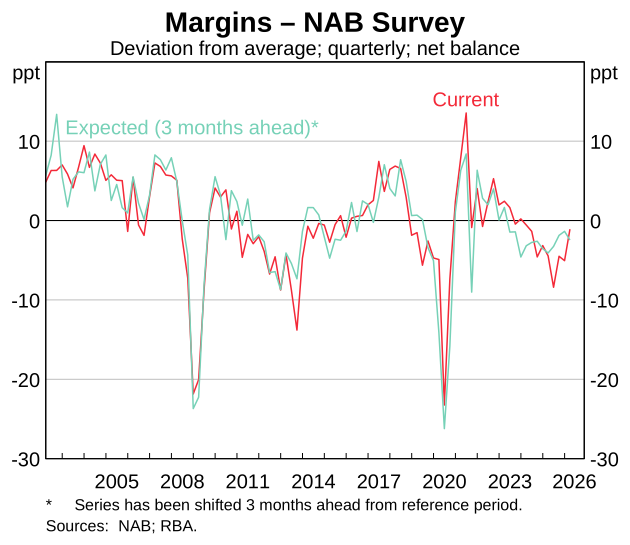
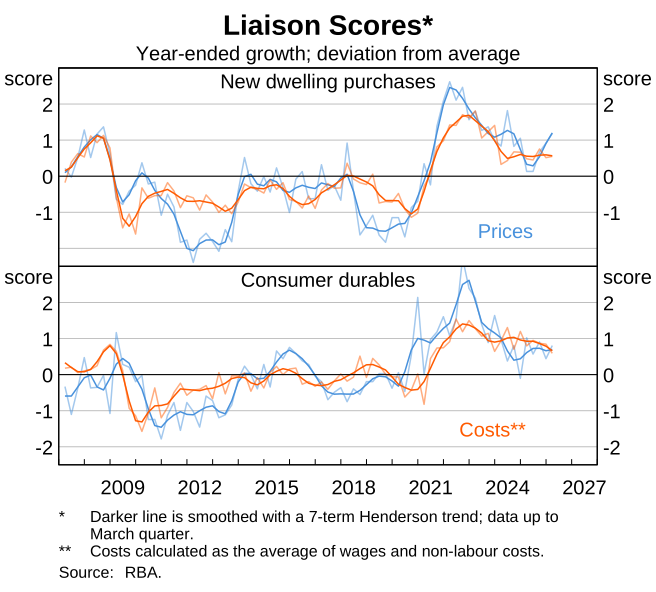
Measures of margins derived from the RBA’s liaison program and other business surveys can also be used to compare growth in prices and costs (Graph 6; Graph 7). While survey-based measures are timely, it is often unclear which specific margin concept firms have in mind when responding. In liaison, retailers tend to report gross margins, whereas service-based businesses tend to report EBITDA or net margins. These measures are all bundled together, even when they may be telling different stories about underlying profitability. Regardless, the margins reported in these surveys and discussions are more likely to be comparable to one of the accounting measures rather than GOS as a share of GVA, and so would reflect changes in intermediate input costs in an intuitive way.
Nonetheless, the availability of industry-level data allows margin measures to be constructed that are more closely matched to the kinds of firms whose prices are included in the CPI. Moreover, the commentary that firms share in liaison meetings about the drivers of margin changes, and how costs growth compares with prices growth, can make these measures particularly useful for understanding inflation dynamics.
Margins data and business liaison commentary are combined to provide insights into inflation dynamics
The available data on margins are analysed alongside liaison and survey information for individual industries. To understand the implication of movements in these data for inflation, the RBA listens to what firms are saying about why their margins have changed, and what they expect to happen in future, as well as their descriptions of how prices are evolving relative to costs. This analysis proved useful in understanding some of the dynamics in inflation over 2025, as reported in the Statement on Monetary Policy and speeches.13
In early 2025, a range of measures suggested that margins for some consumer-facing firms had declined and costs were increasing faster than prices. National accounts measures of margins declined a little over 2025, and more noticeably for the retail industry. Accounting margins for consumer staples declined somewhat over 2025, though margins for consumer discretionary firms were little changed. Price-cost ratios suggested growth in consumer prices was being outpaced by growth in unit labour costs, and growth in the price of a new dwelling was being outpaced by growth in building materials costs. Survey measures and liaison also suggested that margins for many consumer-facing firms were being compressed.
To better understand the drivers, these data were supplemented by liaison information. Liaison contacts in the residential building industry in some states were noting that soft demand growth had led homebuilders to charge lower prices than otherwise, as they increasingly resorted to discounting and promotions to increase sales. Similarly, some retailers were saying that they were discounting more than usual due to weak demand growth and could not pass strong cost growth through to prices.
In the second half of 2025, there was some evidence that margins were under less downward pressure, and inflation also picked up. National accounts measures of margins ticked up slightly towards the end of 2025, including for the retail industry; however, there is little evidence of this change in accounting measures of margins for firms in the consumer staples and consumer discretionary industries. Price-cost ratios suggested that consumer price inflation picked up relative to unit labour cost growth towards the end of 2025, and growth in new dwelling prices also picked up relative to growth in building materials costs. Survey measures and liaison suggested that margins for many firms were under less downward pressure than earlier in the year.
Again, liaison information helped provide a picture of the drivers. Homebuilders reported they were dialling back on discounting and promotions as demand had picked up. Similarly, fewer retailers reported the need to discount as heavily, noting that demand conditions had recovered somewhat. That said, some retailers reported that their margins had stabilised or increased due to a shift in the composition of their sales to higher margin products or activities, a reduction in costs, or a pick-up in productivity, rather than an increase in prices.
Overall, these messages together pointed to some disinflationary pressures in the form of soft demand growth weighing on margins in the early part of 2025, which then receded in the second half of 2025. But they also highlight that the drivers of margins movements, and their relationship with inflation, differed somewhat across sectors and firms.
Summary
Profit margins provide useful information about how prices have evolved relative to costs. Profit margins are often used as a proxy for mark-ups, which are central in price-setting theory. Margins can rise or fall for a variety of reasons, including changes in demand or costs. The relationship between margins and inflation depends on why margins have changed. Empirical evidence does not point to a stable relationship between margins, inflation or the business cycle, underscoring the importance of understanding the underlying drivers of margin movements when assessing their implications for inflation.
The RBA monitors information from a range of margin measures – including national accounts, financial reports, price-cost ratios, surveys and liaison – each of which has its advantages and disadvantages. These data are complemented with information from firms to help explain why margins are changing. Taken together, developments in margins and costs provide the RBA with another lens through which to understand developments in inflation, complementing data on costs and the degree of spare capacity in the labour market and economy.
Analysis using these measures of margins and comparing costs growth with prices was informative in our understanding of inflation dynamics through 2025. It appears that some sector-specific dynamics were pushing down both margins and aggregate inflation in early 2025, but then subsequently unwound, accentuating the pick-up in aggregate inflation in the latter part of 2025. Nevertheless, our assessment is that changes in margins had only a modest impact on inflation dynamics overall.
Appendix A: Price-setting theory
This appendix sets out in more detail the theory about how firms set prices.
According to theory, firms will want to set their price () as a mark-up over their marginal cost (). The size of this mark-up will reflect how much market power they have, or equivalently how easily consumers can change to another provider. This is referred to as the elasticity of demand, .
Changes to mark-ups (and margins), can therefore reflect changes in the firm’s market power. Changes to could reflect temporary exogenous changes (e.g. a temporary change in consumer preferences) or permanent ones (e.g. a structural change in competitive structures like a new entrant). Changes in could also be endogenous to the state of the economy.
While this is how firms would like to behave, there are often factors that stop them changing their price, such as long-term contracts, periodic reviews, or physical reprinting costs. These are referred to as pricing frictions.
When there are pricing frictions, prices will not always adjust fully or quickly, so mark-ups and margins could change in response to any shock that affects marginal costs. This reflects two related channels that mean that the current price no longer solely relates to the current marginal costs. First, because of the frictions, firms may not update their prices every time the marginal cost changes. Second, when firms do update their prices, they will set prices based not only on current marginal costs but also future expected marginal costs. This is because they know they might not be able to change their price tomorrow. Specifically, the price firms choose when they do reset prices takes the form (Gali 2015):
is the price chosen by a firm who is resetting prices at time . is the expected future marginal cost ( periods into the future). is a constant parameter, between zero and one, which is zero when prices are fully flexible. As a result, when prices are not flexible, mark-ups and margins can also change in response to any ‘shock’ that hits the economy which affects marginal costs. This makes it hard to interpret the implications of changes in margins for inflation.
Appendix B: Breakdown of different profit measures
In Figure B.1 we outline in more detail the difference between different notions of accounting and national accounts profits.
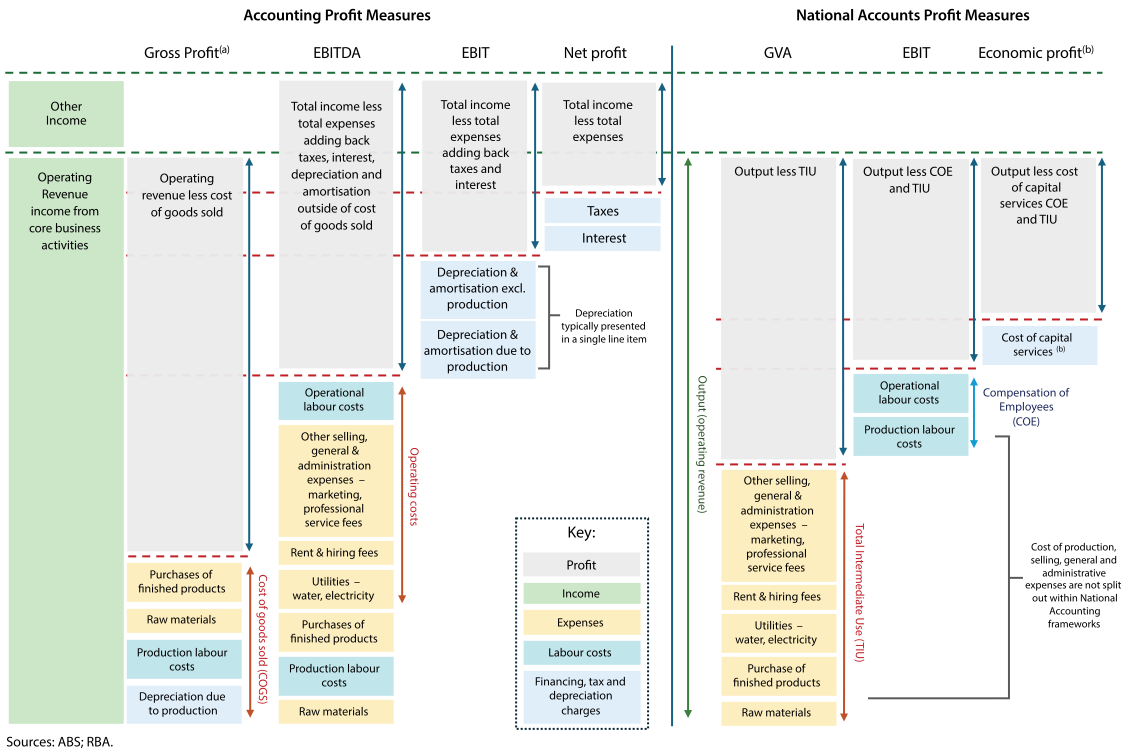
(a) Many costs splits shown are not typically reported by firms or recorded in published statistics. For
example, firms often do not differentiate labour costs between operational activities and the production
of goods and services.
(b) Not necessarily included in every financial statement; cost of goods sold is typically associated with
manufacturing, retail and wholesale entities.
(c) The cost of capital services is the total user costs of all fixed assets, land, and inventories. The
user cost equals depreciation, plus compensation for the time value of money, less expected holding gains
and losses on the asset, adjusted for taxes. When the ABS estimates user costs, they assume the cost of
capital services equals GOS plus the capital part of GMI, which implies economic profit is zero. However,
one can estimate the cost of capital services in other ways that imply positive amounts of economic
profits.
Endnotes
* The authors are from Economic Analysis and Economic Research Departments. They would like especially to thank George Davis for providing the analysis of business liaison information, and Grace Elgie and Alessio Galluzzi for providing data and graphs used in this article.
1 For more detail on the framework the RBA uses to understand inflation, see Hunter (2026). More detail on some of the inflation models are explored in Cassidy et al (2019).
2 More formally, economic models tend to assume there are some ‘exogenous’ variables that together are the fundamental determinants of the state of the economy. Fluctuations in these ‘exogenous variables’ (otherwise known as economic shocks) change the state of the economy, acting as the fundamental causes of variation in ‘endogenous’ variables (such as mark-ups or margins, and inflation).
3 Although theory suggests firms set prices with respect to marginal costs, there is some evidence that firms focus on average costs, particularly in sectors where fixed costs are a large share of total costs and need to be recouped. For example, see Altomonte et al (2015).
4 These factors tend to imply that marginal costs will tend to be more volatile, and more procyclical, than average costs. This is consistent with the evidence for the United Kingdom, which find that estimates of mark-ups are more volatile than margins (Macallan et al 2008).
5 As with the rest of this section, we have assumed mark-ups and margins move together. In practice, there are some cases in which mark-ups and margins could move differently. Effects on different measures of margins may also vary depending on the particular shock being considered.
6 On the other hand, in the context of a large oil price shock that hits when inflation is already high, pass-through to prices may be faster than usual. For more information about how increases in oil prices may affect the economy, see RBA (2026a).
7 Nekarda and Ramey (2020) and Rotemberg and Woodford (1999) offer reviews of academic literature, while internal RBA work finds similar conclusions for Australia, though Norman and Richards (2010) find some evidence of procyclicality in Australian margins in a regression framework.
8 Santos et al (2022) find some conflicting results, though their shocks appear co-determined with their firm-level mark-up measures that could introduce some biases.
9 This is one area where the empirical evidence diverges from the predictions of basic macroeconomic models, which typically imply that prices change more slowly than costs. Many standard New Keynesian (NK) models imply mark-ups fall in response to positive demand shocks. While some authors suggest this may result from a lack of emphasis on wage rigidity (Nekarda and Ramey 2020), more recent work suggests that in many models, mark-up responses cannot be procyclical irrespective of wage rigidity (Bilbiie and Kanzig 2024; Cantore et al 2020).
10 More formally, GOS is the value of profits after deducting the following from the value of output: intermediate input costs, labour costs, and taxes (and adding back subsidies).
11 For example, the return required to use capital could rise (due to higher risk premia, higher depreciation costs, higher interest rates or a rise in the cost of financing or replacing capital), but GOS based margins may be unchanged even when economic profits decline, potentially masking a weakening in underlying profitability.
12 In particular, this assumes prices are set as a wedge over the sum of intermediate input costs, labour costs, and returns to capital. If firms increase prices so as to maintain a constant dollar wedge over total costs, then both GOS and GVA would be unchanged.
13 For example, this was reported in RBA (2026b); Plumb (2026).
References
ABS (Australian Bureau of Statistics) (2026), ‘Business Longitudinal Analysis Data Environment (BLADE)’, Website, available at <https://www.abs.gov.au/about/data-services/data-integration/integrated-data/business-longitudinal-analysis-data-environment-blade>.
Altomonte C, A Barattieri and S Basu (2015), ‘Average-cost Pricing: Some Evidence and Implications’, European Economic Review, Vol 79, pp 281–296.
Bilbiie FO and DR Känzig (2024), ‘Greed? Profits, Inflation, and Aggregate Demand’, NBER Working Paper No 31618.
Cantore C, F Ferroni and MA León-Ledesma (2020), ‘The Missing Link: Monetary Policy and the Labor Share’, Bank of England Working Paper No 857.
Cassidy N, E Rankin, M Read and C Seibold (2019), ‘Explaining Low Inflation Using Models’, RBA Bulletin, June.
Chow E and J Harris (2024), ‘The Private Equity Market in Australia’, RBA Bulletin, April.
Gali J (2015), Monetary Policy, Inflation, and the Business Cycle: An Introduction to the New Keynesian Framework and Its Applications, 2nd edition, Princeton University Press, Princeton.
Hunter S (2026), ‘Inflation and the Impact of the Middle East Conflict’, Speech at the Bloomberg Forum for Investment Managers, 19 May.
Macallan C, S Millard and MI Parker (2008), ‘The Cyclicality of Mark-ups and Profit Margins for the United Kingdom: Some New Evidence’, Bank of England Working Paper No 351.
Nekarda CJ and VA Ramey (2020), ‘The Cyclical Behavior of the Price-Cost Markup’, Journal of Money, Credit and Banking, Vol 52(S2), pp 319–353.
Norman D and A Richards (2010), ‘Modelling Inflation in Australia’, RBA Research Discussion Paper No 2010-03.
Plumb M (2026), ‘Recent Developments in Inflation and the Economic Outlook’, Speech at the 2026 ABE Annual Forecasting Conference, Sydney, 24 February.
RBA (Reserve Bank of Australia) (2026a), ‘Chapter 4: In Depth – The Impact of Higher Global Energy Prices on the Australian Economy’, Statement on Monetary Policy, May.
RBA (2026b), ‘Box B: Insights from Liaison’, Statement on Monetary Policy, February.
Rotemberg JJ and M Woodford (1999), ‘The Cyclical Behavior of Prices and Costs’, in JB Taylor and M Woodford (eds), Handbook of Macroeconomics, Vol 1B, Elsevier, Amsterdam, pp 1051–1135.
Santos CD, LF Costa and PB Brito (2022), ‘Demand, Supply And Markup Fluctuations’, The Economic Journal, Vol 132(644), pp 1620–1645.
Underlying data
This file contains all underlying data that are available for public release. Underlying data