Bulletin – April 2024 Financial Stability Assessing Physical Climate Risk in Repo-eligible Residential Mortgage-backed Securities
- Download 598KB
Abstract
This article assesses physical climate risk in Australian residential mortgage-backed securities (RMBS) using two risk metrics. Based on these metrics, RMBS with higher levels of physical climate risk tend to be issued by small regional banks and credit unions. In addition, RMBS with higher physical climate risk do not appear to have additional credit enhancement. This could suggest that securitisation markets have yet to fully incorporate physical climate risk exposures into their assessments of RMBS, or that current climate risks are perceived to be small. However, the measure of climate risk used in this analysis is subject to several limitations and there is significant uncertainty about the future path and impact of climate change. This analysis is a first attempt at quantifying climate risk present in Australian RMBS and is part of ongoing work at the RBA to assess the effect of climate change on the financial system.
Introduction
Understanding climate risks carried by residential mortgage-backed securities (RMBS) – a collection of bonds ‘backed’ by principal-and-interest payments on mortgage loans – is important for pricing them correctly. The RBA has some exposure to RMBS via their use as collateral in the RBA’s market operations. The RBA undertakes transactions in domestic financial markets to implement monetary policy and provide liquidity to the financial system. This usually involves lending cash to counterparties in exchange for collateral through repurchase agreements (repos). In recent years, a significant share of collateral provided by market participants has been RMBS (Graph 1). This includes self-securitised RMBS (self-secs), which were a large share of collateral provided to access the Term Funding Facility and could potentially serve as a source of eligible collateral in future periods of stress.[1] Publicly traded (or ‘marketed’) RMBS are also eligible collateral for the RBA’s regular liquidity operations. RMBS noteholders are exposed to a range of risks, most of which are well known, but climate risk is less well understood. The RBA’s exposures to these assets means that understanding the risks carried by RMBS, including climate risks, is important for the RBA as well as for the financial sector more broadly.

How climate change could affect RMBS
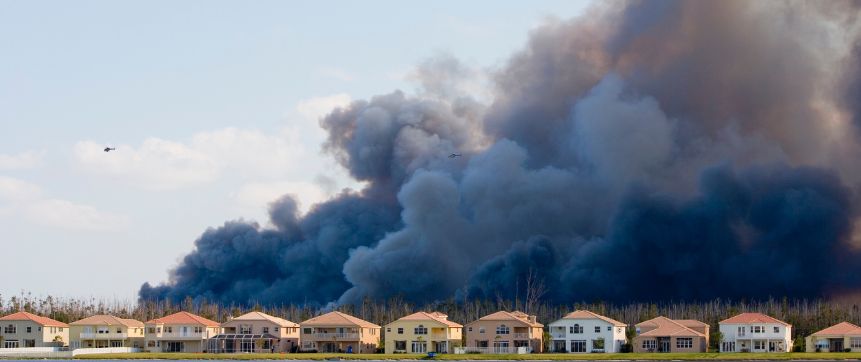
The residential mortgages that underlie RMBS are exposed to physical climate risks in various ways.[2] The underlying properties may be exposed to acute climate events, such as flooding, cyclones and bushfires. These events are expected to become more frequent and/or severe with climate change. Some properties are also exposed to chronic risks, such as rising sea levels or land subsidence from decreased rainfall. Climate risk exposures can decrease property values and reduce a borrower’s ability to service their debt through a range of channels. These include increased insurance, maintenance and repair costs, reduced demand from prospective buyers and tenants to live in locations more exposed to climate risk, and climate-related disruptions to economic activity affecting jobs and incomes. In cases where the mortgage has been securitised, these risks could be passed through to holders of RMBS, including those holding these assets as collateral, such as the RBA.
However, multiple factors help to mitigate risks to RMBS noteholders:
- Defaults on insured mortgages will only pass through to the RMBS if the property is sold below the outstanding value of the loan and the mortgage insurer fails to pay out the difference.
- Structural features of RMBS in the Australian market provide credit support to senior noteholders in particular.[3]
Additionally, from the perspective of the RBA:
- The RBA does not buy RMBS outright so is only directly exposed to RMBS after a counterparty defaults. In this rare scenario, the RBA’s direct exposure would remain until the security matures or is liquidated by the RBA.
- The RBA requires RMBS to maintain a AAA-credit rating to continue to be repo-eligible, applies margins (i.e. haircuts) to the collateral value received and makes daily margin calls if the collateral value falls.
Previous work by the RBA investigated the potential physical climate risks to commercial banks’ loan books, finding that overall losses for the financial system due to climate-related declines in property values are likely to be manageable (Bellrose, Norman and Royters 2021). The analysis in this article builds on that earlier work, using a similar dataset and assumptions, to assess physical climate risk inherent in RMBS that are eligible as collateral in the RBA’s market operations. We focus on physical climate risks to RMBS, where the underlying pool of mortgages may face more concentrated risks than the mortgage market as a whole, and extend the analysis to include non-bank lenders, for which RMBS are an important source of funding.
Data
Following Bellrose, Norman and Royters (2021), the main climate risk measure used in this analysis is the annual Value at Risk (VaR). In this context, VaR represents a technical insurance premium, which is an estimate of the annual expected cost of damage from all climate-related hazards relative to the replacement cost of a dwelling.[4] These data were sourced from XDI-Climate Valuation and assess the combined VaR from seven hazards in Australia.[5] The second measure used is the proportion of ‘high-risk’ properties (HRP) per postcode. A property is considered high risk if the annual VaR is greater than 1 per cent, following the definition used by Bellrose, Norman and Royters (2021).
XDI-Climate Valuation provide VaR estimates at five-year frequencies from 1990 to 2100. Risk estimates for 2020 are used as the measure of current climate risk exposure as this is the most recent period in the XDI-Climate Valuation dataset where VaR estimates are based on observed climate data. The average VaR across all Australian properties in 2020 was 0.22 per cent, equating to an annual technical insurance premium of $1,075 for a property that would cost $500,000 to replace.[6] Meanwhile, around 4 per cent of all dwellings in Australia were considered HRP in 2020. These Australia-wide averages are used as a reference point in the analysis that follows.
VaR estimates for 2050, a common reference point for climate scenarios, are used to measure exposure to future climate risk. The 2050 projections are based on the Intergovernmental Panel on Climate Change Representative Concentration Pathway (RCP) 8.5 scenario.[7]
Detailed loan-level data on around 2.5 million securitised residential mortgages were sourced from the RBA’s Securitisation System.[8] This captures approximately two-thirds of the public RMBS market in Australia, in addition to self-securitisations, and covers around one-third of Australian residential mortgages by value. For this analysis, relevant attributes include the RMBS deal the mortgage belongs to, the postcode of the underlying property, the outstanding loan balance, and other common features used to assess credit risk.
Measuring current climate risk in RMBS
For this analysis, the datasets described above are combined to compute two metrics of climate risk for each of the 283 repo-eligible RMBS deals in the Securitisation System as of 31 December 2023:
- The VaR index. This is the average of the postcode-level VaR of each mortgage in an RMBS, weighted by loan balance outstanding.
- The HRP index. This measures the proportion of properties in an RMBS with a VaR exceeding 1 per cent, weighted by loan balance outstanding.
The analysis was conducted at a postcode level due to the privacy considerations around analysing the data at a more granular geographic resolution, such as property level. The VaR index is our preferred metric as it represents a direct estimate of physical climate risk. However, the HRP index provides a cross-check against any aggregation bias in the VaR index; for example, if a postcode contains a number of very low-risk and very HRP, the VaR index may understate the climate risk of an RMBS. Further details about these metrics are provided in Appendix A.
The average VaR index across all RMBS in the dataset was 0.2 per cent as of 31 December 2023, which is slightly below the Australia-wide average (Graph 2).[9] Results are broken down by ‘issuer type’ (or, more accurately, the sponsoring entity of the RMBS) to assess whether meaningful differences exist.[10] RMBS issued by large banks and non-banks have VaR index values largely clustered around the mean. By contrast, those issued by small banks exhibited larger variation in the VaR index, as discussed further below. The highest risk RMBS had a current VaR index value roughly three times higher than the Australian average. This equates to a technical premium of over $3,000 annually for a property that costs $500,000 to replace.

Similarly, the average proportion of HRP among RMBS was slightly below the Australia-wide average (Graph 3). RMBS issued by small banks contained a larger proportion of HRP than those from other issuer types at 4 per cent. The HRP index for the most ‘at risk’ RMBS was over 15 per cent, indicating that roughly one in six mortgages in that loan pool are secured against a property located in a high-risk postcode.

Future climate risk in RMBS
Next, we investigated how the risk profile of RMBS would change under a high emissions scenario where physical climate risks increase by 2050, assuming the composition of mortgages in the RMBS portfolio stays fixed. While this is a strong assumption, as the lending decisions of financial institutions will be likely to adapt to a changing risk profile, this analysis can also be thought of as a stress test on current RMBS loans pools if climate risks were realised more quickly than expected.
In this scenario, both the universe of repo-eligible RMBS and the Australia-wide average see a 25 per cent increase in annual VaR by 2050, or around 0.05 percentage points. As the VaR is an expected annual cost of climate-related damages, the increased technical premium costs would be incurred incrementally in each year. Similarly, the share, by value, of HRP in RMBS would increase by an average of 1.25 percentage points and by between 1.5 to 2 percentage points for a small number of securities by 2050 (Graph 4).

Overall, the ordering of RMBS by VaR does not materially shift in the 2050 scenario. For instance, the seven RMBS with highest current risk using the VaR index remain the same in 2050. This reflects the positive relationship between current risk and change over time; deals with greater exposure to physical risks today face a greater increase in these risks over time (Graph 5).

Impact on borrower leverage
Bellrose, Norman and Royters (2021) estimated that an increase in VaR of 0.4 percentage points is equivalent to roughly a 10 per cent decline in housing prices in real terms.[11] Assuming this relationship holds, in the above scenario this would equate to an average decline in housing prices of roughly 1.25 per cent across all RMBS, and 2 per cent for the RMBS with the largest VaR increase. We translated the potential decline in housing prices into an implied increase in borrower leverage for each loan in our sample, as measured by loan-to-value ratios (LVRs). Graph 6 presents these results for each RMBS, expressed as the sum of loan balances of high LVR mortgages (those with LVR > 80 per cent) as a proportion of the value of the total loan pool. These results suggest that higher physical risk could increase the proportion of high LVR mortgages in RMBS by 2.75 percentage points, on average, with this proportion increasing by 15 percentage points in one RMBS.

Notably, however, almost all loans that move into the high LVR category in this scenario have some level of lenders’ mortgage insurance (LMI) coverage, mitigating risks to RMBS noteholders. There is also considerable uncertainty in the likelihood of the high physical risk scenario and in the modelled effect on housing prices. We model housing price declines as a function of higher insurance premiums, ignoring other possible effects of physical or transition risk. Furthermore, these RMBS and their respective mortgage loan pools are unlikely to exist in their current form by 2050. Thus, as noted earlier, it is best to consider this exercise as akin to a stress test, rather than a prediction.
Features of RMBS with more exposure to climate risk
Table 1 presents characteristics of RMBS with high levels of climate risk, which we define as those with a VaR index value more than two standard deviations above the mean. These ‘high-risk’ deals are all issued by small banks, despite small bank-led deals constituting only about 20 per cent of all repo-eligible RMBS by number. These ‘high-risk’ RMBS possess a relatively high degree of loan concentration in non-metropolitan areas, reflecting the generally smaller geographic footprint and less diversified nature of small regional banks and credit unions. All ‘high-risk’ RMBS contain a heavy concentration of loans in at least one of four regional areas in Australia, highlighting the geographic concentration of climate risk. A number of these RMBS are held as collateral on the RBA’s balance sheet. However, the market value of this collateral represents only a small share – less than 0.1 per cent – of all domestic collateral held on the RBA’s balance sheet as of December 2023.
| Attribute | All RMBS | ‘High-risk’ RMBS(a) |
|---|---|---|
| VaR index | 0.20% | 0.40% |
| HRP index | 3.55% | 10.25% |
| Total repo collateral value(b) | $129b | $0.25b |
| Total face value(c) | $613b | $2b |
| Non-metropolitan loans share(d) | 27.2% | 72.9% |
| LMI insured loans share | 30.0% | 11.8% |
|
(a) RMBS with a VaR index value of more than two standard deviations
above the mean. Sources: RBA, Securitisation System, XDI-Climate Valuation. |
||
Relationship with other risk metrics
If RMBS loan pools with higher exposures to climate risk are also risky in other dimensions, then they may pose greater risk of losses to noteholders if climate risks are realised. Overall, we find no simple relationship between climate risk and conventional risk metrics, as summarised in Table 2.
Climate risk has a small positive relationship both with the proportion of loans located in non-metropolitan areas, and with geographic concentration. However, the relationship between climate risk and geographic concentration is not straightforward. For example, while RMBS issued by small banks feature higher levels of both climate risk and geographic concentration, non-bank issued deals have high geographic concentration, but relatively low exposure to climate risk. This may be because the mortgage pools underlying non-bank RMBS are largely concentrated in regions with lower climate risks, such as metropolitan areas. While not presented in Table 2, among banks that have issued both a self-securitised and marketed RMBS, the level of climate risk across the two deal types is similar.
| Risk metric | Large banks | Small banks | Non-banks |
|---|---|---|---|
| Climate risk metrics | |||
| VaR (%) | 0.196 | 0.209 | 0.193 |
| HRP (%) | 3.46 | 4.00 | 3.39 |
| Other risk metrics | |||
| Geographic concentration index(a) | −0.47 | 0.28 | 0.17 |
| LVR | 51.8 | 53.5 | 61.8 |
| Non-conforming (%) | 2.5 | 4.7 | 37.3 |
| LMI insured (%) | 35.4 | 46.2 | 15.3 |
| Seasoning (months) | 94.1 | 75.2 | 46.4 |
| >30 days arrears (%) | 1.14 | 0.49 | 2.17 |
| Non-metropolitan loans (%) | 26.8 | 39.8 | 24.9 |
| Number of deals | 94 | 64 | 106 |
|
(a) A positive value indicates higher geographic concentration than the mean, a negative value indicates lower concentration than mean. Appendix C provides further details on the measure of geographic concentration. Sources: RBA, Securitisation System, XDI-Climate Valuation. |
|||
Credit enhancement of RMBS more exposed to climate risks
While discussion of RMBS risk often focuses on the quality of the loan pool, structural features of RMBS play an equally significant role in determining the risks facing the noteholders of the security. Australian RMBS use multiple credit-enhancing features to mitigate risk (Arsov, Kim and Stacey 2015). A common form of credit enhancement is subordination, where mortgage loan losses are allocated to junior notes before senior notes; the junior notes are said to provide ‘credit enhancement’ to the senior note by shielding it from losses arising from the underlying pool. If rating agencies penalise climate risk exposure in their rating requirements, or if investors demand greater protection against climate risk, ‘at-risk’ RMBS would likely be structured with more credit enhancement. To investigate this, we estimated the regression model detailed in Appendix B.
The results from this exercise indicate that deals with a higher VaR index do not attract a higher level of subordination, perhaps suggesting that climate risk is not accounted for with higher credit enhancement or that climate risks are perceived to be small. In contrast, conventional credit quality metrics – such as the LVR, the proportion of non-conforming loans, and loans in arrears – have a statistically significant impact on credit enhancement in repo-eligible RMBS.[12]
Limitations
This analysis is a first attempt at quantifying climate risk present in RMBS and is subject to a number of limitations that may affect our findings and provide a basis for future research.
There are several factors that may lead our metrics to overstate the level of climate risk. The VaR measure excludes land values and so may overstate the level of housing price decline estimated under the user-cost framework. Also, current housing prices may already reflect some level of expected future climate risk, especially in high-risk areas where access to, and affordability of, insurance is a growing concern. In addition, risks in RMBS may change over time as lenders change their lending policies, including in response to rating agency and investor preferences.
This analysis may also understate climate risks in various ways. For privacy reasons, we assigned climate risk to a mortgage based on the average VaR of the property’s postcode. This smooths over the actual level of risk for each property, as within a postcode some properties are much more exposed to climate risk than others. Typically, mortgages sustain losses when both collateral values and borrower income decline (Read, Stewart and La Cava 2014). Severe natural disasters can have wider impacts in a region if economic activity is disrupted, which could reduce borrowers’ incomes. Longer term chronic climate change could also reduce borrowers’ incomes – for example, in regions affected by heat stress and associated declines in labour productivity. We also do not account for transition risk, which may have differing effects across regions on both incomes and property values, particularly in regions with high levels of employment in emissions-intensive industries. Finally, the future availability and affordability of property insurance is another factor that we have omitted from this analysis and could be considered in future work.
More broadly, there is considerable uncertainty around the likelihood of any specific scenario occurring and around predicting the impacts of a given scenario. In addition, we have explored only a small number of metrics for quantifying the risks of climate change. All this suggests a degree of caution is warranted when interpreting the results presented here.
Conclusion
In this analysis, we constructed two indices to assess physical climate risk in RMBS, which are eligible as collateral in the RBA’s liquidity operations. Our results suggest that RMBS with higher levels of physical climate risk tend to be issued by small regional banks and credit unions, rather than large banks or non-banks. In general, climate risk does not correlate with conventional credit risk metrics, but moderately correlates with some concentration risk variables, such as non-metropolitan loan concentration and geographic concentration.
Overall, the impact of increasing physical climate risk on housing prices for securitised mortgages is estimated to be small. We estimated, in a simple scenario analysis, that the expected increase in physical risks by 2050 would reduce average housing prices by no more than 2 per cent in all repo-eligible RMBS. This measure only captures housing price falls due to increased insurance costs from physical climate risks and ignores transition risk and other possible impacts of physical risk, such as reduced incomes. While the share of high LVR loans would increase in this scenario, the increase is small. Almost all loans that become (or remain) high LVR have some level of LMI, mitigating the increase in direct risks to RMBS noteholders.
Finally, we investigated the relationship between climate risk exposures and credit enhancement from the subordination of junior notes. Our analysis suggests that AAA-rated notes in RMBS with higher climate risk do not benefit from additional subordination of junior notes. This might suggest that securitisation markets have yet to fully incorporate climate risk exposures into their assessments of RMBS, or that climate risks are perceived to be small.
We note, however, that this is a first attempt at quantifying physical climate risk in RMBS and it is subject to several limitations. There is considerable uncertainty both in the construction of our measures of climate risk and in the future impacts of climate change. Future analysis could add to this work, for example by using more granular data to measure physical climate risk, better understanding how markets are currently pricing climate risk, or by extending the coverage to account for transition risks.
Appendix A: Risk metrics
For this analysis, we constructed two risk metrics. First, we created a VaR index as a weighted average of the postcode-level VaR of each mortgage in an RMBS, using the following equation:
where:
- B is the outstanding loan balance
- r is a given RMBS
- i is a given mortgage within an RMBS r
- VaR is the annual climate value-at-risk at postcode level.
For each mortgage in a given RMBS, we multiplied the outstanding loan balance by the average VaR of the postcode in which the underlying property is located and took the sum for all mortgages. This was divided by the aggregate outstanding loan balance of mortgages in the RMBS.[13]
Our second risk metric, the HRP index, measures the proportion of properties in an RMBS with a VaR exceeding 1 per cent, also weighted by value, using the following equation:
where:
- HRP is the proportion of mortgages in a postcode with VaR > 1 per cent
- other variables are as for the VaR index above.
Appendix B: Regression specification and output
The following log-log regression model was run to estimate whether RMBS with higher current VaR index values attract a higher level of subordination:
where, for each RMBS r:
- CEr is the original subordination of junior notes to unsubordinated notes
- ClimateRiskr is the VaR index for year 2020
- Xr is a set of quantitative loan pool risk metrics as of 31 December 2023
- Dr is a pair of issuer-type dummies indicating whether an RMBS is issued by a non-bank or a small bank
- Tr is a time dummy switched on for RMBS issued after the first Australian green RMBS issuance in 2018.
The full regression results are set out in Table B1.
| Predictors | Estimates |
|---|---|
| Climate risk | −0.12 |
| (0.914) | |
| LVR | 0.81*** |
| (0.004) | |
| Non-conforming | 0.08*** |
| (0.005) | |
| >30 days in arrears | 0.14* |
| (0.052) | |
| Geographic concentration | −0.12* |
| (0.069) | |
| Deal size | −0.10** |
| (0.022) | |
| Time dummy | −0.20*** |
| (0.002) | |
| Non-bank dummy | 0.34*** |
| (0.000) | |
| MLH bank dummy | −0.12* |
| (0.076) | |
| (Intercept) | −0.76 |
| Observations | 232 |
| R2 / R2 adjusted | 0.55 / 0.54 |
|
(a) *, **, *** indicates statistical significance at the 10, 5, and
1 per cent level respectively. P-values in brackets. Sources: RBA, Securitisation System, XDI-Climate Valuation. |
|
The results indicate that non-bank-issued RMBS attract a higher degree of credit enhancement, and the opposite is true for those issued by small banks. These results are consistent with markets perceiving RMBS that are issued by prudentially regulated entities to possess loan pools that are originated with higher quality lending standards. RMBS issued since the time dummy cut-off in 2018 (when the first green RMBS was issued in Australia) are structured with less credit enhancement. This possibly indicates a softening of subordination requirements in the market over the sample issuance range, though other factors might explain this reduction, such as Australian regulators’ housing lending policies (RBA 2018). We leave future research to investigate this further.
Appendix C: Measuring geographic concentration
The geographic concentration index used in this analysis measures the degree to which loans in an RMBS are geographically clustered. It is normalised such that an RMBS with mean concentration would have a value of 0 and the distribution has a standard deviation of 1. The index for a single RMBS takes the form of a gravity model:
where dij measures the straight-line distance between each pair of properties i and j in the deal. Each of these inverse distances are weighted by the geometric mean of the gross loan balance for each property.
Although a granular measure, a limitation is that geographic concentration is considered only through the lens of physical distance. A more robust approach might also consider how the distribution of loans compares against the distribution of properties across Australia.
Endnotes
The authors are from the Risk and Compliance and Financial Stability departments. They would like to thank Mark Hack, Chris Stewart, Andrew Sewell and other colleagues for their helpful input. Thanks also to XDI-Climate Valuation for providing the climate risk data used in this analysis. [*]
Self-secs are created by authorised deposit-taking institutions (ADIs) specifically to be offered as collateral to the RBA. Self-secs are only eligible as collateral where a related-party exemption has been granted for specific purposes, such as for Exceptional Liquidity Assistance or the Term Funding Facility (RBA 2024). [1]
Climate-related financial risks are typically broken down into physical risks, arising directly from changing weather and climate patterns, and transition risks arising from changes in policy, technology, or investor and consumer preferences. Contat et al (2023) survey recent literature on climate risks to real estate, while Eren, Merten and Verhoeven (2022) provide an overview of the pricing of climate risks in financial markets. [2]
For more information about structural features of Australian RMBS, see Arsov, Kim and Stacey (2015). [3]
Actual insurance premiums paid by homeowners are comprised of both hazard and non-hazard costs and would therefore be higher than the estimated VaR. Actual premiums also differ from the estimated technical premium due to factors such as consumer preferences, insurers’ varying product offerings and incorrect pricing (Paddam, Liu and Saroop 2023). [4]
These are coastal inundation, cyclone wind, extreme wind, forest fire, riverine flooding, soil subsidence, and surface (flash) flooding. [5]
This is calculated as the average across all 2,639 postcodes in the XDI-Climate Valuation data, weighted by the number of properties in each postcode. As such, this average effectively gives equal weight to each property in Australia. [6]
The RCP 8.5 pathway describes a scenario where planetary warming increases by an average of 8.5 watts per square metre across the planet, resulting in a temperature increase of about 4.3˚C by 2100. This scenario is seen as unlikely by climate scientists, but may represent a world where the climate is more sensitive to emissions than currently assumed. We use this scenario as a stress test exercise. [7]
Since June 2015, the RBA has required that detailed information about an asset-backed security’s structure and underlying assets be made available for the security to be eligible as collateral in the RBA’s domestic market operations. Securitisation System data is available (free of charge) to permitted users, including for academic research. For more information, see Fernandes and Jones (2018). [8]
This is not strictly comparing like-to-like, as the Australia-wide VaR is calculated as an unweighted average. [9]
RMBS are issued out of a bankruptcy remote trust or company created solely to hold assets on behalf of secured creditors. We define large banks as ADIs that are subject to the Australian Prudential Regulatory Authority’s (APRA) Liquidity Coverage Ratio requirement. Small banks are smaller and less sophisticated ADIs that are subject to APRA’s Minimum Liquidity Holdings (MLH) requirement, while non-banks are other institutions that are not authorised to take customer deposits. [10]
The user cost framework proposes that prices are at their ‘fundamental’ value when ‘user costs’ are equal to the rental yield (Fox and Tulip 2014). Bellrose, Norman and Royters (2021) assume a starting rental yield of 4 per cent and use the forecast increase in VaR as the associated increase in the rental yield via increased insurance premiums. [11]
Notably, the model suggests that geographic concentration does not attract higher subordination, which stands in contrast to the stated methodology of rating agencies. A possible explanation is the difference in how geographic concentration is measured in the RBA’s internal model used in this analysis and how rating agencies assess geographic concentration. See Appendix C. [12]
The loan balance is defined as the sum of due principal, interest, any penalty interest and all other fees and costs charged to the loan balance. [13]
References
Arsov I, IS Kim and K Stacey (2015), ‘Structural Features of Australian Residential Mortgage-backed Securities’, RBA Bulletin, June.
Bellrose K, D Norman and M Royters (2021), ‘Climate Change Risks to Australian Banks’, RBA Bulletin, September.
Contat J, C Hopkins, L Mejia and M Suandi (2023), ‘When Climate Meets Real Estate: A Survey of the Literature’, FHFA Working Paper 2023-05, Federal Housing Finance Agency, August.
Eren E, F Merten and N Verhoeven (2022), ‘Pricing of Climate Risks in Financial Markets: A Summary of the Literature’, BIS Papers No 130.
Fernandes K and D Jones (2018), ‘The Reserve Bank’s Securitisation Dataset’, RBA Bulletin, December.
Fox R and P Tulip (2014), ‘Is Housing Overvalued?’, RBA Research Discussion Paper No 2014-06.
Paddam S, C Liu and P Saroop (2023), ‘Home Insurance Affordability Update’, Actuaries Institute Report, August.
RBA (Reserve Bank of Australia) (2018), ‘Chapter 5: Assessing the Effects of Housing Lending Policy Measures’, Financial Stability Review, October.
RBA (2024), ‘Eligible Securities’.
Read M, C Stewart and G La Cava (2014), ‘Mortgage-related Financial Difficulties: Evidence from Australian Micro-level Data’, RBA Research Discussion Paper No 2014-13.