Bulletin – June 2016 Australian Economy Why Has Retail Inflation Been So Low?
- Download the article 451KB
Abstract
Inflation in the price of retail goods has been surprisingly low for a number of years. The considerable depreciation of the Australian dollar over this period by itself would typically have led to higher retail inflation. This article considers whether the direct relationship between the exchange rate and retail inflation has changed, or if other developments in the retail supply chain can account for recent trends in retail inflation. There is little statistical evidence that the relationship between the exchange rate and retail inflation has changed. Discussions with retailers in the Reserve Bank's business liaison program suggest that an intensification of competition in the retail sector and firms' efforts to reduce costs along their supply chain are likely to have contributed to low retail inflation.
Introduction
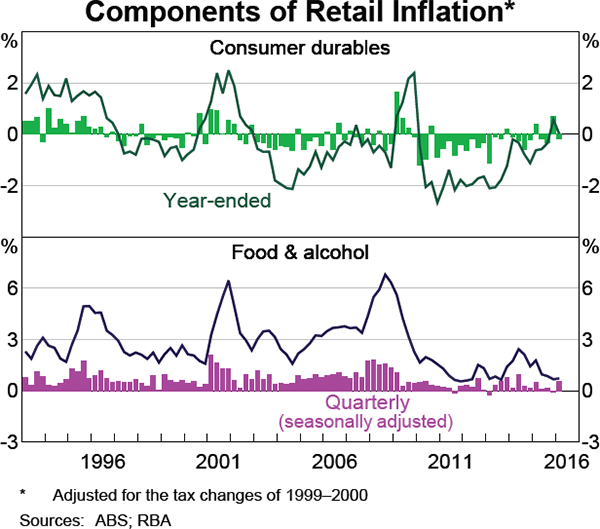
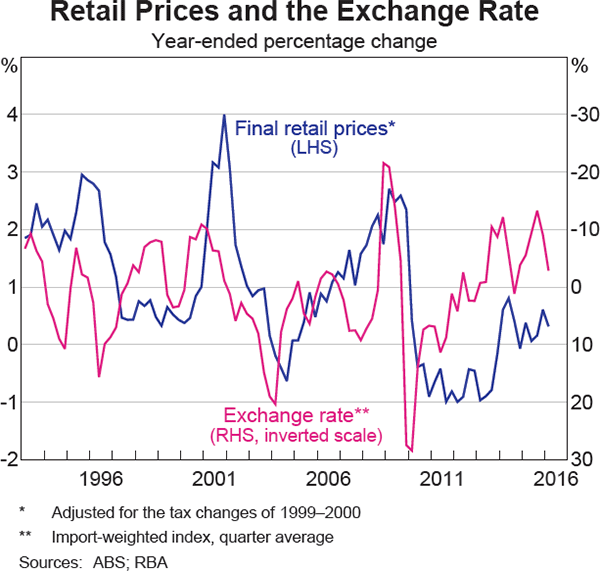
Retail goods in the consumer price index (CPI) include consumer durable goods, such as clothing, footwear and household appliances, as well as food and alcohol (Graph 1).[1] These items account for around 30 per cent of the total CPI basket and around 60 per cent of tradable items. The prices of tradable items, particularly retail goods, tend to be heavily influenced by the exchange rate as they are either imported or exposed to international competition. Indeed, prior to 2010, retail inflation moved relatively closely with changes in the import-weighted exchange rate (Graph 2). However, since 2010, retail inflation has been lower than expected, given the depreciation of the exchange rate since 2013. This suggests that either the nature of exchange rate pass-through may have changed or other factors have been placing downward pressure on the prices of these items.[2] This article explores potential reasons for this surprising weakness in retail inflation, focussing on the role of exchange rate pass-through and utilising information from the Bank's business liaison program to gain a better understanding of other factors that may be influencing prices in the retail sector.[3]
The Cost Structure of Retail Goods
D'Arcy, Norman and Shan (2012) describe a stylised version of the retail supply chain. Goods are produced by manufacturers, either in Australia or overseas, and transported to wholesalers. Wholesalers distribute these goods to retailers; retailers then sell them to consumers.[4]
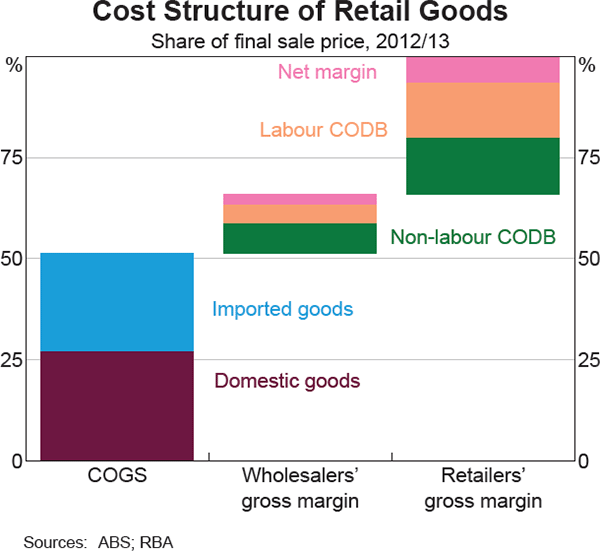
In this stylised process, the cost of getting retail goods to consumers has five major components. The price paid by the wholesaler, inclusive of any transport costs and tariffs, is the wholesaler's ‘cost of goods sold’ (COGS). The wholesaler incurs operating costs, including expenditure on staff, rent, freight and the cost of holding inventory, known as the wholesaler's ‘cost of doing business’ (CODB). Additionally, the wholesaler applies a ‘net’ or profit margin. As with the wholesalers, retailers face a range of operating costs (the retailer's CODB), most significantly labour and rent costs, and charge a net margin. The sum of the wholesaler's or retailer's CODB and net margin is their ‘gross margin’. Developments in each of these components have an influence on final retail prices. The magnitude of these costs in the retail supply chain can be estimated by using the Australian Bureau of Statistics' (ABS) input-output tables.
In 2012/13:
- COGS contributed to just over half of the final sale price of retail goods, with this cost roughly equally split between domestically produced and imported goods (Graph 3). Changes in the exchange rate principally affect retail prices through this part of the supply chain (discussed below).
- Wholesalers' gross margins comprised 15 per cent of final sales prices, with just over 2 per cent representing wholesalers' net margins.
- Retailers' gross margins accounted for the remaining 34 per cent of the final sale price, with 6½ per cent retailers' net margins and 13 per cent labour costs.
These contributions have been quite stable through time and are comparable with earlier estimates (D'Arcy et al 2012).
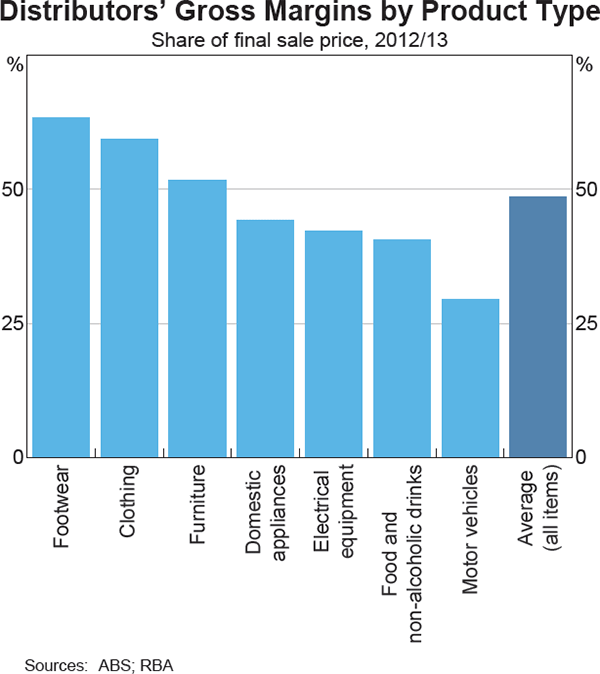
This analysis masks considerable differences in the cost structure of different types of retail goods. Gross margins charged by distributors (wholesalers and retailers taken together) vary across products and are determined by a range of factors, including the extent of competition and the speed with which distributors turn over stock (D'Arcy et al 2012; Graph 4). Therefore, changes in key determinants of costs, such as the exchange rate and wages, may have varying effects across products. Nonetheless, it is possible to identify trends across retail goods as a whole, and this framework can be used to examine why retail inflation has been surprisingly low over the past five years or so.
Has Exchange Rate Pass-through Changed?
The exchange rate has an important influence on the prices of retail items. The cost of imports accounts for one-quarter of the value of retail goods and is typically priced in foreign currencies. As such, movements in the exchange rate will affect the Australian dollar price that importers pay for these items. Over the past few years, the Australian dollar has depreciated by around 20 per cent on an import-weighted basis, which has placed upward pressure on COGS by making imports more expensive in Australian dollar terms. All else equal, a depreciation of the exchange rate also increases foreign demand for domestically produced goods, placing upward pressure on prices for domestically produced traded goods as well.[5] Despite this, retail inflation has remained low, which raises the question of whether pass-through of exchange rate movements into final prices has diminished in recent years.
The divergence between import prices and final prices
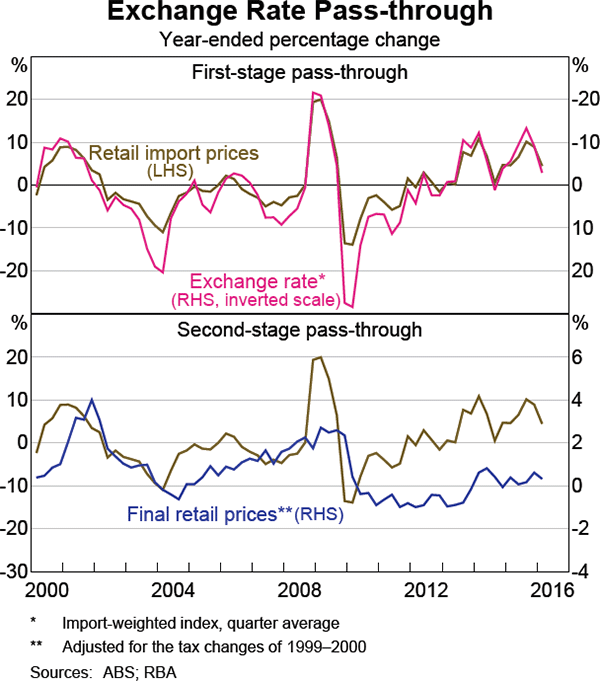
Exchange rate pass-through is usually considered in two stages: from movements in the exchange rate through to the Australian dollar cost of imports (first stage); and from the cost of imports through to final consumer prices (second stage). Since the exchange rate began to depreciate in mid 2013, first-stage pass-through to imports of retail items has been largely consistent with its historical relationship (Graph 5).[6] However, there appears to be a marked divergence between inflation in import prices and final prices for retail goods beginning in 2010.
This divergence may be consistent with a change in second-stage exchange rate pass-through, which would indicate a change in firms' responses to exchange rate movements. However, as discussed above, there is a range of costs other than imported COGS that contribute to retail inflation within the retail supply chain; movements in these costs could also drive the divergence between import and final prices of retail goods. Hence, the relationship between import price inflation and retail inflation should be tested conditional on movements in the other determinants to assess whether the divergence is a change in second-stage exchange rate pass-through or something else. That is, the effects of movements in the exchange rate need to be disentangled from movements in other costs. This can be done by utilising a basic econometric model of retail inflation.
Testing for breaks in the determinants of retail inflation
To assess whether second-stage pass-through has changed, a model is estimated in which retail inflation is explained by: growth in the cost of labour needed to produce a unit of output (unit labour costs (ULCs)); import price inflation; and inflation expectations (see Appendix A for details). Although movements in the exchange rate can have a considerable impact on the final prices of retail goods, they usually take some time to pass through supply chains. To account for this, the model includes several lags of import prices. The inclusion of inflation expectations in the model captures the expected balance of supply and demand conditions. Because ULC growth, import prices, and inflation expectations are affected by international and domestic economic developments, the model should also account for the broader macroeconomic context in which the retail sector operates.
Although the model captures several principal drivers of retail inflation, other potentially important costs identified in the stylised supply chain presented earlier are omitted, such as non-labour CODB and net margins of retailers and wholesalers. Limited data are available on these other costs and are neither timely nor granular enough to provide a clear explanation for the relatively low retail inflation of late. If inflation in these costs is relatively stable over time, then this will be captured by a constant term in the model. However, if these costs change over time, the model will tend to exhibit bias.[7]
This simple model can be used to test for changes in the relationships between the explanatory variables and retail inflation. These tests find no statistical evidence of a change in the coefficients on import prices in late 2010. This suggests that the response of retail inflation to changes in import prices (and hence to the exchange rate) after 2010 are consistent with the relationship prior to that time.[8] In contrast, the tests find evidence of a statistically significant break in late 2010 for the constant term, the coefficients on inflation expectations and ULC growth individually, and for all variables jointly (Table B1).[9]
In summary, the results are consistent with a break in the dynamics of retail inflation in late 2010, but a break at this date is unlikely to be due to a change in exchange rate pass-through.
What has changed in retail inflation?
Given that the direct relationship between retail inflation and the exchange rate does not appear to have changed, this raises the question of whether changes in relationships with other variables can explain the lower-than-expected retail inflation outcomes since late 2010. To investigate this, the model of retail inflation is estimated over a shorter sample that ends prior to December quarter 2010 and the results are compared with the same model estimated over the full sample. The difference in the model coefficients estimated over the two samples shows that the response of retail inflation to ULC growth and inflation expectations is broadly similar before and after December quarter 2010 (Table 1). Therefore, although the tests found statistical evidence of a change in the relationships for these variables, the economic significance of this change appears to be small.
In contrast, the coefficient on the constant term, which is the average rate of retail inflation once movements in the other variables have been controlled for, is markedly different over the short sample. In particular, since late 2010 there has been a large downward shift in the average rate of retail inflation that cannot be attributed to inflation expectations, ULC growth or import prices.
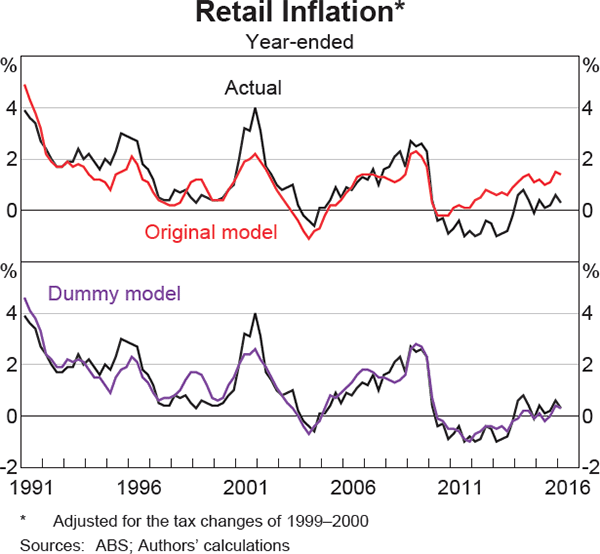
A break in the constant term can be remedied by the inclusion of a dummy variable that is equal to 1 from December quarter 2010 onwards, and 0 beforehand. The dummy variable captures the downward shift in retail inflation since late 2010, and markedly improves the fit of the model to the data (Graph 6). The estimated coefficient on the dummy variable is large, suggesting that retail inflation has been more than 1½ percentage points lower in year-ended terms (on average) since the December quarter 2010.[10] This suggests that variables not included in the model – such as domestic COGS, non-labour CODB or net margins – have been weighing on retail inflation, but it does not provide any insight into exactly which they might be. Nor does it imply that their effect on retail inflation will be permanent.
| Original model(b) | Short sample(c) | Dummy model(b) | |
|---|---|---|---|
| Constant | −0.24** | −0.07 | −0.06 |
| Inflation expectations | 0.12*** | 0.09*** | 0.10*** |
| ULC growth(d) | 0.17** | 0.18*** | 0.15** |
| Import prices(d) | 0.18*** | 0.17*** | 0.17*** |
| Dummy | −0.39*** | ||
|
(a) ***, ** and * represent statistical significance at the 1, 5 and 10 per cent
level, respectively, using Newey-West standard errors Sources: ABS; Authors' calculations |
|||
Other Determinants of Retail Prices
Given the limited data on other costs in the retail supply chain, such as changes in the non-labour CODB or wholesale and retail margins, insights from the Banks' business liaison program help to explain potential reasons for lower-than-expected retail goods inflation since 2010.
The cost of goods sold
Discussions with retailers across a range of market segments have confirmed that firms' COGS have increased due to the depreciation of the exchange rate. Nevertheless, there have been some other factors that have contributed to COGS inflation being somewhat weaker than the depreciation of the exchange rate alone would imply.
- Lower global prices for commodities, such as cotton, base metals and oil, have lowered input costs for manufacturers and transportation costs over the past few years.
- Excess industrial capacity has placed downward pressure on manufactured goods prices in China (RBA 2016).
- Some firms have been able to source imported products from lower-cost locations.[11]
Although these developments may be salient at the firm level, it is difficult to identify them in the data. In part, this could be because their effect on COGS is marginal relative to the large changes in the exchange rate over recent years. Retailers have indicated that, in general, they have been unable or unwilling to change their prices to fully reflect COGS inflation, indicating that there are other pressures in the retail sector contributing to low inflation.
Retail competition
Liaison with retailers suggests that over the period of interest, competition in the retail sector has intensified, partly due to increased supply. There are numerous sources of this increase in competitive pressures, although some key themes have emerged from liaison.
- Technology has enabled consumers to compare retail prices quickly and easily online and determine which retailer(s) are offering the lowest prices. The increasing online presence of traditional bricks-and-mortar retailers is contributing to this effect.
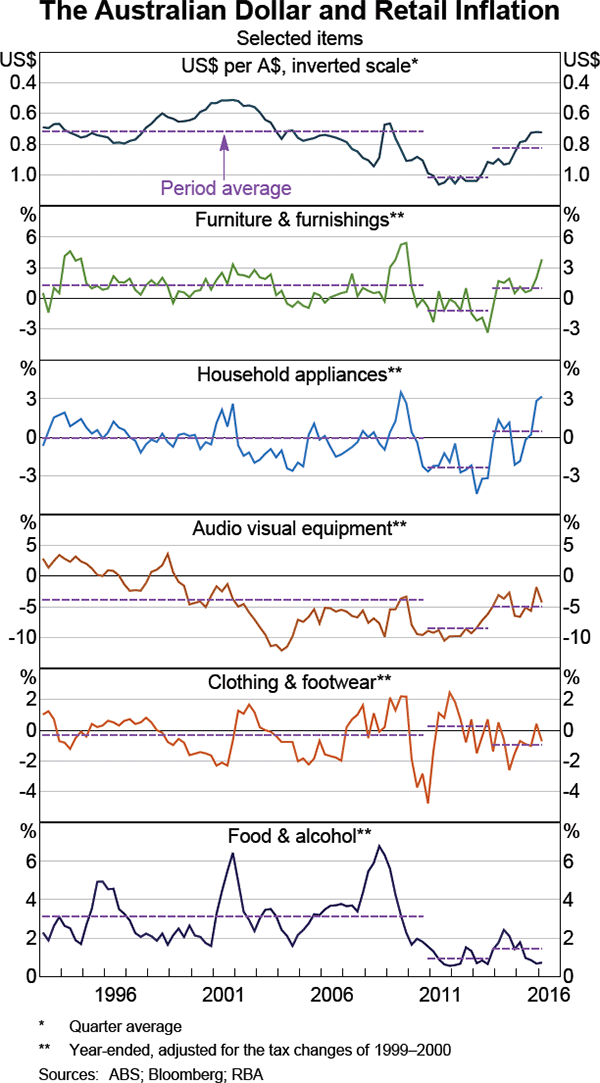
- Relatedly, the supply of retailers has increased due to competition from foreign online retailers. This was particularly evident over 2010–13 when the exchange rate was relatively high (Graph 7). Over this period, domestic retailers became relatively less competitive against competitors based offshore.
- Both established firms and new entrants, including international retailers entering the Australian market, are competing aggressively to gain market share.
In a number of market segments, liaison has attributed the increase in retail competition to the actions of a perceived ‘market leader’, which is generally looking to expand their market share, effectively increasing supply. This has led a number of retailers to report that they believe demand for their goods is very price sensitive, and fear that they will lose sales volumes if they increase prices. Earlier work on Australian retailers found that a majority of firms primarily set prices based on the balance of supply and demand factors, such as market conditions or competitors' prices, rather than setting prices as a fixed mark-up over costs (Park, Rayner and D'Arcy 2010).
Most market segments experienced lower inflation from 2010 (Graph 7). The identification of a break in retail inflation in late 2010 coincides with the timing of the Australian dollar reaching parity with the US dollar. Liaison suggests that competition from foreign sources was particularly pronounced at that time, possibly due to the ease with which domestic and foreign price differentials could be calculated. Since 2013, inflation has increased somewhat in most market segments, broadly consistent with the exchange rate depreciation. However, the data indicate that the apparel sector is a clear exception. Liaison suggests that competition for market share between established firms and new foreign entrants has been particularly strong in this segment. The data suggest that the effect of competitive pressures is likely to have restrained price inflation, despite rising COGS.
Evolving business practices
Heightened retail competition and the depreciation of the exchange rate appear to have contributed to a situation whereby COGS inflation is higher than retail goods inflation. This implies a compression of distributors' gross margins. To maintain profitability, retailers have had to adapt some of their business practices.
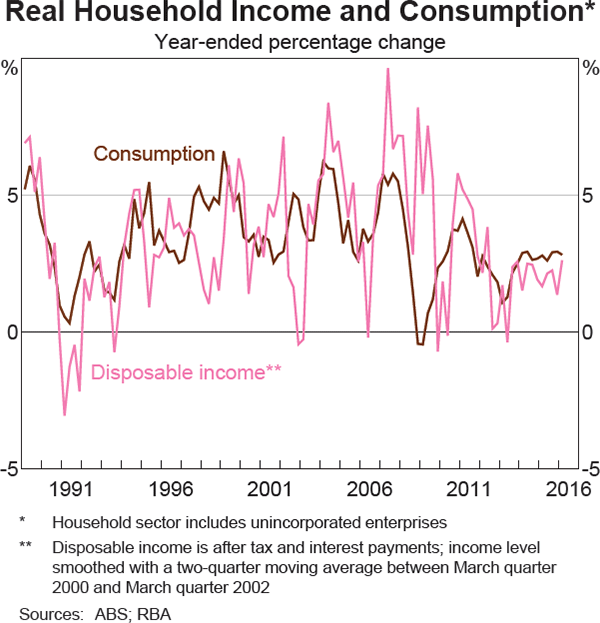
Some larger firms have lowered margins on each product, but are selling higher volumes. This allows firms to defray fixed costs and achieve greater economies of scale. This competitive pressure to reduce margins in order to try to gain market share has occurred over a period in which consumer demand has been relatively subdued, in part due to weak income growth, making it more difficult for firms to increase sales volumes (Graph 8).
Liaison with retailers has also highlighted renewed efforts by firms to find efficiencies to reduce their CODB. Labour costs are around half of retailers' CODB. Retailers have sought labour productivity gains through technological improvements, such as contactless payments systems, self-serve checkouts and better monitoring of staffing needs. Firms have also sought to lower their CODB by other means, such as bargaining for lower rents, improving inventory management, sourcing from fewer suppliers, partnering with other firms to lower distribution costs and centralising some administration tasks.
Conclusion
Retail inflation has been surprisingly weak for a number of years. There is little evidence of a change in the direct relationship between the exchange rate and retail prices, and liaison with retailers suggests that the cost of goods sold has indeed increased due to the depreciation of the exchange rate since 2013. Rather, retail inflation appears to have been constrained by a range of other developments in the retail supply chain. Intensification in retail competition, in part driven by foreign entrants, has compressed gross margins, and firms have sought cost reductions, including through labour productivity gains, to maintain profitability. These persistent developments appear to have gone some way to offsetting the rising cost of goods sold due to the exchange rate depreciation in recent years.
Appendix A
The model of retail inflation is a distributed lag model based on an expectations-augmented mark-up framework of consumer prices (for details, see Norman and Richards (2010)). The mark-up framework considers consumer prices as a proportional mark-up over costs, including unit labour costs and import prices to reflect input costs. The basic specification used in this article is:
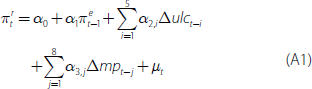
where  is quarterly retail inflation, α0 is the constant term,
πe
is inflation expectations as measured by the break-even rate on indexed bond yields
for a constant 10-year maturity, ulc is unit albour
costs (in log form), mp is import prices (in log form) and μ
is an error term.
is quarterly retail inflation, α0 is the constant term,
πe
is inflation expectations as measured by the break-even rate on indexed bond yields
for a constant 10-year maturity, ulc is unit albour
costs (in log form), mp is import prices (in log form) and μ
is an error term.
Appendix B
| Maximum Wald F-statistic | Corresponding p-value | Corresponding date | |
|---|---|---|---|
| All variables | 47.9 | 0.001 | 2010:Q3 |
| Constant | 36.6 | 0.000 | 2010:Q4 |
| Inflation expectations | 37.5 | 0.000 | 2010:Q4 |
| ULC growth(b) | 27.1 | 0.002 | 2010:Q4 |
| Import prices(b) | 14.4 | 0.538 | 2010:Q3 |
|
(a) Model sample 1990:Q1–2016:Q1; test sample 1994:Q1–2012:Q1
(i.e. 15 per cent sample trimming) Sources: ABS; Authors' calculations |
|||
Footnotes
The authors are from Economic Analysis Department and thank Rosetta Dollman for valuable input to this article. [*]
Fruit and vegetables are excluded in this article, as quarterly price movements in these items are especially volatile. [1]
For previous discussion of this divergence, see RBA (2013). [2]
The Reserve Bank business liaison team conducts around 70–80 discussions with contacts on a monthly basis. Discussions with any individual firm typically occur around every 6 to 12 months. Bank staff usually meet the chief executive officer, chief financial officer and/or operations manager. Liaison meetings are held with firms of all sizes, although most discussions are with mid-sized and large firms where conditions are more likely to reflect economy-wide trends rather than firm-specific factors. For more information, see RBA (2014). [3]
This is a stylised process because in some cases wholesalers may sell directly to consumers, or retailers may bypass wholesalers and directly source goods from manufacturers. [4]
A depreciation will also increase the (Australian dollar) export prices of domestically produced traded goods (which are priced in foreign currencies), placing upward pressure on the price of these goods in Australia. These goods, such as meat, account for a small share of retail goods and hence upward pressure on retail goods from the depreciation of the exchange rate is mostly due to prices of imports. [5]
This is in large part due to a mechanical relationship between import prices and the exchange rate; retail goods imports invoiced in foreign currencies are converted to Australian dollar terms at the current exchange rate when measuring import prices. The data also capture changes in the foreign currency price of retail goods, reflecting price movements driven by international developments unrelated to the exchange rate. Chung, Kohler and Lewis (2011) find that a 10 per cent depreciation in the exchange rate typically results in import prices increasing by around 8 per cent, and that most of this response occurs within the same quarter. These results hold over an extended sample. [6]
To the extent that any omitted variables are correlated with the explanatory variables included in the regression, the estimates will be biased. It is possible that breaks identified in the modelled relationships could be driven by changes in the relationship between an omitted variable and retail inflation. [7]
Quandt-Andrews tests trim a proportion of the data at the beginning and end of the model sample, where there are not enough observations to correctly estimate the test. This means the test sample does not include the period since the exchange rate began to depreciate in 2013. Thus, the tests cannot determine whether the response of retail inflation to the recent depreciation of the exchange rate is consistent with the historical relationship. [8]
The p-values for each of these tests indicate a less than 1 per cent chance of there being no break at the corresponding date. [9]
The dummy subtracts 0.4 percentage points from quarterly retail inflation, which is over 1½ percentage points annually. [10]
Distributors' hedging cover has also helped delay the exchange rate effect on COGS, although this is a transitory effect that only mitigates the timing of COGS inflation, and not the magnitude. [11]
References
Chung E, M Kohler and C Lewis (2011), ‘The Exchange Rate and Consumer Prices’, RBA Bulletin, September, pp 9–16.
D'Arcy P, D Norman and S Shan (2012), ‘Costs and Margins in the Retail Supply Chain’, RBA Bulletin, June, pp 13–22.
Norman D and A Richards (2010), ‘Modelling Inflation in Australia’, RBA Research Discussion Paper No 2010-03.
Park A, V Rayner and P D'Arcy (2010), ‘Price-setting Behaviour – Insights from Australian Firms’, RBA Bulletin, June, pp 7–14.
RBA (Reserve Bank of Australia) (2013), ‘Box B: The Recent Deflation in Consumer Durables Prices’, Statement on Monetary Policy, May, pp 57–59.
RBA (2014), ‘The RBA's Business Liaison Program’, RBA Bulletin, September, pp 1–5.
RBA (2016), ‘Box A: Recent Trends in Inflation in China’, Statement on Monetary Policy, February, pp 14–16.