Bulletin – December 2016 Payments The Cash Market
- Download 881KB
Abstract
The cash market is the market for unsecured, overnight loans between banks. The weighted average of interest rates on these loans is the cash rate, the Reserve Bank's operational target for monetary policy and an important financial benchmark. Over the past decade or so there have been a number of regulatory and payment system developments that have affected the cash market, coinciding with a decline in aggregate market turnover. This article examines these developments using newly available data on payment system activity.
Introduction
Banks borrow and lend the balances they hold in their Reserve Bank Exchange Settlement Accounts (ESAs) in the cash market.[1] These transactions are undertaken between banks on an unsecured basis for a term of one business day. ESAs, which must be in credit at all times, are used to settle obligations arising from interbank payments within the Reserve Bank Information and Transfer System (RITS), Australia's high-value payments system. Each business day, banks that hold more exchange settlement (ES) balances than they need (i.e. to settle their net payment obligations) can lend the surplus in the cash market to banks with a shortfall.
The (annualised) weighted-average interest rate on these unsecured interbank loans is the overnight ‘cash rate’, which is the Reserve Bank's operational target for the implementation of monetary policy. The cash rate is an important benchmark in Australian financial markets, used as the reference rate for Australian dollar overnight indexed swaps and the Australian Securities Exchange's 30-day interbank cash rate futures contract. The cash rate also underpins other wholesale and retail market interest rates in the economy. It, therefore, influences the behaviour of borrowers and lenders, economic activity and ultimately the rate of inflation.
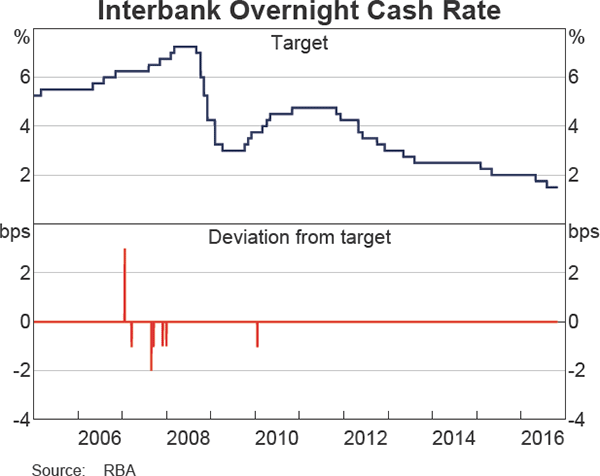
While the Reserve Bank does not directly participate in the cash market, it is able to control the aggregate amount of ES balances that are available for market participants to borrow and lend.[2] It does this by supplying enough ES balances through its open market operations, such that the demand for ES balances is satisfied at, or close to, the cash rate target. In recent years, deviations of the cash rate from the target determined by the Reserve Bank Board have been small and infrequent (Graph 1). The stability of this key policy rate relative to its target is one of the distinguishing features of the Australian financial system.[3]
Before May 2016, the Reserve Bank conducted a daily survey of banks to determine the amount and weighted-average interest rate at which they transacted in the cash market. From May 2016, however, the Reserve Bank has required banks to specify which of their transactions in RITS relate to cash market transactions. This has allowed the Reserve Bank to use RITS transaction data to directly observe individual cash market transactions and calculate the cash rate. This article uses the new RITS cash market transaction data, along with longer-run transaction-level estimates dating back to 2005 from the research of Brassil, Hughson and McManus (2016), to explore the evolving characteristics of the cash market, including the effects of recent regulatory and payment system reforms. Box A details the Reserve Bank's new methodology for calculating the cash rate.
Cash Market Arrangements
More than 50 banks currently hold ESAs at the Reserve Bank, including Australian banks and domestic branches of foreign banks. Not all ESA holders are regular participants in the cash market. Between 25 and 30 of these banks transact in the cash market on a typical day.
The Reserve Bank operates standing facilities to assist banks in managing their ESAs. While these accounts are not permitted to be in overdraft at any time, banks are able to borrow intraday from the Reserve Bank using repurchase agreements (repos), which do not incur an interest charge.[4] In addition, some banks are also required to hold higher overnight balances in their ESAs to cover potential payment obligations that arise after the close of the cash market.[5] These banks borrow a pre-determined amount of ES balances under ‘open’ RBA repos, which are contracted at the cash rate target and have no fixed maturity date.[6]
Towards the end of each day, banks may borrow in the cash market to obtain the funds necessary to cover the day's outgoing payment obligations and unwind any intraday repos contracted with the Reserve Bank. Banks with open RBA repo positions are also required by the end of the day to hold an amount of ES balances (adjusted for some after-hours payments) at least equal to their contracted open repo position. In the event that these requirements are not met, banks are effectively deemed to have borrowed these funds overnight from the Reserve Bank at an interest rate that is 25 basis points above the cash rate target.[7] This occurs very infrequently. Conversely, banks with ‘surplus’ ES balances (in excess of their open repo positions) at the end of the day are paid an overnight interest rate on these surplus balances equal to 25 basis points below the target cash rate.[8] These remuneration arrangements on surplus ES balances are set by the Reserve Bank to provide an incentive for banks to transact in the cash market within a 50 basis point ‘corridor’ centred on the cash rate target.
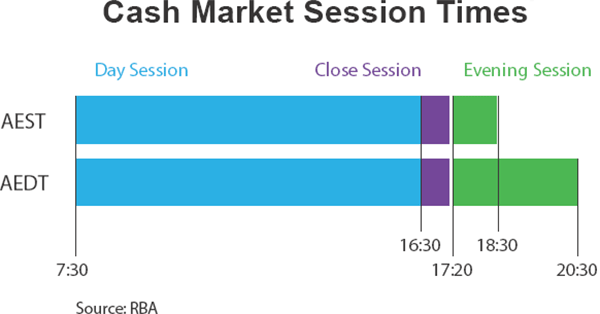
While most bank customers can initiate transactions electronically on a 24/7 basis, the settlement of interbank obligations arising from these transactions is carefully managed. The cash market operates each day that RITS is open for interbank settlement, from 7.30 am (when RITS opens) until 6.30 pm Australian Eastern Standard Time (AEST) or 8.30 pm Australian Eastern Daylight Time (AEDT; Figure 1). The closing time of the cash market is determined by Continuous Linked Settlement (CLS) foreign exchange-related payment flows, which occur in the European morning. There are a few weeks of each year where the cash market closes at 7.30 pm.[9]
Within the trading day there is a ‘Day Session’ until 4.30 pm, during which most interbank loans from the previous day are repaid. In the ‘Close Session’ (4.30 pm to 5.15 pm) banks' existing customer transactions can be settled but new customer transactions cannot be initiated in RITS. As a result, banks can use this period to trade in the cash market with greater certainty over their end-of-day positions. A large share of daily cash market turnover occurs during the Close Session. There is also an ‘Evening Session’, which commences after 5.20 pm when around 20 ‘Evening Agreed’ banks contract and settle any interbank transactions that may be required. Australian CLS members are required to participate in the Evening Session. All banks have the option of being an ‘Evening Agreed’ bank.
Trends in Cash Market Activity
This section describes some trends in the cash market. Prior to May 2016, the data are based on cash market transactions in RITS that were identified based on an algorithm developed by Brassil et al (2016). The algorithm matches loans and repayments between the same counterparties, where the second transaction goes in the reverse direction to the first and is equal to the loan principal plus a plausible amount of interest. The algorithm is also able to identify loans in which a lender and borrower agree to extend a loan by one business day (a ‘rolled’ loan). From May 2016, the data are based on the cash market transactions observed by the Reserve Bank.
Aggregate trends
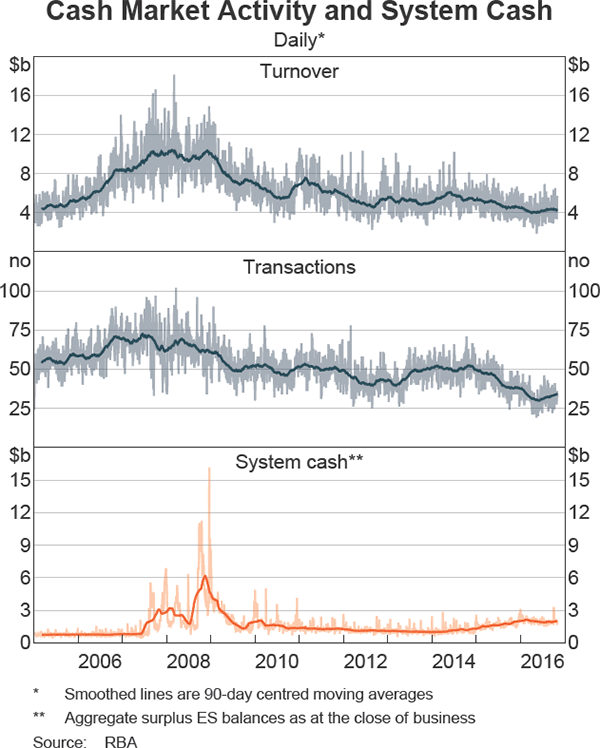
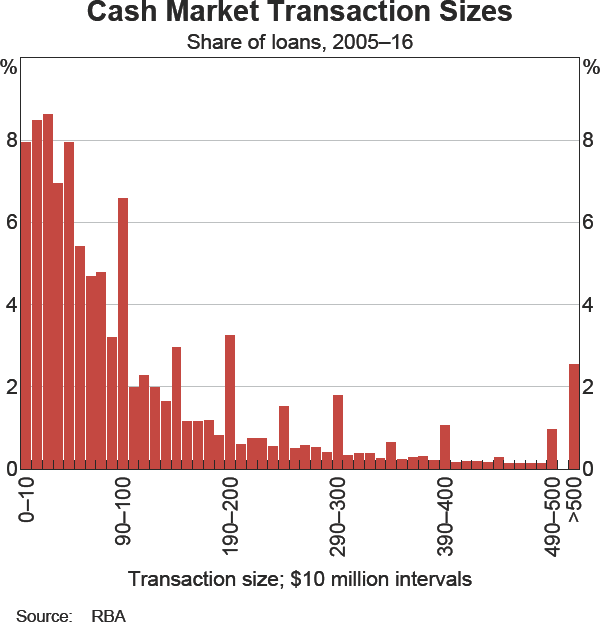
Cash market turnover currently averages around $4 billion each day, with an average of around 30 transactions (Graph 2, top and middle panels). During the global financial crisis, average daily turnover was around $10 billion; however, this has since more than halved and is now around levels observed prior to the crisis. The average number of daily transactions has also declined over this period, and is now lower than during the pre-crisis period. Although the median transaction size has increased since 2005 (from $50 to $70 million), the distribution in transaction sizes has been little changed over time. The majority of interbank cash loans have consistently been for amounts of less than $100 million, with loan sizes more frequently clustered in multiples of $50 million (Graph 3).
The positive correlation between cash market activity and the level of surplus ES balances (also known as ‘system cash’) has changed more recently. During the financial crisis, system cash increased significantly alongside rising cash market turnover (Graph 2, bottom panel). System cash returned to more normal levels in the years following the crisis, but began rising in 2014, initially associated with a small increase in cash market turnover. Since 2015, this correlation has reversed, with turnover declining alongside a rise in system cash. This mainly relates to the introduction of the liquidity coverage ratio (LCR) in January 2015, which requires banks to hold enough high-quality liquid assets (HQLA) to cover projected net cash outflows in a stressful situation over a 30-day period. In order to meet the requirements of the LCR, a few banks have preferred to hold ES balances as HQLA, making them less willing to lend these funds in the cash market. In some cases, the LCR treatment of the repayment leg of cash market loans can also increase net cash outflows, reducing the LCR and making unsecured lending less attractive compared to secured lending.[10] To accommodate this shift in preferences, the Reserve Bank has used open market operations to increase system cash.
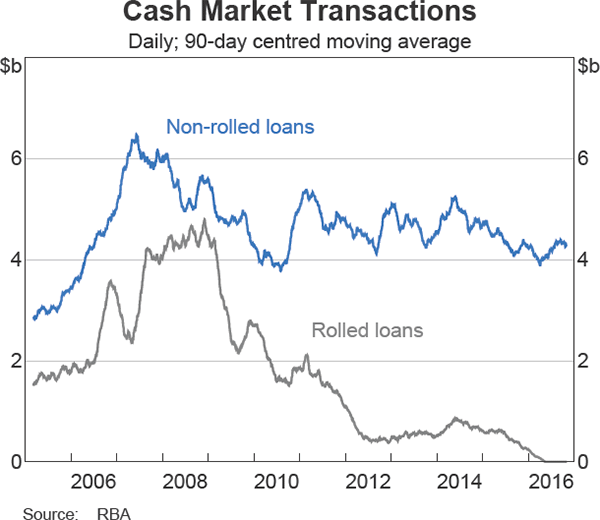
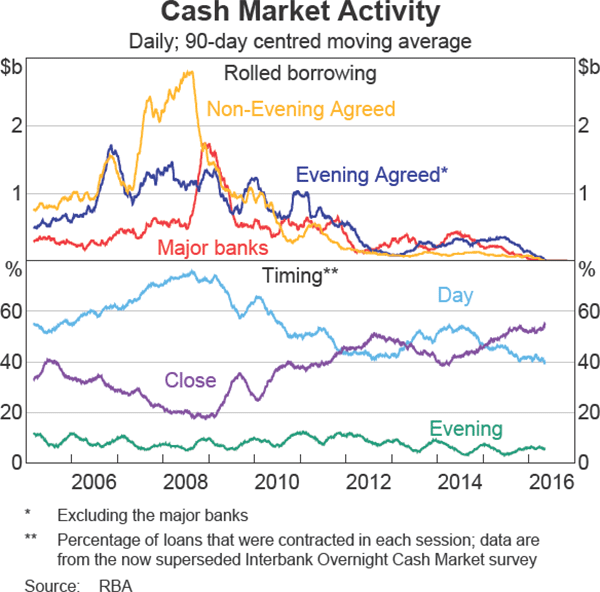
There has also been a significant reduction in loans that are rolled forward over the past few years (Graph 4; Brassil et al 2016). These increased during the crisis from 2007 to 2009, coinciding with the increase in the aggregate supply of system cash made available by the Reserve Bank to meet banks' demand for liquid, risk-free assets. Borrowers were likely to have found it to be convenient to roll existing loans to keep their ES balances at a certain target level until uncertainty diminished. The increase in ES balances during this period also meant that there was less chance that the rolled funds would be required to meet payment obligations. The decline in rolled lending since the financial crisis is likely to reflect less precautionary borrowing in the cash market, as well as a more cautious approach by lenders toward counterparty exposure.[11] Rolled loans have now fallen to zero, as counterparties are now required to repay all first-leg loans in full the following business day, to be consistent with the new cash rate methodology that was introduced in May 2016.
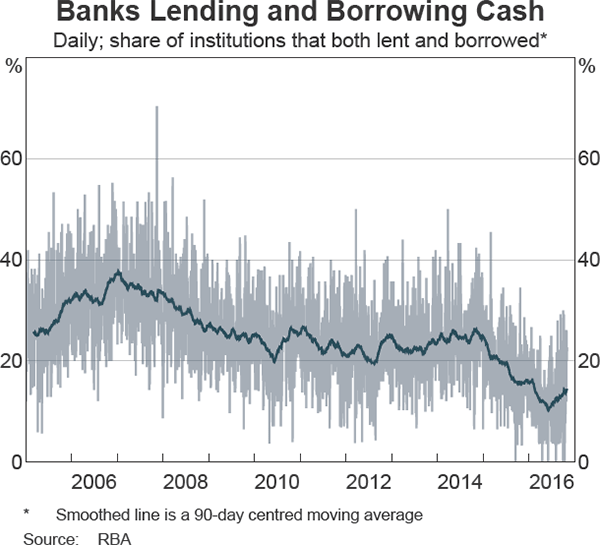
More conservative management of bank balance sheets since the financial crisis has also led to a reduction in ‘wash’ trades, which occur when one bank intermediates a transaction between two other banks that are unable to trade directly (for example, because the ultimate borrower had exhausted its unsecured credit limit with the initial lender).[12] While difficult to identify precisely, a proxy measure for wash trades is the number of institutions that are both borrowers and lenders on a given day, which has declined since 2015 (Graph 5).[13]
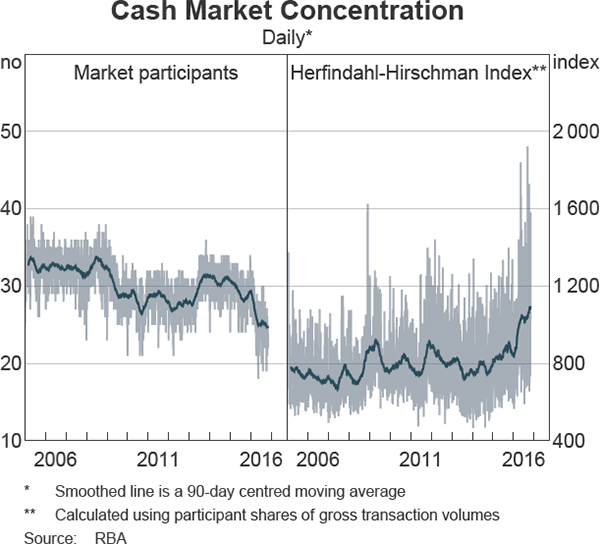
In line with the decline in turnover, the number of ESA holders that participate in the cash market has declined since the crisis. This trend is similar to what has occurred more broadly in the banking system, influenced by mergers and acquisitions as well as the withdrawal of some foreign banks from the Australian market. The downward trend in average turnover, transaction numbers and participation since 2005 suggest that the cash market has become increasingly concentrated (Graph 6). The Herfindahl-Hirschman Index (HHI) is a commonly used measure of market concentration; it is an index that measures the size of firms in relation to the market. The HHI for gross transaction volumes has been broadly steady over most of the period, although it has risen more recently. An HHI of around 1,000 or below indicates a low level of market concentration.[14]
Market composition and timing
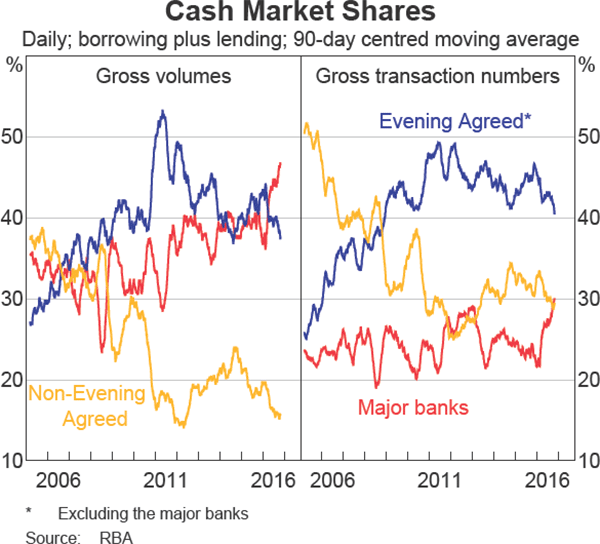
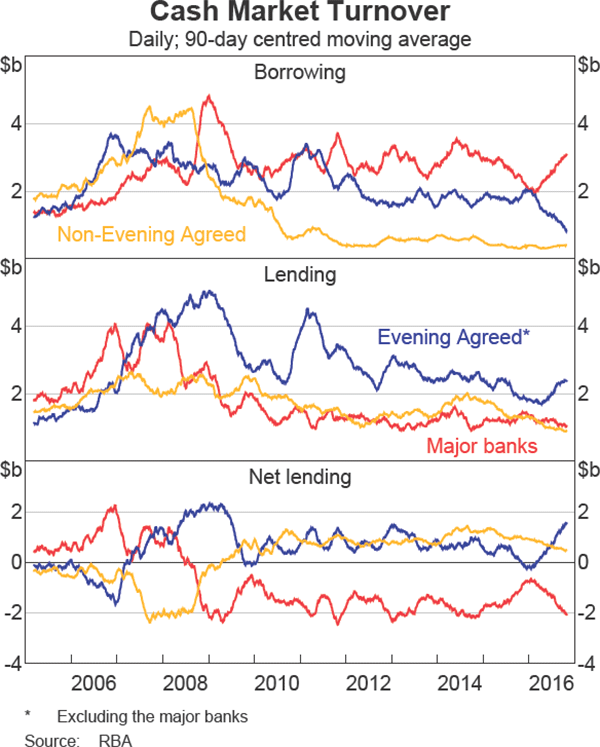
The share of gross turnover accounted for by the four largest Australian (major) banks has increased in recent years, with these banks currently accounting for over 40 per cent of turnover in the market (Graph 7). Other Evening Agreed banks also account for around 40 per cent of turnover, while non-Evening Agreed banks now account for a small share of gross turnover in the market. Despite their large share of overall turnover, the major banks only account for around one-quarter of the number of transactions in the market, as these banks typically transact in volumes of a larger size.
While an individual bank can be either a lender or borrower on any given day, some banks are more likely to be lenders or borrowers on average. Prior to the financial crisis, the major banks lent more funds in the cash market than they borrowed, on average (Graph 8). However, since the financial crisis, these banks have reduced their lending in the cash market significantly and are now net borrowers of cash. The reverse trend has occurred for non-Evening Agreed banks, with the substantial increase in borrowing observed during the crisis by these banks having unwound.
In more recent times, there has been a slight reduction in lending by non-Evening Agreed institutions. This may be related to some of these banks holding ES balances as HQLA (discussed earlier), and therefore being less willing to lend these balances in the cash market.
The reduction in activity by non-Evening Agreed banks since the financial crisis appears to be related to the exit of some foreign banks from the Australian market. These banks had represented a sizeable share of market activity prior to and during the financial crisis, and were the main institutions that utilised rolled borrowing during this period (Graph 9, top panel). The decline in rolled borrowing also coincided with a fall in the share of cash market transactions contracted (or agreed) earlier in the trading day (Graph 9, bottom panel).[15] Rolled loans were typically contracted earlier in the day, around the same time as loan repayments, as the decision to roll a loan would need to be agreed in advance of repayment (Brassil et al 2016). In addition, non-Evening Agreed banks usually have greater certainty about their end-of-day positions at an earlier stage, and are therefore more willing to undertake cash market transactions in the Day session.
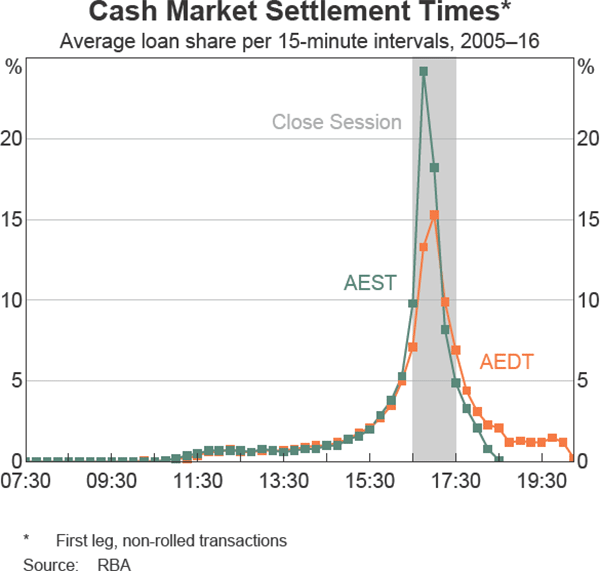
While the cash market transaction data from RITS do not contain information on when loans were contracted, they show that non-rolled loans typically settle relatively late in the day (Graph 10). As noted earlier, this reflects the reluctance of most banks to lend cash until they are relatively certain of their daily liquidity requirements, and to avoid the need to borrow large amounts in the cash market late in the day to meet late unforeseen payments. Liquidity managers may also be concerned that very large net outflows are logistically more difficult to fund in the overnight unsecured market and that any failure to raise sufficient funds could require the use of the Reserve Bank's overnight repo facility (incurring a rate of 25 basis points above the cash rate target).[16]
The New Payments Platform (NPP) is scheduled to be implemented in late 2017. This will include a Fast Settlement Service (FSS), which will facilitate settlement of each individual payment in the NPP on a 24/7 basis. The impact of the FSS on activity in the cash market is uncertain, as it will depend on the volume of payments that migrate to the new system. Payments made in the Evening Session through the FSS will be treated in the same way as other payments settled when the cash market is closed, which means that they will be offset against open RBA repo positions and will not need to be funded in the cash market.
Conclusion
The cash market facilitates the settlement of interbank obligations across the payments system, and transmits the monetary policy decisions of the Reserve Bank to the wider economy. Over the past decade or so there have been a number of developments affecting this market. These include a fall in turnover, the introduction of open repo arrangements, a reduction in rolled loans and wash trades, and changes in market participation. The cash rate has remained consistently at or near its target level throughout this period. From May 2016, new transaction reporting requirements for the cash market within RITS have allowed the Reserve Bank to observe cash market activity directly, and use the transaction data as inputs in order to calculate the cash rate. The Reserve Bank continues to monitor conditions in the cash market closely.
Box A
Calculation of the Interbank Overnight Cash Rate
In May 2016, the Reserve Bank implemented a new methodology to calculate the cash rate. The new process involves the Reserve Bank accessing a considerably more detailed dataset, which includes the individual amounts and interest rates at which ESA holders transact in the cash market. Calculating the cash rate from individual transaction data aligns the benchmark closely with international best practice standards for financial benchmarks. These standards are set out in the International Organization of Securities Commissions' Principles for Financial Benchmarks, which comprise four elements: governance; quality of the benchmark; quality of the methodology; and accountability (IOSCO 2013).
The cash rate is derived from transaction data sourced from RITS, which now captures all relevant transactions in the market. These data, which include the individual amounts and interest rates at which banks transact in the cash market, allow the Reserve Bank to calculate the cash rate as the volume-weighted average interest rate at which cash market transactions are settled in RITS. The Reserve Bank uses cash market transactions between banks that settle any payments across their own ESAs.
Before May 2016, the Reserve Bank conducted a daily survey of the amount and weighted-average interest rate at which banks transacted in the cash market. All banks that settled payments across their own ESA participated in the survey, with the published cash rate equal to the average interest rate reported by surveyed banks, weighted by value. A shortcoming of this methodology was that there were discrepancies between aggregate borrowing and lending, due to reporting errors by institutions. While this did not affect the published cash rate, since it happened to have been reported to have traded at the cash rate target each day, it meant that the published volume of cash market activity was the average of the total funds borrowed and lent in the market. The new methodology for calculating the cash rate has also reduced the reporting burden of banks, since they no longer need to make daily survey submissions.
The introduction of the new methodology required some minor adjustments to the way some banks participated in the cash market. One important change was that rolled cash market loans were no longer permitted under the Australian Financial Markets Association Cash Conventions. All cash market transactions now require the full exchange of principal. In addition, all cash market transactions must now be settled as cash transfers in RITS (AFMA 2016); previously, a small percentage of loans were settled as cash transfers in the Austraclear system.
The Reserve Bank has also started publishing a Cash Rate Total Return Index (TRI), which members of the public can use as a benchmark with a (near) risk-free rate of return. The TRI measures the performance of an investment earning the cash rate, where interest is reinvested:
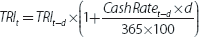
TRI = Cash Rate Total Return Index
t = a business day (a day that the cash market is open)
d = the number of days since the previous business day
The formula indicates that interest earnings are only paid and reinvested on business days. On non-business days, interest accrues at the cash rate of the preceding business day, but is not paid and reinvested until the next business day.
Further information on the calculation of the cash rate can be found in the Reserve Bank's Cash Rate Procedures Manual (RBA 2016).
Footnotes
The authors are from the Domestic Markets Department. We thank Anthony Brassil for his assistance in preparing the data for this article. [*]
Balances in ESAs are liabilities of the Reserve Bank and assets of the banks that hold them. Although they exist only as an accounting entry, exchange settlement balances are referred to as ‘cash’ as they are equivalent to physical currency for the purposes of settling payment obligations between ESA holders. They represent the most liquid form of monetary asset and comprise the ‘money base’ along with banknotes and coins (for which they can be exchanged). [1]
For details on the liquidity operations used by the Reserve Bank to manage the supply of ES balances, see Baker and Jacobs (2010). [2]
A cross-country comparison of monetary policy regimes in interbank overnight markets is given in Bech and Monnet (2013). [3]
A repo is economically, but not legally, equivalent to a secured loan. Counterparties provide eligible securities in exchange for cash on the agreement that these securities will later be ‘repurchased’ at an agreed price. The implied interest rate is the repo rate. Repos are the primary instrument used in Reserve Bank open market operations. [4]
These arrangements have been in place since the introduction of same day settlement of direct entry payments in November 2013. Direct entry is a means of making electronic payments, such as ‘pay anyone’ transactions using internet banking. Since 25 November 2013, these payments settle as part of multilaterally netted batches at 10.45 am, 1.45 pm, 4.45 pm, 7.15 pm and 9.15 pm each day. Before this, settlement occurred in one batch at 9.00 am the morning following the payment date. For more information, see Fraser and Gatty (2014). [5]
The size of these required balances takes into account each bank's historical after-hours payment patterns. The open RBA repos used to fund the ESAs involve no net cost for banks, as the interest rate charged on open repo is equal to the rate that the Reserve Bank remunerates banks on ES balances up to the amount of their open repo position; both rates are equal to the cash rate target. For more information, see Debelle (2013). [6]
In the case of open RBA repo shortfalls, the Reserve Bank pays overnight interest on these shortfall balances at a rate 25 basis points below the cash rate target. This imposes a cost equivalent to borrowing at 25 basis points above the cash rate target. [7]
Before the introduction of same-day direct entry settlement and open RBA repo in 2013, all ES balances held overnight were effectively ‘surplus’ ES balances. The introduction of open repo did not affect the amount of funds available in the cash market, as banks are now required to hold ES balances equal to their open RBA repo position in order to avoid borrowing overnight from the Reserve Bank. [8]
This is due to mismatches in the timing of the changeover to or from daylight savings time in Australia and Europe (RBA 2015). [9]
A 75 per cent cap on cash inflows relative to cash outflows is applied as part of the calculation of the LCR. If this cap is binding, it means that a bank lending in the cash market could not count the repayment of the overnight loan as an offsetting cash inflow. Secured borrowing and lending does not affect a bank's LCR, as ES balances are exchanged for securities that are equivalent HQLA. [10]
Non-rolled loans require borrowers to repay the loan before borrowing again. Rolling loans does not require the borrowing entity to demonstrate that it would have been able to repay the loan if it had not been rolled (Brassil et al 2016). [11]
Lower overall credit limits have reduced banks' willingness to participate in wash trades. Participating in a wash trade also increases net cash outflows of the intermediating bank without an associated net increase in HQLA, which would decrease its LCR (other things being equal). [12]
There are other reasons why a bank may be both a borrower and a lender on the same day (for example, it may borrow to fund payments that do not eventuate and then lend out its excess balances). However, most banks wait until they are reasonably certain of their liquidity position (and whether they will be a borrower or lender) before transacting in the cash market. This means that a reasonable proportion of instances where an institution is a borrower and a lender is likely to reflect wash trades. [13]
The HHI is calculated by squaring the market share of each firm competing in the market and then summing the resulting numbers. A higher score indicates that a market is more concentrated. The US Department of Justice generally considers markets in which the HHI is between 1,500 and 2,500 points to be moderately concentrated, with a score over 2,500 reflecting high concentration. For more information, see US DoJ (2010). [14]
Data showing when all loans (rolled and non-rolled) were contracted were obtained from the (now superseded) Interbank Overnight Cash Rate Survey. In contrast, RITS transaction data only indicates when non-rolled loans settled. [15]
Although the financial cost associated with surplus or shortfall ES balances at the end of the day is symmetric (plus or minus 25 basis points to the cash rate target), banks have demonstrated a preference for accepting the costs associated with surplus balances rather than those associated with shortfalls. [16]
References
AFMA (The Australian Financial Markets Association) (2016), Cash Conventions. Available at <http://www.afma.com.au/standards/market-conventions/Cash%20Conventions.pdf>.
Baker A and D Jacobs (2010), ‘Domestic Market Operations and Liquidity Forecasting’, RBA Bulletin, December, pp 37–43.
Brassil A, H Hughson and M McManus (2016), ‘Identifying Interbank Loans From Payments Data’, RBA Research Discussion Paper 2016-11.
Bech M and C Monnet (2013), ‘The Impact of Unconventional Monetary Policy on the Overnight Interbank Market’, in A Heath, M Lilley and M Manning (eds), Liquidity and Funding Markets, Proceedings of a Conference, Reserve Bank of Australia, Sydney, pp 147–177.
Debelle G (2013), ‘The Impact of Payments System and Prudential Reforms on the RBA's Provision of Liquidity’, Address to the Australian Financial Markets Association and Reserve Bank of Australia Briefing, Sydney, 16 August.
Fraser S and A Gatty (2014), ‘The Introduction of Same-day Settlement of Direct Entry Obligations in Australia’, RBA Bulletin, June, pp 55–64.
International Organization of Securities Commissions (IOSCO) (2013), ‘Principles for Financial Benchmarks: Final Report’, July. Available at <https://www.iosco.org/library/pubdocs/pdf/IOSCOPD415.pdf>.
RBA (Reserve Bank of Australia) (2015), Continuous Linked Settlement: RITS Session Times and Operational Arrangements Version 8.
RBA (2016), Cash Rate Procedures Manual.
US DoJ (United States Department of Justice and the Federal Trade Commission) (2010), Horizontal Merger Guidelines. Available at <https://www.ftc.gov/sites/default/files/attachments/merger-review/100819hmg.pdf>.