Bulletin – December 2016 Global Economy The Effect of Chinese Macroeconomic News on Australian Financial Markets
- Download 597KB
Abstract
Over the past two decades, economic and financial developments in China have become more important for the Australian economy in many ways. This article focuses on the effect of economic data releases in China on financial markets in Australia, and argues that Australian financial markets, particularly the Australian dollar, react more strongly to news about the Chinese economy than in the past.
Introduction
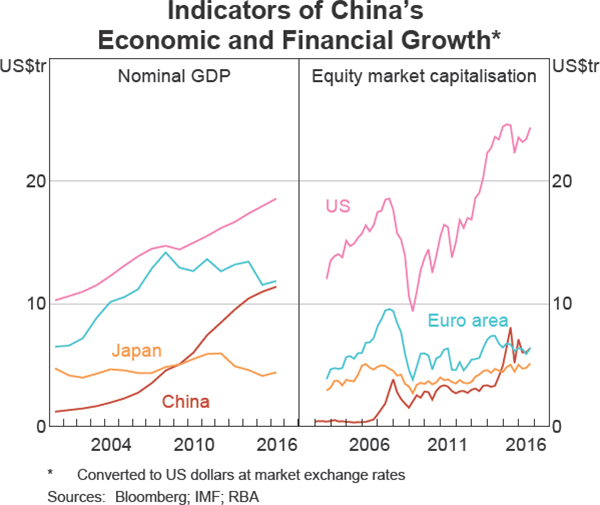
China has become an increasingly important part of the global economy over the past two decades. Its rapid economic growth has seen its share of world GDP more than double since 2000, along with a commensurate increase in its share of world trade (Graph 1). The size of China's financial markets has also increased substantially since the turn of the century, as has turnover in the Chinese renminbi (RMB) (Garner, Nitschke and Xu 2016).
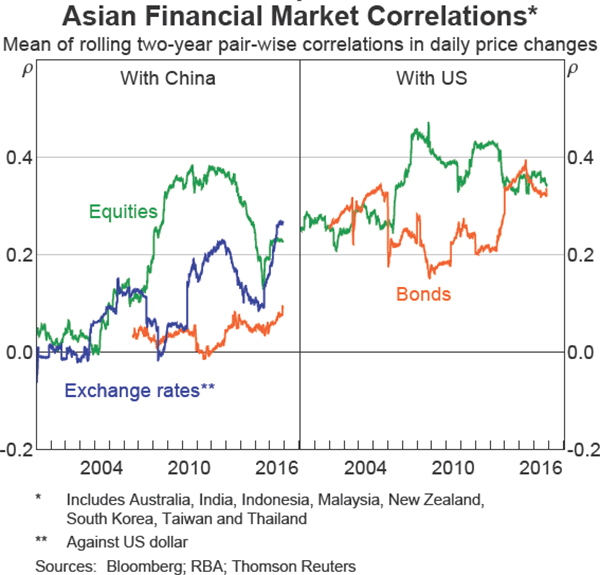
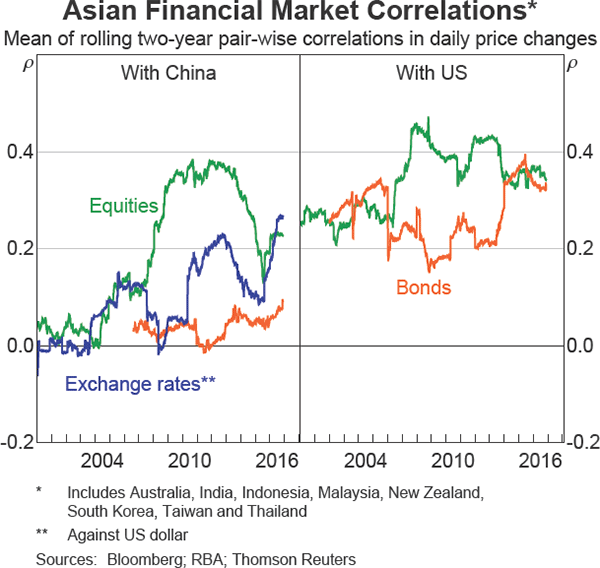
Alongside the increase in China's economic and financial size, there appears to have been an increase in the extent to which developments in China are affecting financial markets elsewhere. For example, in August 2015 the People's Bank of China (PBC) changed the way it determines the Chinese RMB's daily fixing rate against the US dollar.[1] This resulted in only a relatively small move in the exchange rate, but led to substantial volatility in global exchange rates and asset markets. More generally, over the past two decades co-movements (as measured by correlation coefficients) between Chinese financial markets and those elsewhere (including in Australia) have increased (Graph 2; Graph 3). Recent literature suggests that developments in China are increasingly affecting global financial markets. Several studies find that, after controlling for global factors, changes in Chinese asset prices explain a larger share of changes in Asian asset prices (including those of Australian assets) than they did in the past, and that this probably reflects growing trade (Arslanalp, Liao and Seneviratne 2016; Shu et al 2016).[2] And Roberts et al (2016) find that Chinese economic growth has had large effects on global commodity prices.
This article considers the effect of Chinese macroeconomic news on Australian financial markets. First, it discusses the channels through which economic news about China can affect financial markets in other countries, including Australia. It then attempts to quantify these ‘spillovers’ from China to Australia by focusing on one particular type of news: economic data releases. Releases of data measuring economic activity in China help financial market participants assess the state of the Chinese economy and, relatedly, the effect that might have on economies exposed to China, such as Australia. If data releases are different to expectations, they could be expected to result in immediate changes to financial market variables, such as equity prices, exchange rates and bond yields of exposed countries. We might therefore expect increasingly large movements in Australian financial markets around the time that Chinese economic data are released if developments in China are having a larger impact on Australia over time. We therefore focus on whether this effect has increased in size over time, in contrast to some other work on this topic.
Spillovers of Country-specific Shocks to International Financial Markets
Spillovers from one economy to the financial markets of another are often instantaneous, unlike spillovers to economic activity, which may take effect over several years. This is because financial market prices reflect market participants' expectations about future developments, and these expectations can be revised immediately upon receiving new information. These spillover effects can occur through different transmission channels, which can be categorised in two ways: whether they are direct or indirect, and whether they are due to economic or financial links (Table 1).
Direct economic links refer to trade exposures, where one economy exports or imports goods and services to or from another. For example, developments in a trading partner's economy are likely to have an effect on the earnings of firms that export goods or services there, and therefore the price of these firms' equity. As trade often involves transactions in different currencies, news about the trading partner's economy can also affect demand for the currency of the exporting economy and thereby affect exchange rates.
Direct financial links refer to cross-border investment, or capital flows. If residents in one economy own assets in another, they may buy or sell those assets due to developments in their own economy. For example, if a foreign residents' domestic income unexpectedly declines, they may sell foreign assets in response.
| Economic links | Financial links | |
|---|---|---|
| Direct channel | Trade | Capital flows |
| Indirect channel | Global commodity prices | Risk sentiment |
|
Source: Arslanalp, Liao and Seneviratne (2016) |
||
However, economies do not need to have direct links to have an effect on each other's financial markets. For example, a potential indirect economic channel for spillovers is via global commodity prices, which are affected by developments in larger economies and can therefore affect the financial markets of smaller economies that produce or consume these commodities, whether they have direct trade links to the larger economy or not.
Similarly, developments in large economies can have indirect financial effects on other economies' financial markets, as such developments might be expected to have material effects on global investors' confidence and appetite for risk, affecting the relative prices of different types of assets around the world.
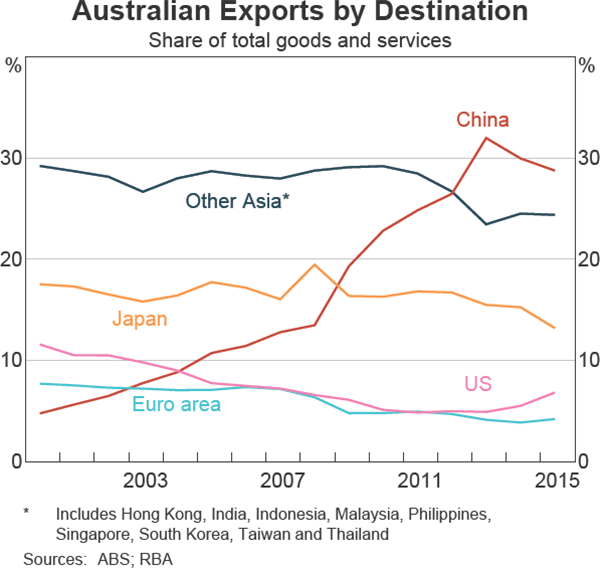
Economic links are likely to be the most important avenue for spillovers from China to Australia's financial markets, particularly via the direct channel. Australian trade with China has grown rapidly over the past decade, and exports to China now account for nearly 30 per cent of all Australian exports (Graph 4). Indirectly, demand from China also has a large effect on the prices of commodities that Australia exports, including to countries other than China. This means that developments in China often have implications for the profitability of Australian firms, the demand for the Australian dollar and the outlook for the Australian economy and monetary policy, all of which affect prices in Australian financial markets. Direct financial links between the two economies, while growing, remain limited due in part to China's still relatively closed capital account. However, indirect financial links are becoming stronger as developments in China increasingly affect global risk sentiment.
The Effect of Chinese Data on Australian Financial Markets
The different channels for spillovers suggest that Chinese economic data should have had an increasingly important effect on Australian financial markets as China's links with the Australian economy have grown. As noted above, economic data releases are useful for analysing these financial market spillovers, in part because they represent clearly defined shocks that can be thought of as originating in China. And their spillover effects can be estimated over a narrow window of time in which it can be assumed that little else is happening that would affect financial markets.
We estimate the effect of Chinese data releases on Australian financial markets using a simple model in which the volatility of the prices of Australian financial market instruments around the time when Chinese data are released is compared to the volatility at the same time on days when the data are not released, using data from January 2000 to November 2016.[3] Initially, we focus on the Australian dollar exchange rate against the US dollar (AUD/USD exchange rate), using a 20-minute window around the time of the data release, starting 10 minutes before and ending 10 minutes after the release.[4] We use an approach similar to that used in Edwards and Plumb (2009), which looks at the effects of US data releases on Australian financial markets. Specifically, an equation is estimated for the absolute change in the AUD/USD exchange rate around the release time (|Δp|), depending on a set of i dummy variables (denoted xi), which take the value 1 in periods when the data are released and 0 otherwise. The coefficient βi represents the estimated extra volatility around data release i, in addition to normal volatility in the market.

This approach does not control for the surprise content of a data release, which is what typically matters for financial markets, as some expectation for the outcome is embedded in pre-existing prices. Other similar analyses, such as D'Arcy and Poole (2010) and Baum, Kurov and Wolfe (2015), have used surveys of market economists to determine a consensus expectation, and then compared that to the data as released. But these surveys do not have particularly long histories for many Chinese data releases, and scaling the size of a surprise is difficult when the level and volatility of many Chinese economic statistics have changed over time. Instead, the approach used in this article implicitly assumes that the surprise content of Chinese economic data has stayed approximately constant over long periods of time.
The results suggest that Chinese data releases coincide with additional volatility in the AUD/USD exchange rate, and that this effect has grown substantially over time. Table 2 shows results for releases of quarterly Chinese GDP data and monthly ‘activity’ data, which includes data on fixed asset investment, industrial production and retail sales, all released at the same time. The estimated effects of economic data releases in the United States, which historically has been a key source of international economic and financial spillovers to Australia, are shown for comparison (full results for all data releases are in Table A1).[5] The values show the estimated additional volatility, in per cent terms, around the releases of these data series. The results are shown for the first and second halves of the sample, to provide an indication of whether the estimated effects have changed over time. On average, since 2008, the volatility of the AUD/USD exchange rate is higher by around 0.5 percentage points at the time of Chinese GDP data releases, and volatility is higher by just under 0.2 percentage points around the time of ‘other activity’ data releases.[6] These results are comparable with other similar studies, such as Baum et al (2015), for corresponding sample periods.
While the release of Chinese GDP data has a statistically significant effect on volatility in the Australian dollar over the whole sample, the change in estimated coefficients between the first and second half of the sample suggests that this is a relatively recent development: the coefficient estimated over the second half of the sample (2008–16) is large and statistically significant, while the coefficient estimated over the first half (2000–07) is much smaller and not statistically significant. Similarly, the coefficient for Chinese activity data is estimated to be insignificant from zero in the first half of the sample and somewhat larger and statistically significant over the second half of the sample. In contrast, the effect of US data, while particularly large in the case of the US labour force release, is not estimated to have changed much over this period.
| 2000–07 | 2008–16 | Full sample | |
|---|---|---|---|
| China GDP | 0.01 | 0.06*** | 0.05*** |
| China activity(b) | −0.01 | 0.04*** | 0.02** |
| US GDP(c) | 0.09*** | 0.05*** | 0.07*** |
| US labour force | 0.16*** | 0.20*** | 0.18*** |
|
(a) AUD/USD exchange rate, ** and *** denote statistical significance
at 95 and 99 per cent confidence levels, respectively, using bootstrapped
standard errors Sources: Bloomberg; RBA; Thomson Reuters |
|||
Another way to estimate how the influence of Chinese data releases on Australian financial markets has changed over time is to use rolling regressions, whereby the equation shown above is re-estimated on a five-year subset of data at the start of the sample, and then the estimation window is repeatedly shifted forward and the equation re-estimated. This helps to avoid issues around selection of the sample start and end points, which can affect the estimation results. However, reducing the sample size also means the coefficients are less precisely estimated.[7]
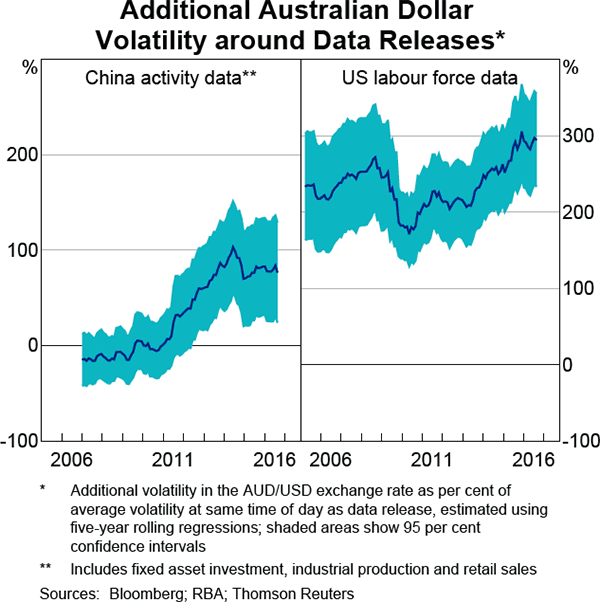
Similar to the results using a split sample, the rolling regressions show that the volatility in the Australian dollar exchange rate around Chinese data releases has increased over time, while the volatility around US data releases is little changed. Graph 5 shows the estimated additional effect of Chinese activity data on the volatility of the Australian dollar, expressed relative to normal volatility outside of release times. For example, a value of 50 per cent indicates that the volatility around the release of the data is 50 per cent higher than that observed at the same time on other days. The results suggest that the volatility around the release of Chinese activity data has increased substantially: in the early 2000s the movements in the Australian dollar around the releases were indistinguishable from its movements at other times, while more recently volatility has roughly doubled around times the Chinese activity data are released. In comparison, the estimated effect of US labour force data releases on volatility in the Australian dollar exchange rate is broadly similar to its value at the start of the sample period, though it appears to have declined somewhat and then picked up a bit more recently.
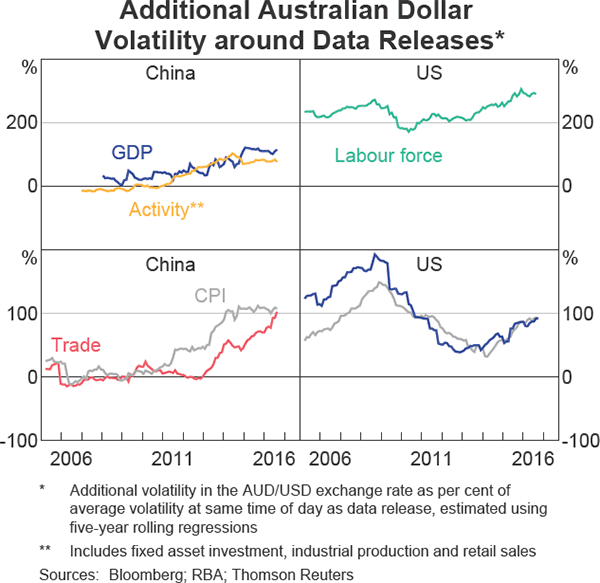
The same results hold for a range of other Chinese data releases, such as GDP, the Consumer Price Index (CPI) and trade (Graph 6). Towards the end of the sample, the increase in the volatility in the AUD/USD exchange rate around the time of these releases is estimated to be similar to that around the Chinese activity data releases, although this appears to be a slightly more recent development for the trade data. In contrast, additional volatility coinciding with the US GDP and CPI data releases appears to be broadly unchanged over the sample period; there is some variation in the middle of the sample but this is largely not statistically significant.
So far, the analysis presented here has focused on exchange rate volatility, but similar developments may have taken place in Australian domestic asset markets. To analyse this, a similar equation to the one above is estimated, using absolute changes in Australian government bond yields and equity prices as the dependent variables. Because Australian domestic markets are often not open when US data are released, futures market prices are used.
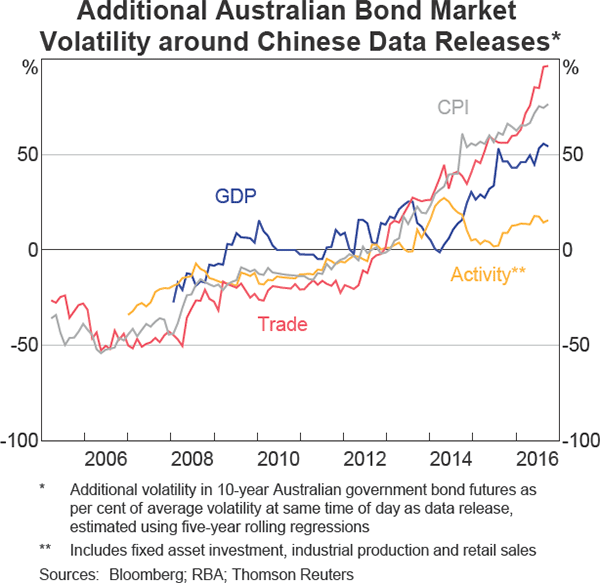
Overall, the results when using volatility in bond yields as the dependent variable are similar to the results using volatility in the exchange rate. The estimated effects of Chinese data releases are statistically significant towards the end of the sample and have trended up over time, particularly over the past decade (Graph 7). However, the effects are somewhat smaller, particularly for activity and GDP data: relative to typical volatility these releases appear to have about half the effect on volatility in bond markets that they do on volatility in the exchange rate. These broad results also hold when controls are added for interactions between the different markets; that is, controlling for the fact that changes in the price of one market might affect the price in another. This suggests that Chinese data are affecting the Australian bond market directly, rather than just affecting the exchange rate and, through this channel, spilling over to the bond market.
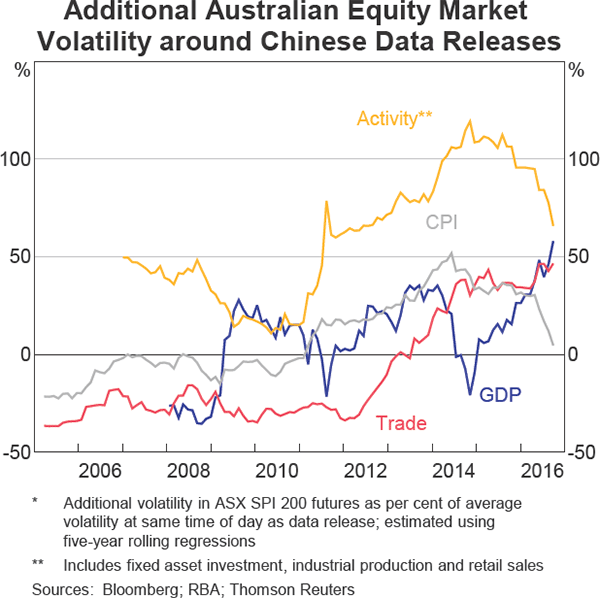
In contrast, results for equity markets are somewhat less clear: while the effects are typically larger in the latter half of the sample, they are less precisely estimated and generally smaller than those seen for bond yields and the exchange rate (Graph 8; Table A3). This may be, for example, because good news about exports to China for Australian firms is in part offset by an associated appreciation of the exchange rate, reducing the Australian dollar value of those exports, and therefore muting the equity market reaction to the news. Nonetheless, it is still the case that the effects of Chinese economic news on the equity market appear in some cases to be somewhat larger than they were in the past.[8]
Interpretation and Implications
The results presented here are consistent with the hypothesis that China's increased economic importance over the past two decades has led to greater spillovers to Australian financial markets via direct and indirect economic channels. In particular, the trade links between the two countries mean that news about the Chinese economy is important for assessing the prospects for Australian exports and the wider Australian economy. Similarly, China is a large source of global demand for commodities, such that news about the Chinese economy affects the prices of commodities that Australia exports globally, as well as to China. Indeed, the estimated effects in the rolling regressions appear to become larger around the same time that Australian exports to China picked up sharply and commodity prices rose in 2009–13.
However, there are a number of other reasons why the effect of Chinese data on Australian markets may have increased over time. One reason is that market participants have used Australian financial markets, particularly the Australian dollar, as a proxy to gain exposure to China. This is due to the fact that Chinese portfolio assets are still relatively difficult for foreign residents to acquire, and the renminbi is relatively tightly controlled (Ho, Ma and McCauley 2005). Given Australia's links to China, Australian assets might therefore be an easier way of gaining exposure to China, for either speculative or long-term purposes. This may have led to higher trading volume in Australian assets than would otherwise be expected and therefore potentially higher volatility around the time of Chinese data releases, and reflects an additional channel through which Chinese economic policies are affecting Australian financial markets. It is possible that the role of Australian assets as a proxy for Chinese assets will decline as China continues to gradually liberalise its capital account and exchange rate.
Another reason that Chinese data may be increasingly affecting Australian markets is that the information content of Chinese data releases may have risen. In particular, methodological improvements over time, both in the collection and reporting of data, could have made Chinese data a better guide to the state of the economy. In addition, Orlik (2011) argues that in the past Chinese data have sometimes been leaked or announced ahead of their official release time. This might mean that by the time the data are released, the information content has already been incorporated into financial market prices. If the prevalence of this has decreased over time, then it could be expected that volatility around the official release time would increase, even if the importance of the news itself is unchanged.
Moreover, the surprise content of Chinese economic data may have increased; that is, market participants are finding these data harder to anticipate than in the past. However, available surveys on economists' forecasts relative to the actual outcome show no clear trend, and Chinese economic variables have been relatively smooth in recent years, suggesting that it is unlikely to have become more difficult to forecast Chinese data.[9]
Conclusion
Australian financial markets are increasingly affected by news about China's economy. This is consistent with the large share of Australian exports going to China, the influence of Chinese demand and supply on global commodity prices and the importance of China to the global economy more broadly. As these factors continue to become more important, and China liberalises its capital account, the effect of Chinese macroeconomic news on Australian financial markets may increase further. These results therefore reiterate the importance of understanding developments in China for policymakers and financial market participants in Australia.
Appendix A
| 2000–07 | 2008–16 | Full sample | |
|---|---|---|---|
| China GDP | 0.01 | 0.06*** | 0.05*** |
| China activity(b) | −0.01 | 0.04*** | 0.02** |
| China trade | 0.01* | 0.03*** | 0.02*** |
| China CPI | 0.03*** | 0.04*** | 0.01 |
| US GDP(c) | 0.09*** | 0.05*** | 0.07*** |
| US labour force | 0.16*** | 0.20*** | 0.18*** |
| US CPI | 0.06*** | 0.05*** | 0.06*** |
|
(a) *,** and *** denote statistical significance at 90, 95 and 99 per
cent confidence levels, respectively, using bootstrapped standard errors Sources: Bloomberg; RBA; Thomson Reuters |
|||
| 2000–07 | 2008–16 | Full sample | |
|---|---|---|---|
| China GDP | −0.12 | 0.23 | 0.16 |
| China activity(b) | −0.07 | 0.01 | 0.00 |
| China trade | −0.04 | 0.18* | 0.07 |
| China CPI | −0.13 | 0.22*** | 0.09 |
| US GDP(c) | 0.32*** | 1.09*** | 0.66*** |
| US labour force | 0.39*** | 2.68*** | 1.29*** |
| US CPI | 0.36*** | 0.44*** | 0.39*** |
|
(a) Australian 10-year government bond futures; *,** and *** denote
statistical significance at 90, 95 and 99 per cent confidence levels,
respectively, using bootstrapped standard errors Sources: Bloomberg; RBA; Thomson Reuters |
|||
| 2000–07 | 2008–16 | Full sample | |
|---|---|---|---|
| China GDP | −0.04 | 0.07** | 0.04* |
| China activity(b) | 0.04* | 0.02 | 0.04** |
| China trade | −0.03 | 0.00 | 0.01 |
| China CPI | −0.03 | 0.00 | 0.00 |
| US GDP(c) | 0.04 | 0.09*** | 0.07*** |
| US labour force | 0.12*** | 0.24*** | 0.20*** |
| US CPI | 0.04*** | 0.03* | 0.04*** |
|
(a) ASX SPI200 futures; *,** and *** denote statistical significance
at 90, 95 and 99 per cent confidence levels, respectively, using bootstrapped
standard errors Sources: Bloomberg; RBA; Thomson Reuters |
|||
Footnotes
The author is from International Department. [*]
The fixing rate is the central rate around which the PBC allows the RMB to trade against the US dollar. [1]
An alternative explanation for an increase in correlations might be, for example, that China itself is increasingly affected by global shocks. [2]
The series of release times for some Chinese data releases starts slightly after the beginning of this period with the latest, GDP, beginning in 2003. [3]
Starting the window before the data are released allows for potentially thin trading conditions immediately before the data release, which might result in more volatile prices, as well as situations in which the data may have been known to market participants a short time before they were officially published. For example, Orlik (2011) argues that in China newspapers have occasionally published stories on new economic data before the official release time. All intraday price data are sourced from Thomson Reuters. [4]
The purchasing managers indices (PMIs) for China are another data release typically considered important by financial market participants and analysts; however, the relatively short time series means analysing its effect over time is impractical. However, consistent with other work (such as Baum et al (2015)), we find that China's PMIs have a statistically significant effect on the AUD/USD exchange rate over the time frame data are available. [5]
GDP data are typically released at the same time as activity data; the model used assumes that in these months the volatility is the sum of that caused by each release. [6]
For simplicity, the rolling regressions are calculated using heteroskedasticity-consistent standard errors rather than the bootstrapped errors used in Table 1; however, this was found to make little difference to the statistical significance of the results. [7]
Volatility in Australian bond and equity markets around US data releases appears to have increased slightly over time, particularly in the case of bond markets, although the increase is in most cases less than the increase seen around Chinese data releases (Table A2; Table A3). [8]
Another possible interpretation of the results is that the estimates are capturing some change in the underlying volatility of Australian financial markets around data or news events in general that is not specific to Chinese data, perhaps due to structural changes in markets such as regulatory reforms or the increase in algorithmic trading. However, the fact that the effect of US data on volatility in Australian financial markets has not similarly increased over the sample period suggests that the estimates are not a result of this effect. [9]
References
Arslanalp S, W Liao and D Seneviratne (2016), ‘China's Growing Influence on Asian Financial Markets’, IMF Working Paper No WP/16/173.
Baum C, A Kurov and MH Wolfe (2015), ‘What Do Chinese Macro Announcements Tell Us about the World Economy?’, Journal of International Money and Finance, 59, pp 100–122.
D’Arcy P and E Poole (2010), ‘Interpreting Market Responses to Economic Data’, RBA Bulletin, September, pp 35–42.
Edwards K and M Plumb (2009), ‘US Economic Data and the Australian Dollar’, RBA Bulletin, July, pp 9–16.
Garner M, A Nitschke and D Xu (2016), ‘Developments in Foreign Exchange and OTC Derivatives Markets’, RBA Bulletin, December, 63–74.
Ho C, G Ma and R McCauley (2005), ‘Trading Asian Currencies’, BIS Quarterly Review, March, pp 49–58.
Orlik T (2011), Understanding China's Economic Indicators, Pearson Education, Upper Saddle River, NJ.
Roberts I, T Saunders, G Spence and N Cassidy (2016), ‘China's Evolving Demand for Commodities’, in I Day and J Simon (eds), Structural Change in China: Implications for Australia and the World, Proceedings of a Conference, Reserve Bank of Australia, Sydney, pp 107–158.
Shu C, D He, J Dong and H Wang (2016), ‘Regional Pull vs Global Push Factors: China and US Influence on Asia-Pacific Financial Markets’, BIS Working Papers No 579.