Bulletin – March 2014 Finance Developments in Banks' Funding Costs and Lending Rates
- Download the article 1.1MB
This article updates previous Reserve Bank research on how developments in the composition and pricing of banks' funding have affected their overall cost of funding and the setting of lending rates (Deans and Stewart 2012; Robertson and Rush 2013). The main findings are that the absolute levels of banks' funding costs and lending rates have fallen over the past year, and spreads between these rates and the cash rate have narrowed marginally. The decline in these spreads largely reflects the shifts in the composition of banks' funding liabilities and the narrowing of wholesale debt spreads. Lending rates have tended to move in line with funding costs over the past 12 months.
Introduction
In setting lending rates, banks consider a number of factors. A key consideration is their cost of funding, which is a function of the composition and price of different liabilities (Fabbro and Hack 2011). Banks also take into account risk premia, including the credit risk associated with loans, and the liquidity risk involved in funding long-term assets with short-term liabilities. Banks' growth strategies, competitive pressures and the desire to provide a return to equity holders also affect banks' lending rates.
An important element in determining the overall cost of banks' funding is the level of the cash rate, which acts as an anchor for the broader interest rate structure of the domestic financial system. Nevertheless, changes in the level of compensation demanded by investors to hold bank debt, competitive pressures and non-price factors can exert significant influences on banks' funding costs. There is typically some delay before the full effect of changes in these factors flows through to funding costs and lending rates. In part, this reflects the time that it takes for balance sheet liabilities to be repriced, particularly those with longer terms to maturity. The Reserve Bank Board takes these developments into account when it determines the appropriate setting of the cash rate to ensure that the structure of interest rates faced by households and businesses is consistent with the desired stance of monetary policy.
Banks' Cost of Funding[1]
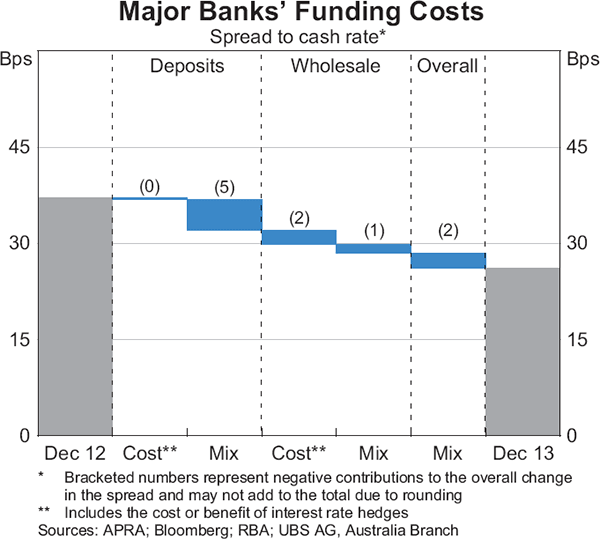
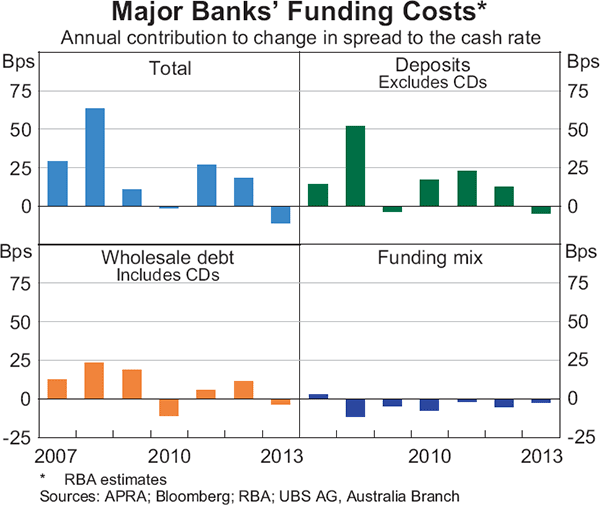
The absolute level of banks' funding costs is estimated to have fallen by slightly more than the reduction in the cash rate over 2013. The cost of deposits fell, while the cost of outstanding wholesale debt also declined, particularly in the latter part of the year. In addition, there has been a shift in funding toward slightly cheaper sources. Relative to the cash rate, the major banks' funding costs are estimated to have declined by about 11 basis points over the year (Graph 1). Nonetheless, funding costs relative to the cash rate continue to remain significantly higher than pre-financial crisis levels.
Deposit funding
Over 2013, the direct contribution of changes in deposit spreads to changes in banks' funding spreads was negligible. A decline in term deposit spreads was offset by increased spreads in other products, notably transaction accounts. Changes in the deposit funding mix, however, contributed 5 basis points to the overall fall in banks' funding costs relative to the cash rate, as funding shifted from relatively expensive term deposits to other accounts. The fall in the overall cost of deposits was in sharp contrast to the years immediately following the global financial crisis, where deposit market developments were often a key driver of the increase in banks' funding costs.
Deposit interest rates
The average spread of the major banks' advertised term deposit ‘specials’ over equivalent term benchmark rates decreased by about 50 basis points over the past year, and by about 100 basis points from its peak in mid 2012 (Graph 2). While the level of spreads is still high, the reduction in spreads has coincided with a decline in wholesale interest rates, as market conditions improved over the year (see ‘Wholesale funding’ below). The cost of outstanding term deposits relative to the cash rate has also declined.
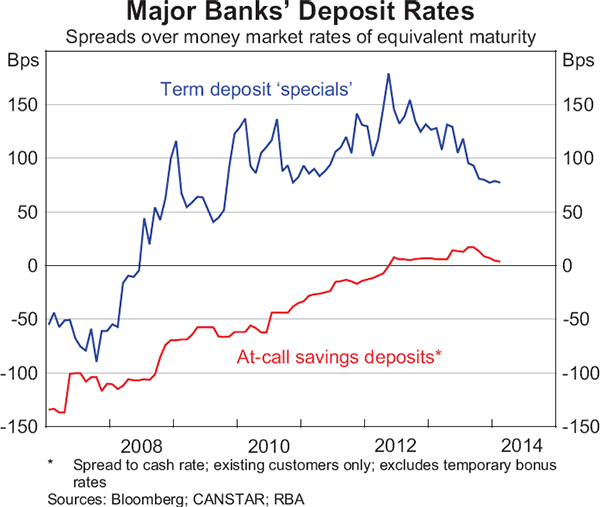
In contrast to term deposits, the pricing of at-call savings deposits has remained at elevated levels relative to its benchmark – the cash rate. As depositors have substituted away from term deposits, bonus saver accounts, in particular, have been an attractive alternative (Graph 3). These accounts are useful to banks because they are a relatively stable source of funding. This owes to their contractual requirements for minimum monthly deposits or limitations on withdrawals in order to receive a higher interest rate for that month. Moreover, these deposits may qualify for a similar liquidity charge to term deposits in the new Australian Prudential Regulation Authority's liquidity standards.[2] Although bonus saver deposits are estimated to currently represent less than 10 per cent of the major banks' deposit funding, their growth has been particularly strong since 2012 as the competition for these deposits has intensified, and interest rates on these deposits continue to remain elevated relative to the cash rate.
Traditional online savings accounts continue to offer interest rates close to the cash rate. In an attempt to attract deposit funding, some banks have continued to offer new customers of online saver accounts introductory bonus rates of interest.
Some banks have recently introduced new notice-of-withdrawal (NOW) accounts. These accounts require depositors to provide advance notice (generally a minimum of 31 days) of their intention to withdraw funds from the account in an effort to further increase their stable funding base, which in part has been driven by regulatory developments. Advertised interest rates for these accounts have been similar to those available for bonus saver accounts and some term deposit ‘specials’. Nonetheless, as a nascent product, NOW accounts currently only represent a small share of banks' total deposit funding.
For transaction accounts and some cash management accounts, the interest rates offered are generally close to zero. Hence, as monetary policy eased over the year, the difference between rates on these deposits and the cash rate increased by about 50 basis points. This increase is estimated to have contributed about 5 basis points to the major banks' funding costs relative to the cash rate, which offset some of the falling spreads on term deposits. Banks often attempt to buffer changes in the relative cost of transaction deposits by using interest rate hedges. However, the recent sustained low interest rate environment has led banks to roll over these hedges at rates that have increased the hedged cost of funding – that is, net payments to banks on new hedging contracts are estimated to be lower than net payments on expiring contracts.
Deposit mix
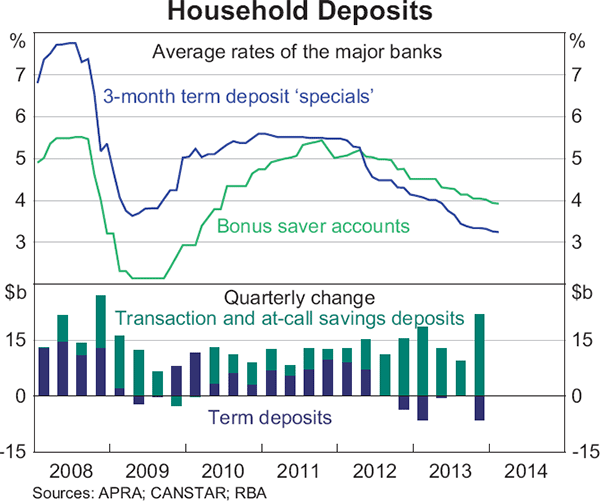
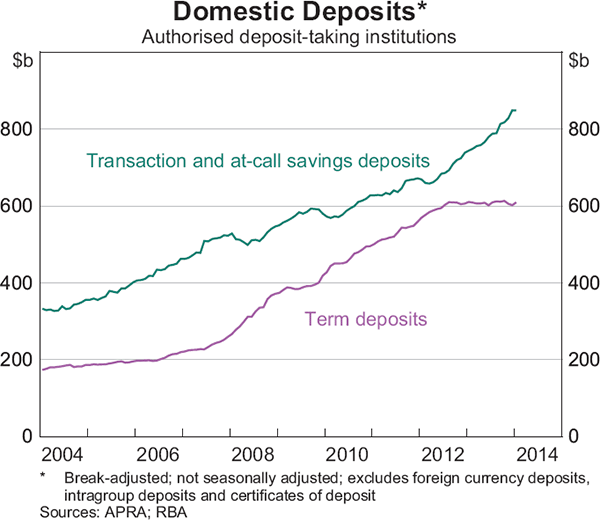
Since mid 2012, the level of funding from term deposits has been largely unchanged, while transaction and at-call savings deposits have continued to grow (Graph 4). Because the cost of outstanding term deposits relative to the cash rate is higher than most at-call savings deposits and all transaction deposits, this shift in the mix has lowered the cost of deposit funding. Banks have decreased their use of term deposits as the relative cost of new term funding from the wholesale market has become more attractive. Moreover, some depositors may have been reluctant to lock in fixed interest rates at low levels, particularly if their expectations of future interest rates differed from market expectations. Nonetheless, term deposits are still an important source of deposit funding, representing about 40 per cent of banks' total deposit liabilities.
Wholesale funding
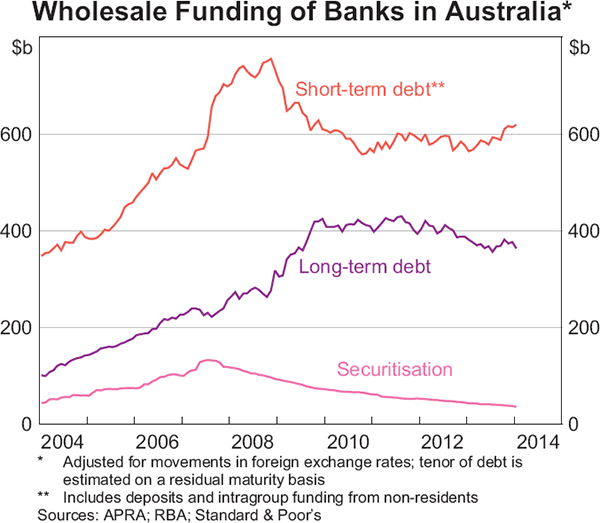
Changes in the overall cost of wholesale funding are estimated to have contributed about 4 basis points to the fall in the major banks' cost of funding relative to the cash rate. The composition and level of wholesale funding has been little changed over the past year as banks have continued to focus on funding new lending with deposits (Graph 5).
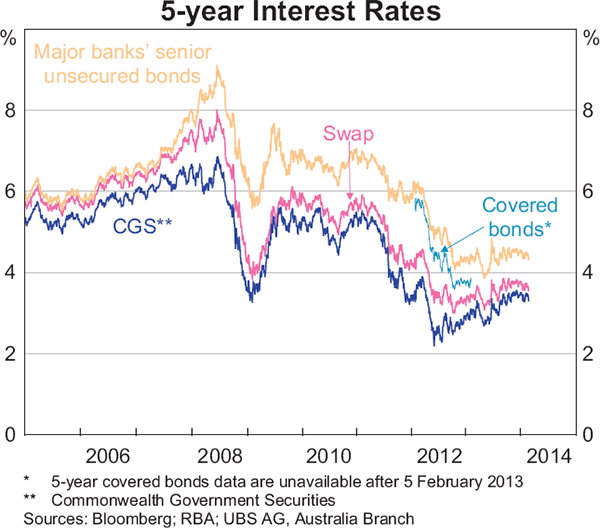
The absolute cost of issuing long-term wholesale debt rose slightly over the past year, following the increase in benchmark risk-free rates, which was offset slightly by a narrowing of spreads on bank bonds to these rates (Graph 6). Nonetheless, spreads continue to remain above their pre-crisis levels following investors' reassessment of the amount of compensation required for taking on bank credit risk.
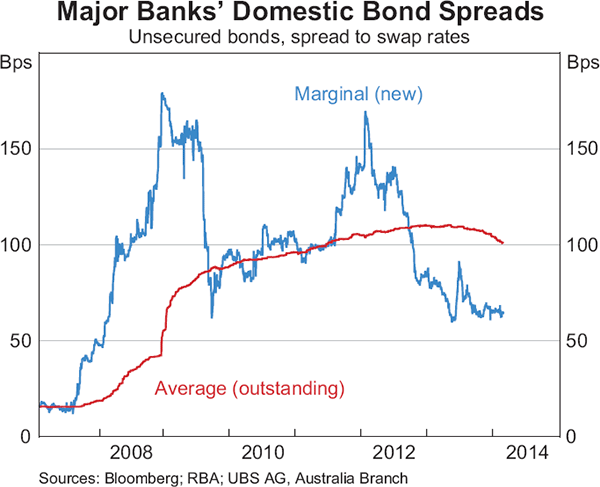
Even though the spread on new issuance is now at around its lowest level since 2009, the recent improvement in wholesale market conditions has only had a limited effect on banks' funding costs because new issuance has been relatively subdued over 2013 (Graph 7). As bonds issued during 2008 and 2009 at relatively high rates mature over the next year, the average outstanding bond spread is likely to continue to decline if spreads on new issuance remain around current levels. Bonds issued during 2008 and 2009, many of which are government guaranteed, represent about 70 per cent of the maturing bonds in 2014.
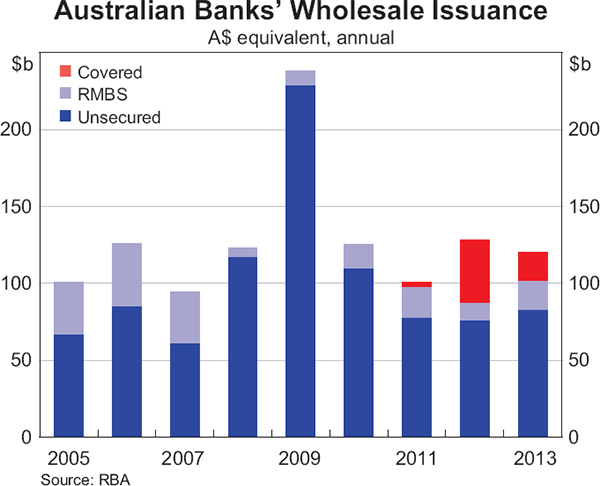
Banks' issuance of covered bonds has been subdued over the past year (Graph 8). Covered bonds generally attract lower interest rates than unsecured bonds due to their dedicated pool of collateral, as well as the expanded investor base to which these securities appeal. However, Australian banks' covered bond issuances are capped at 8 per cent of domestic assets.[3] Banks continue to maintain some spare capacity to issue covered bonds in the event of heightened stress in global financial markets. In 2013, securitisation, particularly of residential mortgage-backed securities (RMBS), has continued to recover after it declined sharply in 2007. RMBS spreads to the bank bill swap rate were roughly flat over the year.
Over the past year, interest rate hedges on banks' wholesale debt are estimated to have increased banks' hedged funding costs slightly, somewhat offsetting the reduction in the unhedged cost of wholesale debt. Once again, this is because net payments to banks on new hedging contracts are estimated to be lower than net payments on expiring contracts.
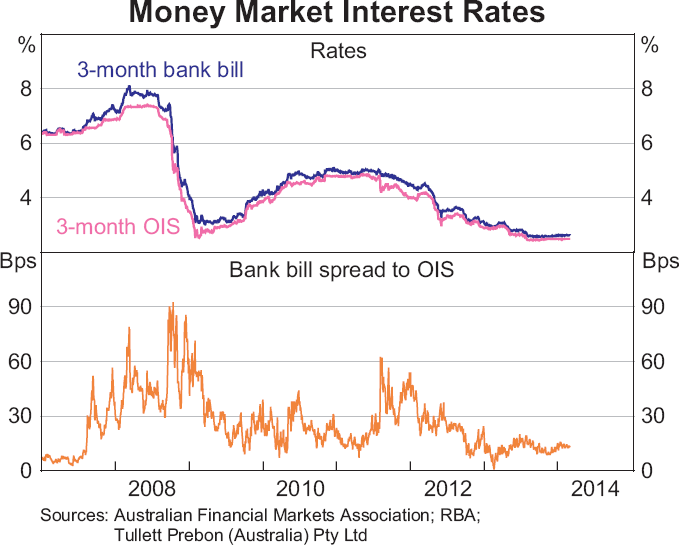
Banks' use of short-term wholesale funding has remained little changed over 2013. The composition of short-term debt remains fairly evenly split between domestic and offshore sources. Domestic short-term wholesale debt tends to be based on 1- and 3-month bank bill rates. In contrast, offshore short-term debt issuance tends to have longer maturities – often up to one year – as offshore markets are deeper and more liquid. Relative to expectations of the cash rate (as implied by the 3-month overnight indexed swap rate) the cost of short-term wholesale debt has declined over the past year to be only slightly above its pre-crisis levels (Graph 9).
Funding composition
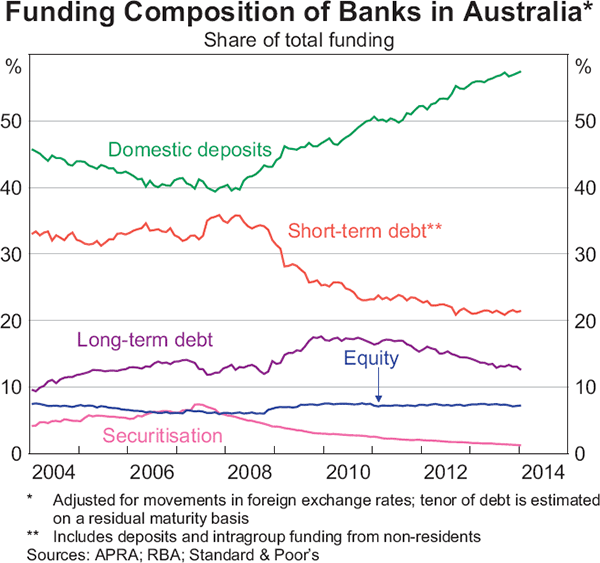
The trend toward a greater use of deposit funding that has been evident over the past five years has continued and has been accompanied by a decline in the share of funding from wholesale debt (Graph 10). The shift over the year is estimated to have contributed 2 basis points to the fall in the major banks' funding costs relative to the cash rate, as some long-term wholesale funding was replaced with cheaper deposit funding.
Overall cost of funding
As noted previously, there are a number of factors that influence banks' total debt funding costs, including changes in risk sentiment and competition for funding sources. These factors affect both the price of banks' funding liabilities and the composition of their balance sheets. Taking the cost of the individual funding sources noted above and weighting them by their share of total bank funding provides an estimate of banks' overall funding costs.
Over the past year, the fall in overall funding costs reversed a trend of increases since the onset of the global financial crisis (Graph 11). Nonetheless, the major banks' funding costs are estimated to remain close to 130 basis points higher than prior to that event. For a discussion of methodological changes introduced this year, see Appendix A.
Banks' Lending Rates
In setting lending rates, banks take account of the cost of funding liabilities, the required return on equity, as well as the risk margin designed to cover potential losses from making a loan. Since the onset of the global financial crisis, increases in the cost of some of these factors – predominantly an increase in banks' funding costs – have contributed to a widening of the spread between lending rates and the cash rate. Nonetheless, movements in the banks' net interest margin since 2007 have been minor when compared with the broad compression they experienced over the two decades prior to that.
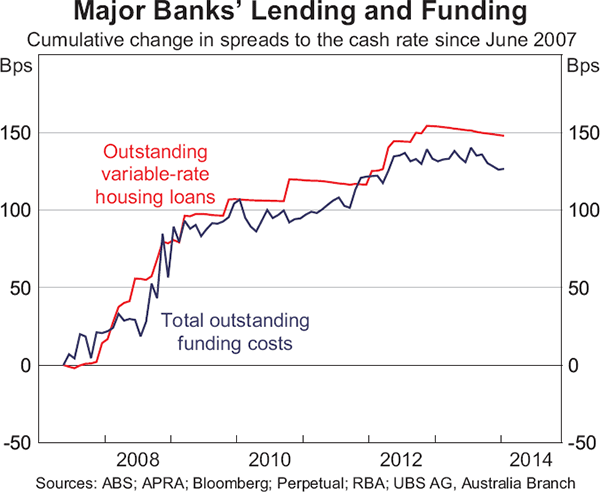
During 2013, the average interest rate on outstanding variable-rate housing loans drifted lower relative to the cash rate. The average interest rate on new variable-rate housing loans fell by about 10 basis points relative to the cash rate as discounts were increased. Moreover, the average interest rate on some new fixed-rate housing loans relative to expectations of the cash rate also fell over 2013. This was consistent with the small reduction in banks' overall funding costs relative to the cash rate over the period, suggesting that risk and profit margins remained largely unchanged (Graph 12).
The interest rates on around two-thirds of business loans are typically set relative to the bank bill swap rate rather than the cash rate. Nonetheless, relative to the cash rate, spreads on both small and large business lending rates have fluctuated within a tight range over the past year. Business lending spreads today continue to reflect the reassessment of funding and lending risks since the crisis.
Appendix A: Revisions to the Funding Cost Methodology
The Bank has changed its methodology for calculating funding costs in a number of ways. The first change relates to the hedging of interest rate risk, which arises from a mismatch in the size and maturity of a bank's fixed-rate liabilities and fixed-rate assets. Fixed rate liabilities represent about half of the major banks' funding liabilities.[4] In contrast, less than a fifth of the major banks' assets are fixed rate. Banks are able to hedge the mismatch in their funding by converting the effective payments on fixed-rate liabilities into variable-rate liabilities through the use of interest rate swaps.
The Reserve Bank's estimate of funding costs presented in this article assumes that the major banks fully hedge their funding interest rate risk exposures. That is, to the extent that funding liabilities are not naturally hedged by offsetting fixed-rate assets, interest rate swaps are assumed to be used. This assumption represents one bound to funding costs. The unhedged cost of funding, which had been the assumption underlying calculations in previous Bulletin articles on this topic, represents another bound. In practice, banks would adopt a strategy somewhere within the range of these two alternatives.
The hedged funding cost estimates also include the cost of hedges on transaction deposits, which are essentially fixed rate as the interest rate remains either close to or at zero. The portfolio of swaps on these transaction deposits, which are typically for terms of 3 to 5 years, is commonly referred to as a ‘replicating portfolio’.
Another change relates to the composition of deposits. Based on the availability of more granular data on the composition of deposits, the major banks' deposit funding composition has been revised. Incorporating the effect of these changes has had a modest effect on estimates of banks' funding costs. Most noticeably, the data indicate that there has been a shift in deposits towards bonus saver accounts recently.
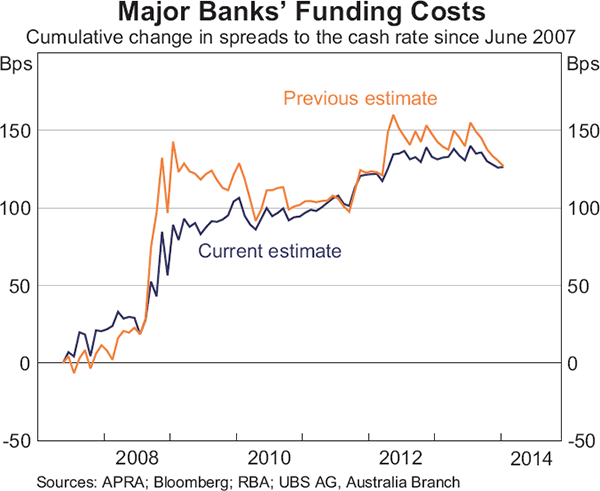
The current funding cost estimates for the major banks, which incorporates the cost of hedging and the revision to banks' deposit composition, along with some other minor refinements, are similar to the previous Reserve Bank funding cost estimates (Graph A1). However, there have been gaps between these series in the past. Over recent years, this gap was largest following the reductions in the cash rate in 2008 and 2009 as interest rate hedges cushioned the effect of unexpected movements on banks' funding costs. Since then, both the current and previous estimates have broadly moved together.
Footnotes
The authors are from Domestic Markets Department. [*]
The Reserve Bank uses a wide range of information to derive the estimates presented in this article. It supplements the analysis with detailed discussions with financial institutions. See Appendix A for some details of the methodology used. [1]
For details, see APRA (2014). [2]
For further details on covered bonds, see RBA (2012). [3]
Fixed-rate liabilities includes transaction deposits, term deposits and fixed-rate, long-term wholesale debt. [4]
References
APRA (Australian Prudential Regulation Authority) (2014), ‘Prudential Standard APS 210: Liquidity’. Available at <http://www.apra.gov.au/adi/PrudentialFramework/Documents/Prudential-Standard-APS-210-Liquidity-(January-2014).pdf>.
Deans C and C Stewart (2012), ‘Banks' Funding Costs and Lending Rates’, RBA Bulletin, March, pp 37–43.
Fabbro D and M Hack (2011), ‘The Effects of Funding Costs and Risk on Banks' Lending Rates’, RBA Bulletin, March, pp 35–41.
RBA (Reserve Bank of Australia) (2012), ‘Box D: Covered Bond Issuance by Australian Banks’, Statement on Monetary Policy, February, pp 57–58.
Robertson B and A Rush (2013), ‘Developments in Banks' Funding Costs and Lending Rates’, RBA Bulletin, March, pp 63–70.