Reserve Bank of Australia Annual Report – 1987 Financing
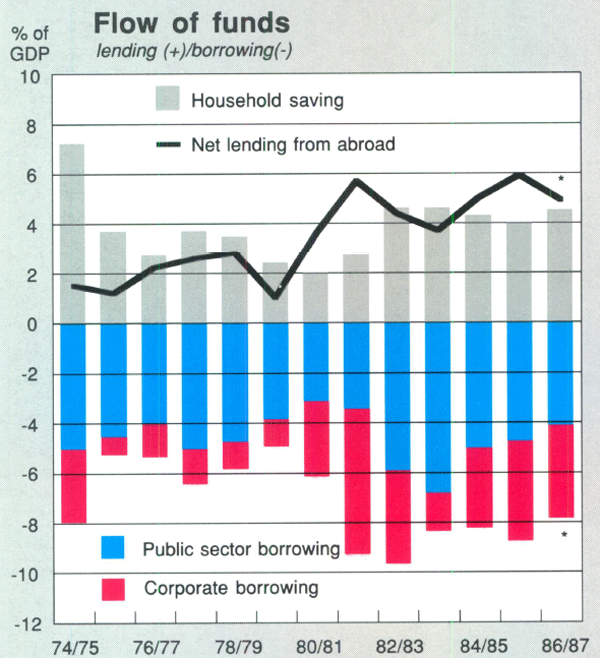
Total demands for finance again exceeded Australian savings in 1986/87 and there was heavy borrowing from abroad. The overall shortfall in domestic savings was equivalent to around 5 per cent of GDP.
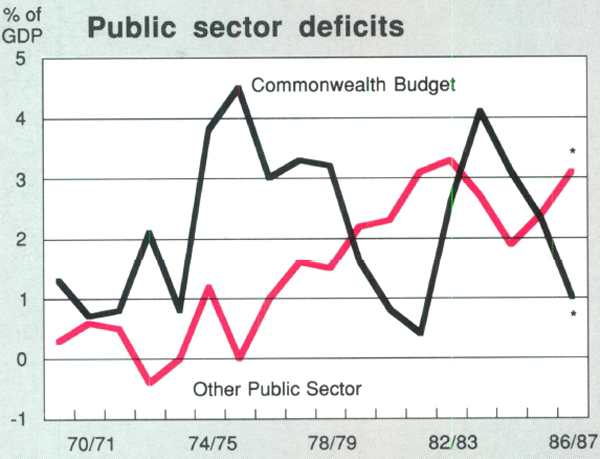
Public sector demand for funds fell in the year. The Commonwealth's Budget deficit fell by $3 billion to $2.7 billion, about 1 per cent of GDP, but this was partly offset by increased net borrowing by public authorities and state and local governments. As a result, the aggregate net public sector borrowing requirement fell by about ¾ of one per cent of GDP.
Weak business investment was reflected in a small fall (as a percentage of GDP) in corporate demand for funds for new capital spending. There was a small rise in household savings.
Borrowing overseas by governments and public authorities together accounted for about a third of the total call on overseas funding. An increasingly large proportion of private sector borrowing from abroad has been done by banks; they accounted for about a third of private sector borrowing in 1986/87. Other financial intermediaries also played an important role in facilitating borrowing abroad.
7 CAPTIAL MARKETS
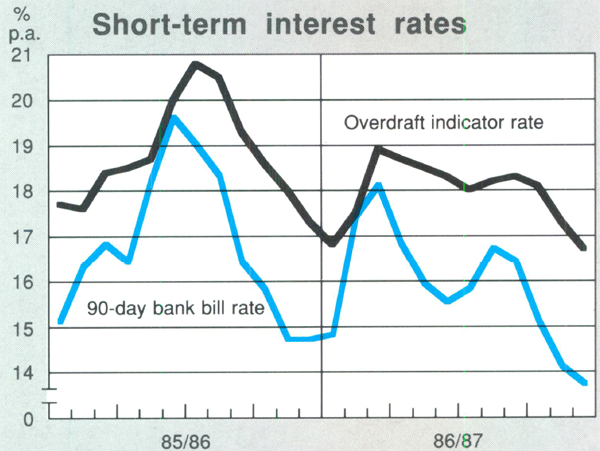
The combination of factors outlined earlier in this Report kept borrowing costs high during much of the year. The prospect of reduced demands for funds by governments in 1987/88 led to falls in interest rates over the second half of the year.
Financing by intermediaries
The number of financial intermediaries increased again in 1986/87. Competition was further intensified as some categories of demand for finance grew less rapidly than in the previous year. Demand for credit to finance share transactions, including mergers and acquisitions, was very strong but growth in demand for most other purposes slowed.
Strong competition put pressure on intermediaries' margins; the proportion of income derived from fee-earning activities, such as underwriting and advisory services, increased.
8 FINANCING
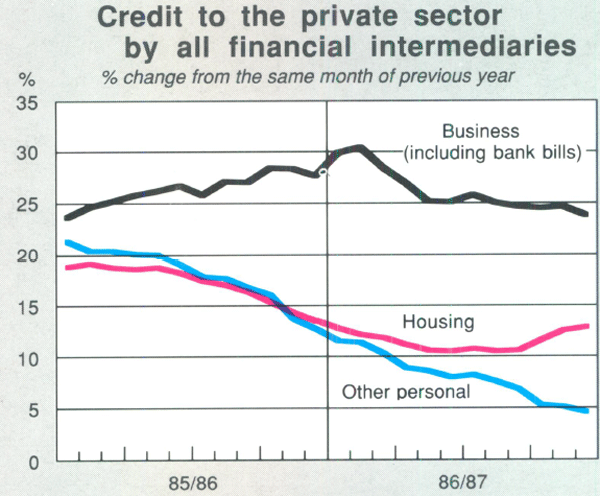
In the wake of the Government's Housing Assistance Package introduced in April 1986, housing finance picked up in the second half of the year after slowing over 1985/86. Demand for credit to finance spending on goods and services was generally subdued; the tight stance of economic policy, a sluggish economy and high interest rates, each played a role. Growth of personal lending slowed during the year, in line with lower consumer spending. There was only weak demand for finance for fixed capital formation.
| Private | Government | |||||
|---|---|---|---|---|---|---|
| Housing Loans |
Other Personal Loans |
Business | ||||
| Loans (a) | Bills (b) | |||||
| 1983/84 | 12.2 | 18.9 | 9.7 | 25.3 | 17.9 | |
| 1984/85 | 17.5 | 20.3 | 30.5 | 15.5 | 7.1 | |
| 1985/86 | 13.5 | 12.6 | 22.3 | 45.5 | 4.4 | |
| 1986/87 | 12.8 | 4.5 | 16.4 | 44.6 | 10.1 | |
| (a) Derived as a residual between total private sector loans and the sum
of housing and other personal loans. (b) Bank bills outstanding. |
||||||
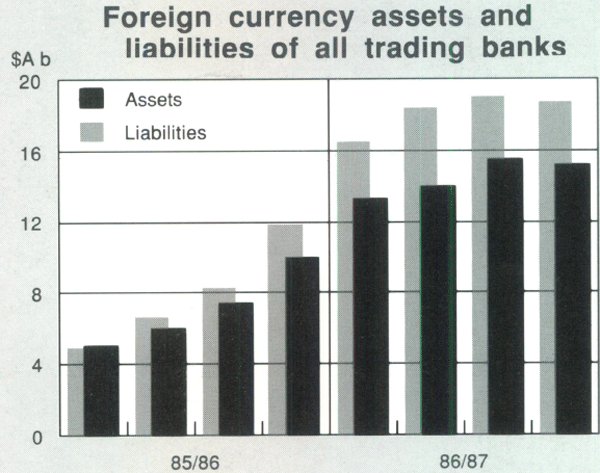
Banks' domestic raisings of Australian dollar funds grew relatively slowly in 1986/87; Australian dollar raisings offshore increased by 50 per cent and net foreign currency liabilities almost doubled.
For lengthy periods during the year the cost of bill finance fell relative to overdraft costs, prompting heavy recourse to bill lines. Accordingly, growth of credit in this form was strong; bank bills outstanding grew by around 45 per cent in 1986/87.
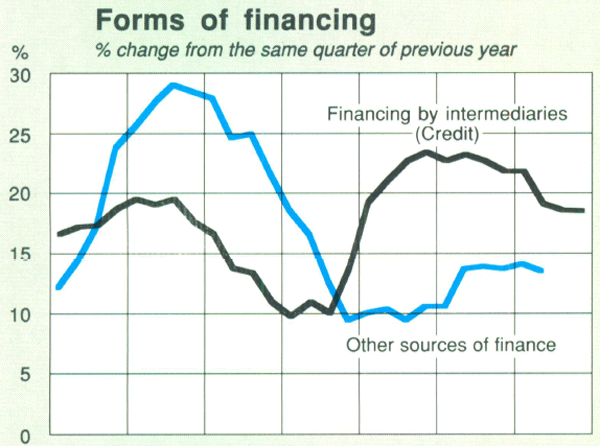
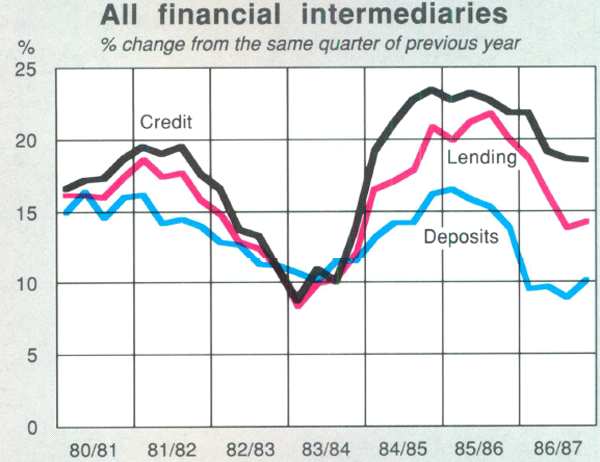
One result of these developments was that, over 1986/87, the monetary aggregates based largely on Australian dollar deposits grew relatively slowly while total credit provided to the private sector grew quickly. Thus, M3 and broad money grew by 13 per cent and 10 per cent respectively, although total credit provided by all financial intermediaries to the private sector grew by 19 per cent over the year. Bank bill financing and most offshore borrowings are excluded from the conventional monetary aggregates. Bank bill financing represented around a third of the growth in credit supplied by intermediaries and net offshore raisings around a fifth; the balance was funded mainly by domestic deposits.
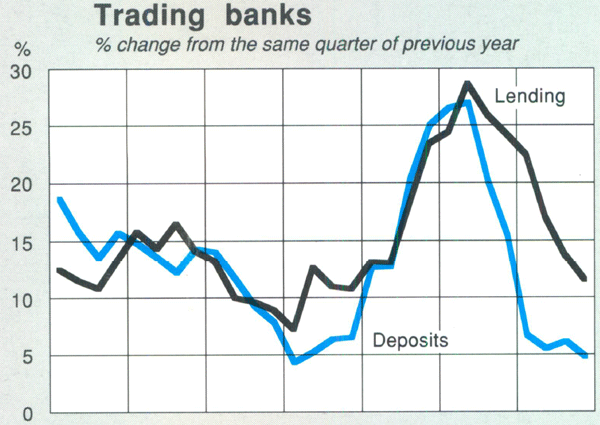
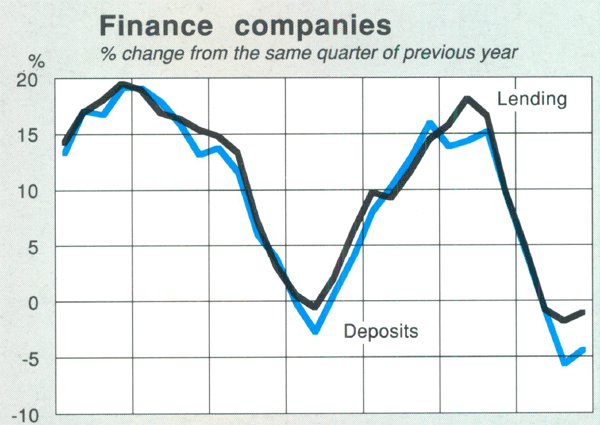
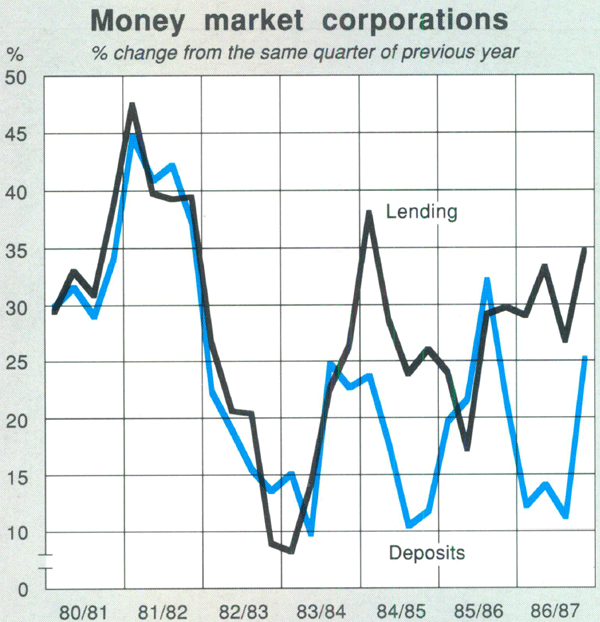
9 FINANCIAL INTERMEDIATION
10 INTEREST RATES AND DEBT
| Broad Money | Credit (a) | |
|---|---|---|
| 1983/84 | 11.5 | 13.7 |
| 1984/85 | 16.1 | 23.4 |
| 1985/86 | 13.4 | 21.8 |
| 1986/87 | 10.0 | 18.5 |
| (a) Loans by financial intermediaries plus bank bills outstanding. | ||
Over the past 18 months, 9 more trading banks began operations. For some, this involved large transfers of assets and liabilities from their non-bank affiliates. This boosted the size of the banking sector substantially. However, general economic conditions provided a poor environment for growth by new banks. Older established banks fared somewhat better.
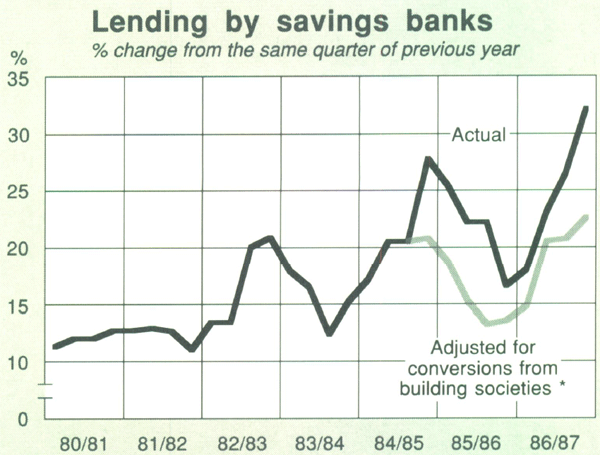
The number of savings banks also increased in 1986/87 due to the conversion of building societies. Savings banks were able to compete more actively for deposits following the introduction in April 1986 of the Government's Housing Assistance Package, which removed the interest-rate ceiling for new housing loans and provided a deposit interest subsidy to savings banks over the subsequent year. Their deposits and lending for housing both rose firmly in 1986/87. The deposit interest subsidy was terminated in March 1987. In that month the Government also reduced from 15 to 13 per cent the reserve asset ratio applying to savings banks under the Savings Bank Regulations. This brings the ratio into closer conformity with the Prime Assets Ratio (PAR) requirement for trading banks and gives savings banks greater flexibility in managing their assets portfolio. The Government announced its intention to remove the reserve assets ratio from the Regulations and move administration of the requirement to the Reserve Bank as part of its prudential supervision framework. This would place it on a similar basis to the PAR requirement.
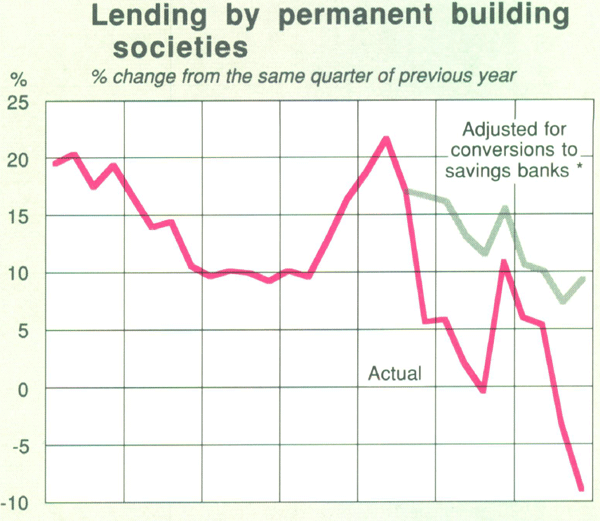
Non-bank intermediaries had mixed fortunes in 1986/87. Growth of lending by building societies continued to fall, even allowing for the conversion of societies to savings banks. Following amendments over recent years to State legislation which allowed building societies to diversify their operations, they further broadened their activities into commercial lending. This was partly a response to increased competition in their traditional field of lending for housing. Finance companies rely heavily on lease financing, lending to small business and personal lending. Weak consumer demand and a poor year for motor vehicle sales meant finance companies generally had a difficult year in 1986/87; some made increased provisions for bad and doubtful debts. As a group their balance sheets contracted; they did not actively seek funds during much of the year. On the other hand, money market corporations (merchant banks) grew strongly. Many relied heavily on offshore raisings to fund their domestic lending.
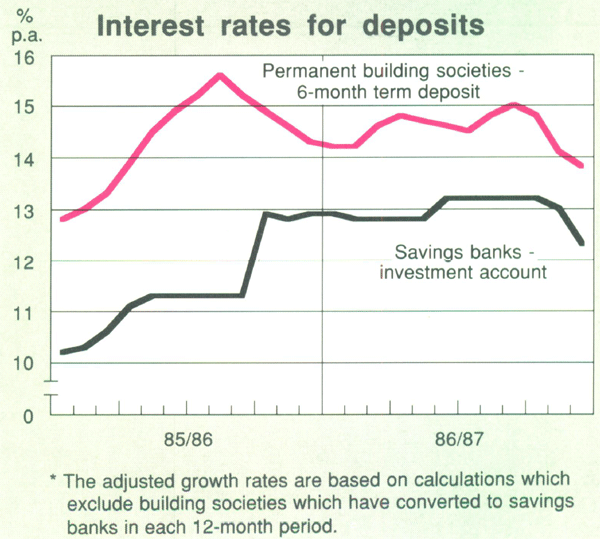
11 SAVINGS BANKS AND PERMANENT BUILDING SOCIETIES
12 FINANCIAL INTERMEDIARIES
Intermediaries' interest rates fluctuated over the course of the year, reflecting changes in money market interest rates and demand for credit. They rose over the first few months of the year in response to sharply increased cash rates and bill rates. It was not until late in the year that intermediaries' rates began to follow the downward trend of market rates. It is usual for changes in the deposit and lending rates offered by intermediaries to lag changes in wholesale market rates.
Other sources or finance
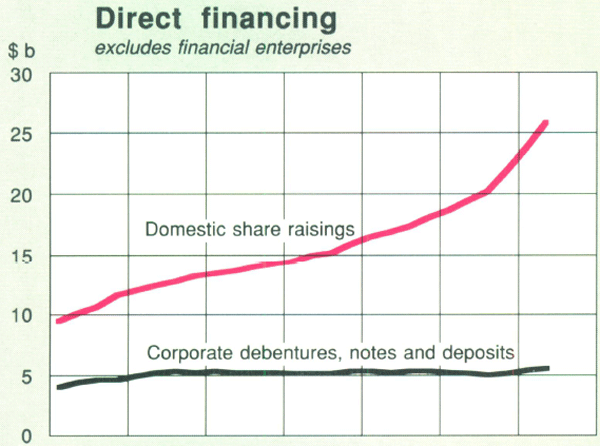
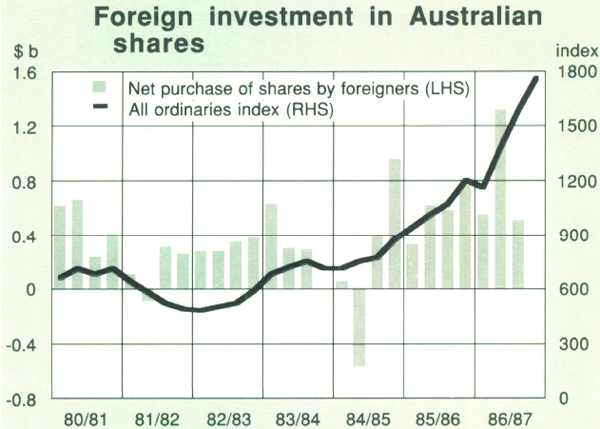
Issues of debentures and notes were little changed from the levels of previous years. Issues abroad remained at about the same high level as in 1985/86. Corporate borrowing abroad was also strong. Partly reflecting the buoyancy in the stockmarket, new share raisings were much higher than in the previous year. Demand for shares by overseas investors was strong. Gold share prices, in particular, rose sharply, by 210 per cent over the year, while the All Ordinaries index rose by 50 per cent.
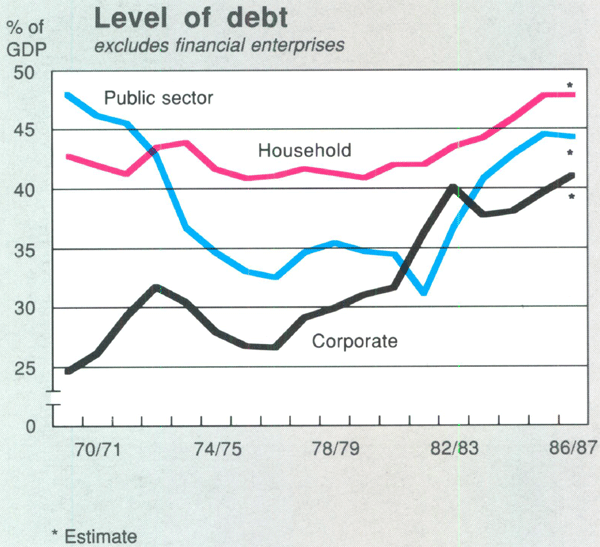
Levels of debt
High levels of takeover activity and other share purchases by corporate buyers produced a sizeable increase in the level of corporate debt in 1986/87. Household borrowing for housing and other purposes rose relatively slowly in 1986/87. As a result, though household debt continued to rise in dollar terms, it was little changed as a ratio to GDP. Growth in public sector debt slowed during the year as the net public sector borrowing requirement continued to fall.