Bulletin – September 2023 Australian Economy Recent Trends in Australian Productivity
- Download 811KB

Abstract
Productivity growth enables rising living standards and is needed for real wages growth to be consistent with stable inflation over the medium term. Prior to the COVID-19 pandemic, productivity growth in Australia and other advanced economies had been low, because business dynamism, job mobility, global trade and policy reform all slowed. Over the past few years, the pandemic and other shocks distorted productivity outcomes. Even if these shorter term fluctuations wash out, the longer term (and apparently structural) weakness in productivity growth could persist. This would have implications for the rate of nominal wages growth that is consistent with inflation returning to the target band. This article discusses the trends in Australia’s productivity growth before, during and since the pandemic and the implications for the economic outlook.
Introduction
Productivity growth is a key driver of economic growth and higher living standards. Labour productivity growth is defined as the amount of real production (GDP) per labour hour worked. It is determined by, among other factors, the amount of capital available to each worker, the rate of technological progress and how efficiently resources (like labour and capital) are used to produce goods and services. Multifactor productivity (MFP) measures the amount of output for a given amount of both labour and capital inputs. When labour productivity is rising, wages can sustainably increase faster than the general rate of inflation in the price of goods and services. Equivalently, positive productivity growth allows firms to increase the prices of their own products more slowly than the rate of increase in the price of labour and other inputs, or even to reduce prices. This implies that over the longer run, real wages growth, productivity growth and growth in living standards tend to track each other (Productivity Commission 2020).
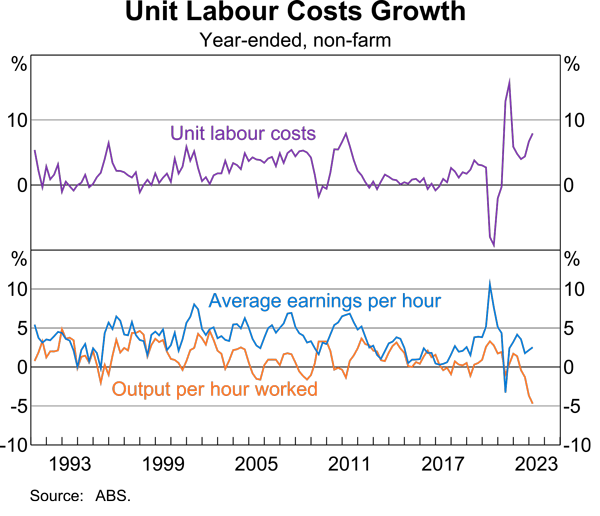
For this reason, the trend rate of productivity growth is an important input into assessments of the economic outlook, along with nominal wages growth. The difference between growth in hourly labour costs and growth in productivity – which is the growth rate in unit labour costs – affects firms’ pricing decisions and so the overall rate of inflation.
Recently, unit labour costs have been increasing strongly, reflecting higher nominal wages growth and subdued productivity growth (Graph 1). If sustained, this strong unit labour cost growth would contribute to ongoing inflationary pressures. The Reserve Bank’s current forecast for labour costs is consistent with inflation returning to the Bank’s target over the forecast horizon, provided productivity growth picks up back to pre-pandemic trends. However, productivity growth has been weak over the past few years and continued weakness in productivity growth is a key risk to the outlook.
This article explores recent trends in Australia’s productivity growth and the implications for income growth and inflation. It considers Australia’s longer term productivity performance and how this compares to other advanced economies, before delving into productivity outcomes during the COVID-19 pandemic and subsequent shocks, and commenting on the post-COVID outlook.
The pre-pandemic productivity landscape
Internationally, trend productivity growth has slowed across advanced economies, after a strong period of growth in the 1990s and early 2000s (Graph 2). The drivers of this productivity slowdown have been explored extensively in the literature: a declining rate of technological diffusion, measurement issues, slowing global trade growth, weakening business dynamism and ageing population structures have all been cited as potential causes (see Andrews, Criscuolo and Gal 2016; Adler et al 2017; Goldin et al 2022). Scarring effects from the global financial crisis (GFC) may have also led to persistent productivity losses, in part because investment in many economies declined to very low levels. This meant that workers had less capital to work with and therefore were less productive. The net result of this combination of factors was that average labour productivity growth in the decade prior to the pandemic was around 1.3 percentage points lower than in 1999–2004.

Like other advanced economies, Australia’s trend productivity growth has slowed in recent decades (Graph 3). From the 1990s to mid-2000s, productivity growth averaged 2.1 per cent, with the economy benefiting from deregulation and pro-competition policy reforms, the rapid uptake of new digital technologies and strong global productivity growth throughout this period (Productivity Commission 2020). This led to a sustained period of strong income growth (Productivity Commission 2021).

Since then, average productivity growth has fallen, averaging just 1.2 per cent over the 2010s. This decline has occurred across the market sector, rather than being driven by a particular industry (Graph 4). Widespread declining competition and slowing regulatory and economic reform are often cited as explanations for this broad-based slowdown (Hambur 2021; Daley 2021; Queensland Productivity Commission 2021; Banks 2012). The OECD (2021) suggests that Australian regulatory procedures are relatively complex and the licensing and permit system is cumbersome compared with other OECD countries. However, the global nature of the productivity slowdown suggests economies must be dealing with common shocks, not only country-specific regulatory developments.
Normally, slower average growth in productivity would imply slower growth in real incomes, and – without an implausibly large reduction in profit margins – also slower real wages growth. However, the high prices for Australia’s commodity exports prevailing from the mid-2000s to the mid-2010s lifted Australia’s terms of trade, which are defined as the ratio of the price of an economy’s exports to those of its imports. This meant that national income increased more quickly when measured in terms of the goods and services actually consumed in Australia than measured productivity growth would imply (Graph 5). Real wages and living standards were therefore able to grow faster than productivity, offsetting the latter’s slowdown (Davis, McCarthy and Bridges 2016; Lowe 2015).


However, terms of trade reflect global economic conditions and are unlikely to be a sustainable source of long-term income growth (Lowe 2015). From the mid-2010s, the terms of trade eased and no longer drove increases in per capita income growth, and even weighed on it in some years (Treasury 2017). This meant the subdued productivity growth contribution to lower wages growth was no longer being offset in the lead up to the pandemic.
The productivity landscape since 2020
Headline productivity growth increased at the onset of the pandemic as hours worked fell faster than output (Graph 6). This increase was driven by a significant compositional effect, as hours were cut in low productivity sectors to a far greater extent than in higher productivity sectors. Movement restrictions and lockdowns led to a declining share of hours worked in the (lower productivity) high-contact services sectors, and an increase in the share of hours worked in the (higher productivity) business services sectors where working from home was feasible (Graph 7) (Lopez-Garcia and Szörfi 2021; Gordon and Sayed 2022; Thwaites et al 2021).
The positive between-industry effect helped to offset productivity declines within goods-producing and contact-intensive industries, where it was difficult to transition to remote work (Graph 8) (Fernald and Li 2022). These declines likely reflected social distancing requirements, supply chain disruptions and shortages of inputs, including labour. Businesses also introduced containment measures to limit the spread of the virus, increasing intermediate costs and weighing on within-sector productivity (Thwaites et al 2021; Bloom et al 2022).
With the acute phase of the pandemic over, the compositional changes have largely unwound (Graph 7). On net, productivity has fallen in the three years to June 2023 (Graph 6). Significant shocks in 2022, following the acute pandemic phase, could still be weighing on productivity in Australia and in other economies. In particular, China’s zero-COVID-19 policy, which led to large-scale lockdowns, affected global supply chains, and might still be affecting Australian industry. Moreover, the effects of Russia’s invasion of Ukraine on global supply chains and energy supply could also be lingering. These shocks affected many industries, especially the construction industry, which is heavily reliant on global supply chains to import materials. Wet weather in Australia also constrained production in many industries, including construction, mining and agriculture. These shocks continue to weigh on the productivity level. As they continue to dissipate, productivity can be expected to recover further.


Labour productivity since the pandemic
While productivity remains broadly in line with its pre-pandemic trend in the United States, euro area and Norway, it is now below trend in the United Kingdom, Australia and Canada (Graph 9). Moreover, the effects of the pandemic and subsequent shocks might be having lingering impacts on the productive capacity of advanced economies; for example, through labour market hoarding or the transition to remote work practices. The following section discusses other structural and cyclical factors that may be driving recent productivity growth outcomes.

High labour market turnover and labour market hoarding
High job turnover in advanced economies may be affecting labour productivity growth, though the direction of the overall effect is ambiguous. On the one hand, the increase in job mobility could boost labour productivity growth if it results in better job matching and increased labour reallocation to more productive firms (Andrews and Hansell 2021). On the other hand, higher job mobility could weigh on labour productivity growth in the near term. More workers in the economy have recently started new jobs and so may be less productive as they are still in a learning or training phase. Tight labour market conditions, staff shortages and a higher average incidence of personal and other leave may also be leading to a higher rate of labour hoarding (Schnabel 2022; Cook 2022). Labour hoarding occurs when firms hold on to more workers than necessary, resulting in labour underutilisation and hence weighing on labour productivity growth.
Weakness in business investment
Weak business investment may be contributing to below-trend labour productivity growth in some advanced economies, though recent trends vary across countries (Graph 10). Lower business investment leads to slower growth in the capital stock per worker (capital deepening) and hence weaker labour productivity growth. In the United Kingdom, where productivity growth has stagnated, business investment has been very subdued since 2016, in part due to Brexit (Bank of England 2023). Throughout Europe, high energy prices associated with the Russian invasion of Ukraine have also weighed on business investment (Battistini, Bobasu and Gareis 2023).

Declining economic dynamism and competition
Economic dynamism refers to all the ways in which an economy can reinvent itself through the entry of new firms, through workers moving to higher paying firms and the downsizing or exit of less efficient activities. From the mid-2000s, Australia and other advanced economies experienced a decline in business entries, slowing capital and labour reallocation and declining competition (Hambur and Andrews 2023; Andrews and Hansell 2021; Hamubr 2021; Bakhtiari 2019). This trend contributed to Australia’s weak productivity performance before the pandemic. However, it reversed during the pandemic for business entry rates and job-switching rates (Graph 11), though this may be due to a mixture of ‘payback’ for low mobility during the early part of the pandemic, alongside cyclical strength in the labour market, rather than an underlying improvement in economic dynamism. Business entry rates peaked in mid-2021 and have since fallen for employing firms. Both the actual and expected job mobility rates declined in the two quarters to May 2023, indicating job mobility has likely peaked.

The outlook
While the pandemic appeared to temporarily disrupt some of the causes of the global slowdown in productivity growth, it has also exacerbated or introduced others. In addition to structural headwinds, Australia’s post-pandemic productivity performance will depend on the balance of several factors, including the following:
- Slowing growth in global trade: International trade increases competition, improves the reallocation of resources to more productive firms and reduces the costs of production by increasing the availability of intermediate inputs (Melitz 2003). The slowdown in global trade growth since the GFC could therefore have constrained productivity growth in advanced economies (Goldin et al 2022). Further declines in trade – whether due to cyclical, structural or geopolitical factors – could also weigh on future productivity growth going forward.
- Slowing knowledge spillovers: Global trade openness facilitates knowledge spillovers and technology diffusion. Foreign direct investment also provides a direct channel for the diffusion of global frontier technologies (Kerr 2017). Therefore, restrictions that reduce the flow of skilled workers, technology and investment across international borders are likely to slow the pace of global innovation. This channel is likely to be particularly important for Australia’s productivity future, given Australia is a net importer of technology.[1]
- Climate change and natural disasters: Climate change will have a direct impact on the productivity of several industries, such as agriculture, forestry and fishing and tourism (Productivity Commission 2023). The related increase in the frequency and severity of natural disasters also has implications for productivity growth, although the overall net effect depends on the exact model used (Botzen, Deschenes and Sanders 2019). In general, natural disasters destroy productive resources and thereby reduce short-term productivity growth. Over the longer term, however, the impact of climate change and natural disasters on productivity growth will depend on what assumptions are made about investment to increase resilience to disasters.
- The energy transition: The transition to renewable energy and lower emission technologies is another key risk. Abatement measures will generally increase production costs for firms, weighing on productivity growth (Productivity Commission 2023). Over the longer term, as the benefits of these technologies are realised, the net impact on productivity may improve.
- The net impact of COVID-era innovations: While many businesses shifted resources away from innovative activities during the pandemic to focus on survival rather than growth, some firms adapted their business models by speeding up adoption of digital technologies. Australian innovation investments remained robust during the pandemic, with a temporary increase in patent and trade mark applications filed in Australia in 2021 (IP Australia 2023). The pandemic also influenced the direction of innovation, with a notable shift towards technologies and innovations that supported remote work, mitigated the health impacts of the pandemic and responded to changes in household demand (Fink et al 2022). There was an unprecedented surge in adoption of cloud computing technologies during the pandemic, although adoption rates quickly returned to their pre-pandemic levels (Hambur and Nguyen 2023). Now that the pandemic is over, it is unclear whether businesses face the same pressures to innovate. However, there remains optimism in the longer term for productivity gains from widespread adoption of transformative technologies such as artificial intelligence (Brynjolfsson and McAfee 2011).
- Demographic developments: Demographic trends, such as population ageing, may also have an impact on labour productivity growth, though research on the relationship between population ageing and labour productivity growth is mixed (Commonwealth of Australia 2023). Some international research suggests that labour productivity decreases as the share of older workers increases, reflecting lower levels of innovation, entrepreneurship and take-up of new technologies (Maestas, Mullen and Powell 2023; Aiyar, Ebeke and Shao 2016). However, Australia’s entrepreneurs tend to be older than in other advanced economies (Steffens and Omarova 2019). Further, population ageing is likely to put pressure on labour supply and increase the incentive for firms to adopt new labour-saving techniques, which will have an offsetting impact.
Conclusion
Productivity is important to central banks given the links to economic growth, wages growth and inflation. Currently, wages growth forecasts are consistent with inflation returning to the Reserve Bank’s target band if productivity growth returns to its pre-pandemic trend. Recent productivity outcomes have been weaker than this and continued weakness is a key risk to the economic outlook. That said, in the short term, productivity growth may be supported by the unwinding of cyclical drags, such as high labour market turnover and labour hoarding. Further unwinding of supply chain disruptions is likely to improve production, particularly for construction firms. More generally, trend growth could rise above the pre-pandemic rate if innovations implemented by firms during the pandemic begin to pay dividends. How these factors net out will determine whether productivity growth returns to its pre-pandemic trend.
The long-term productivity outlook is even more uncertain. On the one hand, productivity growth has slowed further for some advanced economies than in the decade prior to the pandemic, indicating there may have been a further structural decline in productivity growth. Without further economic and regulatory policy reforms, the same growth in productivity experienced in past reform decades is unlikely. Further slowing in global trade and the energy transition threaten the revival of strong productivity growth in these economies. On the other hand, the pandemic influenced the take-up of existing technologies and changed the direction of innovation, which may pay dividends over the medium to longer term. The shock to energy prices may also provide further incentives for decarbonisation over the medium to longer term. Emerging economies face greater opportunities to experience higher productivity growth as living standards converge to that of advanced economies – 99 per cent of the Indian population now has access to electricity, a rapid increase from 59 per cent in 2000 (World Bank 2023).
Endnotes
Angelina Bruno and Fiona Georgiakakis are from Economic Analysis Department; Jessica Dunphy completed this work while in Economic Analysis Department. [*]
Less than 2 per cent of innovations by Australian businesses are new-to-the-world – most innovations are new-to-the-business, new-to-industry or new-to-Australia (ABS 2021). Additionally, 92 per cent of patents in Australia are filed by non-residents (IP Australia 2023). [1]
References
Adler G, R Duval, D Furceri, SK Çelik, K Koloskova and M Poplawski-Ribeiro (2017), ‘Gone with the Headwinds: Global Productivity’, IMF Staff Discussion Note No SDN/17/04.
Aiyar S, C Ebeke and X Shao (2016), ‘The Impact of Workforce Aging on European Productivity’, IMF Working Paper No WP/16/238.
Akcigit U and ST Ates (2019), ‘Ten Facts on Declining Business Dynamism and Lessons from Endogenous Growth Theory’, NBER Working Paper No 25755.
Andrews D and D Hansell (2021), ‘Productivity-Enhancing Labour Reallocation in Australia’, Economic Record, 97(317), pp 157–169.
Andrews D, C Criscuolo and N Gal (2016), ‘The Best versus the Rest’, OECD Productivity Working Paper No 5.
Andrews D, J Hambur, D Hansell and A Wheeler (2022), ‘Reaching for the Stars: Australian Firms and the Global Productivity Frontier’, Treasury Working Paper 2022-01.
Bakhtiari S (2019), ‘Entrepreneurship Dynamics in Australia: Lessons from Micro-data’, Economic Record, 95(308), pp 114–140.
Bank of England (2023), ‘Monetary Policy Report’, Monetary Policy Committee, February.
Banks G (2012), ‘Advancing the Reform Agenda: Selected Speeches’, Productivity Commission.
Battistini N, A Bobasu and J Gareis (2023), ‘Who Foots the Bill? The Uneven Impact of the Recent Energy Price Shock’, ECB Economic Bulletin, 2, pp 72–78.
Botzen WJW, O Deschenes and M Sanders (2019), ‘The Economic Impacts of Natural Disasters: A Review of Models and Empirical Studies’, Review of Environmental Economics and Policy, 13(2), pp 167–188.
Brynjolfsson E and A McAfee (2011), Race Against the Machine: How the Digital Revolution is Accelerating Innovation, Driving Productivity, and Irreversibly Transforming Employment and the Economy, Digital Frontier Press, Lexington.
Calvino F, C Criscuolo and R Verlhac (2020), ‘Declining Business Dynamism: Structural and Policy Determinants’, OECD Science, Technology and Innovation Policy Paper No 94.
Commonwealth of Australia (2023), ‘Intergenerational Report 2023’, Commonwealth of Australia.
Cook L (2022), ‘The Economic Outlook and U.S. Productivity’, Speech at the Detroit Economic Club, Detroit, 30 November.
Daley J (2021), ‘Gridlock: Removing Barrier to Policy Reform’, Grattan Institute Report No 2021-08, July.
Davis K, M McCarthy and J Bridges (2016), ‘The Labour Market During and After the Terms of Trade Boom’, RBA Bulletin, March.
Fernald J and H Li (2022), ‘The Impact of COVID on Productivity and Potential Output’, Federal Reserve Bank of San Francisco Working Paper No 2022-19.
Fink C, Y Meniere, A Toole and R Veugelers (2022), Resilience and Ingenuity: Global Innovation Responses to COVID-19, Report, CEPR Press, London.
Goldin I, P Koutroumpis, L Francois and J Winkler (2022), ‘Why is Productivity Slowing Down?’, The Oxford Martin Working Paper No 2022-8.
Gordon RJ and H Sayed (2022), ‘A New Interpretation of Productivity Growth Dynamics in the Pre-Pandemic and Pandemic Era U.S. Economy, 1950-2022’, NBER Working Paper No 30267.
Hambur J (2021), ‘Product Market Power and its Implications for the Australian Economy’, Treasury Working Paper No 2021-03.
Hambur J and D Andrews (2023), ‘Doing Less, with Less: Capital Misallocation, Investment and the Productivity Slowdown in Australia’, RBA Research Discussion Paper 2023-03.
Hambur J and K Nguyen (2023), ‘Adoption of General-purpose Technologies (GPT) in Australia: The Role of Skills’, RBA Bulletin, September.
IP Australia (2023), ‘Australian IP Report 2023’, Yearly Report.
Kerr W (2017), The International Mobility of Talent and Innovation New Evidence and Policy Implications, Cambridge University Press, Cambridge, pp 193–221.
Lopez-Garcia P and B Szörfi (2021), ‘The Impact of the COVID-19 Pandemic on Labour Productivity Growth’, ECB Economic Bulletin, 7, pp 46–51.
Lowe P (2015), ‘Fundamentals and Flexibility’, Speech at the CFA Institute Australia Investment Conference, Sydney, 13 October.
Maestas N, KJ Mullen and D Powell (2023), ‘The Effect of Population Aging on Economic Growth, the Labour Force and Productivity’, American Economic Journal: Macroeconomics, 15(2), pp 306–332.
Melitz MJ (2003), ‘The Impact of Trade on Intra-Industry Reallocations and Aggregate Industry Productivity’, Econometrica, 71(6), pp 1695–1725.
OECD (2023), OECD Compendium of Productivity Indicators 2023, OECD Publishing, Paris.
Productivity Commission (2020), ‘Australia’s Long Term Productivity Experience’, PC Productivity Insights, No 3/2020.
Productivity Commission (2021), ‘Recent Developments’, PC Productivity Insights, June.
Productivity Commission (2023), ‘5-year Productivity Inquiry: Managing the Climate Transition’, Inquiry Report No 100, February.
Queensland Productivity Commission (2021), ‘Improving Regulation’, Research Paper.
Schnabel I (2022), ‘Monetary Policy in a Cost-of-living Crisis’, Speech at a Panel on the ‘Fight Against Inflation’ at the IV Edition Foro La Toja, La Toja, 30 September.
Thwaites G, P Smietanka, P Bunn, P Mizen and N Bloom (2021), ‘The Impact of Covid-19 on Productivity’, VoxEU, 18 January.
Treasury (2017), ‘Analysis of Wage Growth’, Treasury Working Paper.