Bulletin – September 2023 Australian Economy Economic Literacy in Australia: A First Look
- Download 823KB

Abstract
Those who are economically literate make more informed economic choices, better understand the world around them and can influence public discourse and the actions of government. Given the importance of economic literacy for individuals and society at large, the Bank commissioned a large-scale survey of Australian adults testing their understanding of some core macroeconomic topics. The results enabled compilation of simple literacy scores that represent the Bank’s first attempt to gauge economic literacy in Australia. Being male, older, of higher income, having a degree, having studied economics or finance, or being engaged with economic news are associated with higher scores. By contrast, persons aged 18–24 years, unemployed persons and those without a degree had the lowest scores. Questions that tested abstract macroeconomic concepts appeared more difficult than those about more relatable issues that draw on lived experience. These findings speak to the importance of simple and targeted communication by the Bank and other policymakers to support the understanding of economic concepts across the community.
Introduction
Economic literacy is important. An economically literate populace make more informed economic choices, better understand the world around them and can influence public discourse and the actions of government.[1] Economically literate citizens can also contribute to the effectiveness of public policy by aligning their expectations or behaviour with it (McCowage and Dwyer 2022).
Understanding the level of economic literacy in the community requires consideration of what we mean by ‘economic literacy’ and how we can measure it. Both are difficult. Economic literacy encapsulates many concepts, it may differ according to the type of activity an individual is undertaking, and it is ‘lifelong’ in nature (McCowage and Dwyer 2022). As such, there are many methodological issues to consider.
This article builds on McCowage and Dwyer’s (2022) working definition of economic literacy,[2] and explores the results of the Bank’s first attempt to measure the level of economic literacy in the Australian community. The article proceeds as follows. First, it reviews some approaches to measuring economic literacy in other jurisdictions. Second, it describes the survey of Australian adults commissioned by the Bank to test their understanding of six macroeconomic topics and explains how the results of these questions were translated into a final literacy score for each individual. Finally, it presents analysis of significant differences in economic literacy scores across socio-demographic groups in the survey sample.
Approaches to measuring economic literacy in different jurisdictions
US Test of Economic Literacy
Arguably, the most thorough attempts to measure economic literacy have been undertaken by the Council of Economic Education (CEE) in the United States, which regularly conducts the Test of Economic Literacy (TEL). Developed in the late 1980s, the TEL is a comprehensive standardised testing program of high school students, consisting of 45 questions corresponding to the 20 Voluntary National Content Standards in Economics (hereafter, the ‘Standards’).[3] These Standards specify the essential economic content an economically literate student should know and be able to apply at different grade levels in high school.[4] The 2012 iteration of the TEL tested almost 11,000 grade 12 students across 480 public and private schools in the United States (National Center for Education Statistics 2013). The results showed higher economic literacy among males compared with females, among private school students compared with public school students, and among white students compared with other racial/ethnic categories.
Being the ‘gold standard’ for measuring economic literacy, the TEL has been used in many other countries. For example, Happ, Kato and Rüter (2021) ran versions of the TEL in both Germany and Japan, with some adaptations to adjust for the different country contexts. They also found strong differences in economic knowledge between male and female students in Germany, but no sex-specific differences in Japan.
The Australian context
A large-scale survey testing economic literacy of Queensland high school students was conducted in 1998, also based on the TEL, as detailed in Leitz and Kotte (2000). The researchers found that students in Queensland performed at least as well as their counterparts in US high schools, and that there were higher economic literacy scores among males compared with females, students in urban areas compared with those in rural areas, and students from independent schools compared with those from Catholic or government schools. The researchers also found higher economic literacy among students who had higher expectations regarding their tertiary studies and positive attitudes towards economics, and among those who did well in English and mathematics.
Aside from the work by Leitz and Kotte (2000), we are not aware of any other large-scale attempts to measure economic literacy in Australia. By contrast, much has been done to assess financial literacy[5] – it is measured on a regular basis, including in formal large-scale surveys (most notably the Household Income and Labour Dynamics in Australia (HILDA) survey[6]), and government departments have dedicated roles in support of it.[7]
What are we trying to measure?
In seeking to gauge economic literacy in Australia, what precisely are we trying to measure? Having identified common ground in a large and unsettled literature, McCowage and Dwyer (2022) proposed a working definition of economic literacy:
Proposed Working Definition of Economic Literacy
Someone attains economic literacy if, years after they have been taught, they can apply the four essential principles of economics in situations relevant to their lives and different from those encountered in the classroom. They will use these principles as the basis of economic analysis and decision-making, and they will understand the basic aspects of seven core economic topics that explain the economic system in which they participate.
The four essential principles of economics are: the cost-benefit principle; the opportunity cost principle; the marginal principle; and the interdependence principle.
The seven core topics of economics are: scarcity; economic behaviour; the ways in which goods and services are allocated; the structure and operation of markets; the use of factors of production; core macroeconomic variables and features of a business cycle; and the role of government and economic institutions in influencing economic outcomes.
To measure economic literacy, many questions could be asked about the four essential principles and seven core topics. However, for the Bank’s first look at economic literacy, we did not have the ambition of comprehensive testing, as is done in the US TEL. Instead, we honed in on the topic of ‘core macroeconomic variables and features of the business cycle’ − something of direct relevance to a central bank – and explored this through a survey.
The data
A novel dataset
To tackle the issue of measuring economic literacy, the Bank recently acquired a novel dataset from a survey conducted on the Bank’s behalf by the Behavioural Insights Team (BIT).[8] A representative sample of around 3,000 Australian adults were surveyed in January 2023. The respondents engaged in an experiment and answered a range of questions, generating a novel dataset about adult perceptions and understanding of economics, along with the factors that influence these.[9] The dataset will support multiple lines of enquiry. Of relevance to this article, respondents answered six multiple choice questions specifically designed to test their economic literacy. Responses from individuals who completed the questions implausibly quickly were removed, along with incomplete or invalid surveys, resulting in observations from 2,682 respondents.
The survey questions
The chosen questions had a macroeconomic focus because the Bank is most interested in the extent to which the public understands concepts that relate to its remit – particularly its conduct and communication of monetary policy. These questions also enabled us to get a sense of the aspects of economic literacy that equip individuals to participate in discussion about the macroeconomy and related public policy debates. As detailed in McCowage and Dwyer (2022), the topic of ‘core macroeconomic variables and features of a business cycle’ deemed essential for economic literacy includes five sub-topics: unemployment and inflation; money and inflation; economic fluctuations; interest rates; and fiscal and monetary policy. (Each of these correspond to one of the content Standards assessed in the US TEL.)
The survey included multiple-choice questions on each of these five sub-topics (Table 1). The specific questions used were adapted from the 2012 US TEL. As questions for the TEL are thoroughly vetted, with eminent economists involved in their design, they were a valuable template for questions in the Bank’s survey. Question 2 on the ‘money illusion’ is also very similar to one that appears in the 2016 and 2020 waves of HILDA; it is a question that touches on both financial and economic literacy.[10] A question testing knowledge of the Bank’s inflation target was also included; this is not from the TEL but is instead a knowledge-based question relevant to awareness of economics.
| Sub-topic tested | Question | Question shorthand |
|---|---|---|
| Unemployment and inflation | 1. As far as you know, during a recession in an economy, there would normally be an
increase in: a) imports b) unemployment c) economic growth d) business spending |
UnempInfl |
| Money and inflation (‘money illusion’) | 2. Say wages in the economy increased by 5 per cent and prices increased by
7 per cent. As far as you know, in terms of the goods and services they can
buy, a worker would be: a) better off b) worse off c) neither better nor worse off |
MoneyInfl |
| Economic fluctuations | 3. As far as you know, all else equal, which would usually increase total spending in the
economy? An increase in: a) tax rates b) consumer caution c) the savings rate d) business investment |
EcoFluctuations |
| Interest rates | 4. As far as you know, all else equal, a decrease in interest rates provides an incentive
for people to: a) save more and borrow more b) save less and borrow less c) save more and borrow less d) save less and borrow more |
Rates |
| Fiscal and monetary policy | 5. As far as you know, which monetary policy would the RBA most likely adopt if the
economy moved into recession during a period of low inflation? a) increase income taxes b) lower the cash rate c) decrease purchases of government bonds d) reduce spending on public infrastructure projects |
Monetary |
| RBA’s inflation target | As far as you know, what is the Reserve Bank of Australia’s target range for
inflation? (a) 0–1 per cent (b) 1–2 per cent (c) 2–3 per cent (d) 3–4 per cent (e) 4–5 per cent (f) 5–6 per cent (g) 6–7 per cent (h) 7–8 per (i) 8–9 per cent (j) 9–10 per cent (k) don’t know / uncertain |
InflTarget |
|
Source: RBA. |
||
Other survey features
Another feature contributing to the novelty of the survey data is the rich socio-demographic information collected about the respondents. In addition to commonly collected metadata (on sex, income, age, level of education and geographic location), respondents were asked if they had a mortgage and details of their labour market status. Importantly, they were also asked whether they had studied economics, finance or a similar subject, and how frequently they read or visited websites about economics or business news (this was used as a proxy for engagement with economic news). Appendix A shows the composition of the sample across these variables; for the purposes of presentation, some categories within socio-demographic variables have been collapsed to higher level groupings.
Before turning to the results, it should be acknowledged that time-bound access to the panel of Australian adults made it necessary to choose only a short number of questions, so that knowledge of a wider range of other economic topics or concepts was not tested. The questions were confined to multiple choice – a specific mode of examination with benefits and drawbacks. Furthermore, in multiple-choice surveys, some respondents may guess answers randomly, but it is difficult to quantify how many did so on average. We also lack a time series of responses to form a benchmark. It is possible that survey outcomes reflected circumstances particular to January 2023 – a time of high inflation, monetary policy tightening and relatively active media coverage of macroeconomic developments that might have made respondents more aware of economic issues than if the survey had been conducted at another time. The results, therefore, can only be considered as a simple snapshot of Australian economic literacy in January 2023 rather than across time.
The results
Correct responses by question
The share of correct responses to the questions testing economic literacy varied markedly (Graph 1). Around 80 per cent of respondents correctly answered Question 1 on the relationship between unemployment and inflation (specifically, during a recession) (‘UnempInfl’) and Question 2 on the money illusion (‘MoneyInfl’). By contrast, only around half of the respondents correctly answered the question on monetary policy (‘Monetary’), 40 per cent correctly answered the question on how interest rates impact saving and borrowing decisions (‘Rates’), and little more than one-third correctly answered the question on economy-wide fluctuations (‘EcoFluctuations’). Only around 20 per cent of respondents could identify the Bank’s inflation target (‘InflTarget’).

The data do not tell us why the responses are so varied, but there are some possible explanations. The high correct response rate for the first question on the relationship between unemployment and inflation during a recession might arise because the terms ‘recession’ and ‘unemployment’ are often used in conjunction with one another and so respondents could easily make an association, or because the experience of being employed or unemployed is one that individuals can directly relate to. The high correct response rate for the second question on the money illusion may also reflect individuals’ lived experiences of changes in purchasing power: households can very much ‘feel’ how their purchasing power is affected by relative changes in income and inflation. Interestingly, a similar money illusion question in the 2016 and 2020 HILDA surveys showed similar results, so it is not just that this issue is salient at times of high inflation like January 2023.[11]
The low correct response rates for the remaining questions may reflect that they touch on more abstract macroeconomic concepts and issues that are not as easily grasped because they have a less direct effect on individuals, or because they draw on pre-existing knowledge (particularly the question about the Bank’s inflation target). The lower share of correct responses for the inflation target question may also reflect the greater number of answer options; it would have been more difficult for a ‘random guesser’ to answer this question correctly.
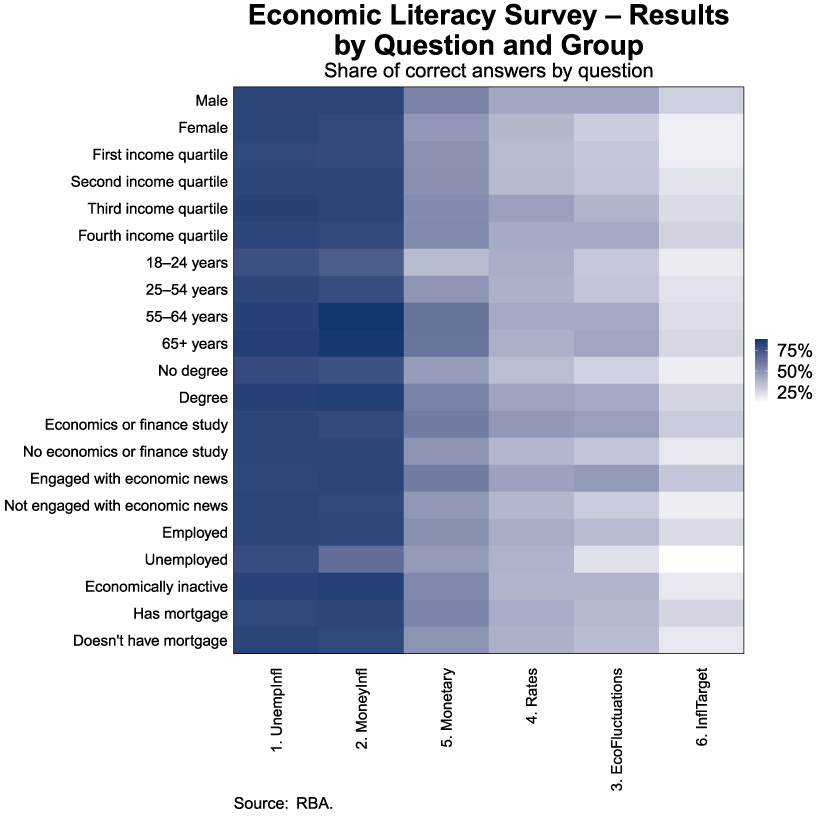
Correct responses by question and socio-demographic group
Graph 2 shows how each socio-demographic group performed across the survey questions, with questions presented in order of increasing difficulty from left to right, as in Graph 1. Within each socio-demographic group, Questions 1 and 2 consistently accounted for the highest share of correct answers. Graph 2 also reveals some initial clues about relative economic literacy across these groups: compared with other groups, 18 to 24-year-olds, those without a degree and unemployed persons had lower shares of correct responses for all questions (seen in the lighter bars for these groups across questions).
Economic literacy scores
As a summary indicator of economic literacy, we devised a simple score for each respondent based on how many of the five questions on macroeconomic relationships they answered correctly, so that their score ranged from 0 to 5. (The question on the Bank’s inflation target was not included in this score as it tests specific factual knowledge as opposed to understanding and application of a macroeconomic concept; however, it is explored in more detail in a forthcoming Bulletin article.) Average literacy scores for groups of respondents were then calculated.
Average literacy scores ranged from 2.5 to 3.2 across demographic groups, with an average of 2.9 across the full sample (Graph 3; Table 2). Males, older Australians, those with higher incomes, those with degrees, those who had studied economics or finance, those who were either employed or in the ‘economically inactive’ category, and those who reported to being engaged with economic news (by reading or visiting websites for economics or business news every day or once a week) had higher average economic literacy scores. Those aged 18–24 years, unemployed persons and those without a degree had the lowest economic literacy scores. Differences in mean scores across groups were statistically significant for almost all socio-demographic categories (Table 2).

| Average economic literacy score | |
|---|---|
| Gender*** | |
| Male | 3.1 |
| Female | 2.8 |
| Income quartiles*** | |
| Lowest | 2.8 |
| Second | 2.8 |
| Third | 3.0 |
| Highest | 3.0 |
| Age range*** | |
| 18–24 | 2.6 |
| 25–54 | 2.8 |
| 55–64 | 3.2 |
| 65 and over | 3.2 |
| Education*** | |
| No degree | 2.6 |
| Degree | 3.1 |
| Economics or finance study*** | |
| Yes | 3.1 |
| No | 2.8 |
| Engaged with economic news*** | |
| Yes | 3.1 |
| No | 2.8 |
| Employment status*** | |
| Employed | 2.9 |
| Unemployed | 2.5 |
| Economically inactive (includes retirees, students and homemakers) | 3.0 |
| Location* | |
| Rural | 2.8 |
| Suburban | 2.9 |
| Urban | 2.9 |
| Mortgage | |
| Yes | 2.9 |
| No | 2.9 |
| Total | 2.9 |
|
(a) Asterisks indicate results of two-sided t-tests for categories comprising two groups or Kruskal-Wallis H Tests for categories with more than two groups; * if p<0.05, ** if p<0.01, *** if p<0.001. Source: RBA. |
|
Not shown in the graph or table is that high scores among ‘economically inactive’ respondents were driven by those in the ‘retired’ category; perhaps being retired and likely to be older means these respondents have had greater lived experience of major economic events. Older Australians are also more likely to have studied economics, given its greater availability as a subject in earlier decades than today.
Perhaps one surprising result is that overall scores did not differ – in an economically or statistically significant way – according to whether respondents had a mortgage.[12] However, on a question-by-question basis, those with a mortgage performed better on questions related to the Bank and monetary policy, with 56 per cent of those with a mortgage responding correctly to the question on the likely actions of the Bank in a period of recession, compared with 50 per cent of those without a mortgage. And 26 per cent of those with a mortgage knew the Bank’s inflation target, compared with 20 per cent of those without one. Both differences were statistically significant.
Econometric model of economic literacy scores by group and results
Regression analysis can be used to investigate which of the socio-demographic factors (controlling for other characteristics of survey respondents) have a statistically significant relationship with measured economic literacy scores. Economic literacy scores were modelled as a function of the socio-demographic variables captured in the survey.[13] The details of the model and full results can be found in Appendix B.
The results confirm that having a degree, having studied economics or finance, being male, being in a higher income bracket, being engaged with economic news, and being older are all associated with higher economic literacy scores − in line with the descriptive statistics presented above. These relationships are all statistically significant. Graph 4 shows the results from one of the model estimation approaches (Ordinary Least Squares, or ‘OLS’). It shows the marginal effect of different characteristics on the overall economic literacy score, all else equal. Some interesting results are as follows:
- Having a degree is associated with an economic literacy score that is 0.36 units higher than for someone without a degree, all else equal (or 12.5 percentage points higher than the mean score).
- Being male, or having studied economics or finance, is associated with a score that is just under 0.2 units higher, all else equal (or around 6 percentage points higher than the mean score).
- Older respondents tend to have higher economic literacy scores. For every 10 extra years in age, economic literacy scores are 0.1 units higher on average. So, a 60-year-old might be expected to have a score that is over 0.4 units higher than a 20-year-old (on average).
- Similarly, for each increase in income quartile, economic literacy scores increase by around 0.1 units. So those in the highest income quartile would have scores that are 0.4 units higher than those in the lowest, on average.
- Employment status, after controlling for respondents’ other socio-demographic characteristics, does not appear to have a statistically significant relationship with economic literacy scores. This might suggest that it is not employment status (e.g. being unemployed) that can statistically explain economic literacy scores, but other characteristics associated with employment status as well as economic literacy (such as age or level of education).

Future research may consider question-by-question regressions utilising these data. With two of the questions in the survey appearing relatively easy for respondents, much of the variation in economic literacy scores is driven by responses to the remainder. This warrants a deeper investigation into what factors might explain the propensity of different socio-demographic groups to get these correct. There may be interesting variation to explore, as in the earlier example of mortgage-holders outperforming on specific questions.
Conclusion
This article has presented novel data that provide a first read on Australian adults’ measured proficiency to grapple with some core areas of macroeconomics. While most survey respondents found questions testing understanding of issues that were relatable or touched on lived experience relatively easy, questions about economic fluctuations, interest rates and monetary and fiscal policy were more challenging − possibly reflecting their more abstract nature. Being male, older, of a higher income, having a degree, having studied economics or finance, or being engaged with economic news were all associated with higher measured economic literacy scores. Persons aged 18–24 years, unemployed persons and those without a degree had the lowest scores. These data are a rich source for future study of other areas of economic literacy, as will be explored in forthcoming work by the Bank. Initial results also point to the benefits of widening the scope of questions asked and collecting data as a time series, so that societal norms in economic literacy can be better identified along with changes in literacy over time.
The findings in this article have implications for how the Bank and other public policymakers might tailor their communication about macroeconomic concepts, policy objectives and decisions across different segments of the community. Specifically, they speak to the importance of communicating economic information in a simple and targeted way to support understanding of and engagement with economics and the economic policies that affect people’s lives.
Appendix A: Survey sample composition
| Number | Percentage | |
|---|---|---|
| Gender | ||
| Male | 1,240 | 46.2 |
| Female | 1,428 | 53.2 |
| Another | 14 | 0.5 |
| Income quartiles(b) | ||
| Lowest | 723 | 27.0 |
| Second | 671 | 25.0 |
| Third | 778 | 29.0 |
| Highest | 510 | 19.0 |
| Age range(b) | ||
| 18–24 years | 309 | 11.5 |
| 25–54 years | 1,491 | 55.6 |
| 55–64 years | 368 | 13.7 |
| 65 years and over | 514 | 19.2 |
| Location | ||
| Australian Capital Territory | 36 | 1.3 |
| New South Wales | 827 | 30.8 |
| Northern Territory | 9 | 0.3 |
| Queensland | 590 | 22.0 |
| South Australia | 221 | 8.2 |
| Tasmania | 54 | 2.0 |
| Victoria | 723 | 27.0 |
| Western Australia | 222 | 8.3 |
| Highest level of education | ||
| No degree | 1,252 | 46.7 |
| o/w TAFE certificate | 545 | 20.3 |
| o/w TAFE diploma | 338 | 12.6 |
| o/w High school graduate (Year 12) | 195 | 7.3 |
| o/w Year 10 graduate | 161 | 6.0 |
| o/w Less than year 10 | 13 | 0.5 |
| Degree | 1,430 | 53.3 |
| o/w Bachelor’s degree | 440 | 16.4 |
| o/w Master’s degree | 734 | 27.4 |
| o/w Doctorate degree | 234 | 8.7 |
| o/w other | 22 | 0.8 |
| Employment status(b) | ||
| Employed | 1,802 | 67.2 |
| Unemployed | 139 | 5.2 |
| Economically inactive | 741 | 27.6 |
| o/w retired | 441 | 16.4 |
| o/w student | 88 | 3.28 |
| o/w full-time homemaker | 144 | 5.4 |
| o/w other | 68 | 2.5 |
| Urban location status | ||
| Urban | 622 | 23.2 |
| Suburban | 1,669 | 62.2 |
| Rural | 391 | 14.6 |
| Mortgage status | ||
| Mortgage holder | 978 | 36.5 |
| No mortgage | 1,704 | 63.5 |
| Studied economics, finance or a similar subject | ||
| Yes | 650 | 24.2 |
| No | 2,032 | 75.8 |
| Engagement with economic news (‘How often do you read or visit a website for economics or business news?’) | ||
| Every day | 264 | 9.8 |
| Once per week | 628 | 23.4 |
| Once per month | 520 | 19.4 |
| Never or hardly ever | 1,270 | 47.4 |
| Total | 2,682 | |
|
(a) BIT collected information on age, gender, education, location, income and employment status using the pre-screening questions in their platform; there was little scope to change the question on gender to directly match the current ABS Standard (which specifies sex at birth or an alternative title). (b) More granular categories are available for these variables than displayed. Source: RBA. |
||
Appendix B: Regression model specification and output
The regression models of economic literacy scores were specified as follows:
where, for each respondent i:
- Economic literacy scorei is the economic literacy score between 0 and 5
- Femalei is 1 if the respondent is female (and 0 if they are male)
- Agei is the respondent’s age in years
- IncomeQuartilei is a categorical variable between 1 and 4 for the respondent’s income quartile
- StudiedEconi is 1 if the respondent has studied economics or finance
- EmploymentCategoryi is 1 if the individual is unemployed, 2 if economically inactive, 3 if employed
- EconEngagedi is 1 if the respondent reports that they read or visit websites for economics or business news every day or once a week (and 0 if they responded once a month or never/hardly ever).
As average scores did not vary significantly according to whether respondents held a mortgage or according to geographic location, these variables were not included in the model.
| Outcome | Economic literacy score | Economic literacy score | Economic literacy score |
|---|---|---|---|
| Estimation method | OLS | Ordered probit (a) | Ordered logit (b) |
| Female | −0.176*** | −0.154*** | −0.260*** |
| (-3.51) | (-3.69) | (-3.60) | |
| Age (years) | 0.0122*** | 0.00992*** | 0.0189*** |
| (7.05) | (6.77) | (7.64) | |
| Income quartile | 0.0917*** | 0.0777*** | 0.157*** |
| (3.40) | (3.45) | (4.09) | |
| Degree | 0.358*** | 0.300*** | 0.535*** |
| (7.32) | (7.39) | (7.65) | |
| Studied economics or finance | 0.182** | 0.163** | 0.368*** |
| (2.83) | (2.98) | (3.82) | |
| Economically inactive | 0.181 | 0.152 | 0.188 |
| (1.63) | (1.69) | (1.22) | |
| Employed | 0.163 | 0.132 | 0.184 |
| (1.56) | (1.57) | (1.28) | |
| Engaged with economic news | 0.159** | 0.144** | 0.282*** |
| (2.82) | (3.04) | (3.41) | |
| Constant | 1.757*** | ||
| (12.75) | |||
| (1.63) | |||
| Observations | 2,668 | 2,668 | 2,668 |
| R2 (Pseudo R2 for ordered probit and logit) |
0.0787 | 0.0256 | 0.0285 |
|
* if p<0.05, ** if p<0.01, *** if p<0.001. (a) Results are ordered log-odds (base 10) coefficients. For a one unit change in the predictor variable, the odds that respondents in that group would have a higher economic literacy score compared with another group are 10coefficient. Average marginal effects were also assessed but are not shown. (b) Results are ordered log-odds (base e) coefficients. For a one unit change in the predictor variable, the odds that respondents in that group would have a higher economic literacy score compared with another group are ecoefficient. Average marginal effects were also assessed but are not shown. Source: RBA. |
|||
Endnotes
The author is the current manager of the Bank’s education program. The author would like to thank Jacqui Dwyer for establishing and supporting research on economic literacy in Australia at the Reserve Bank, and for her invaluable support in drafting this article. The author would also like to thank Peter Rickards for initiating the data collection exercise with BIT and collaborating on the analysis of results. [*]
A key channel through which the Reserve Bank supports economic literacy in Australia is through its public education program, the strategic objective of which is to increase the size and diversity of the economics student population in Australia. If realised, over the longer term, this should raise the collective ability of the economics profession, the quality of public policy and ultimately the level of economic literacy in the community (Dwyer 2018). [1]
Importantly, the authors also explored how economic literacy differs to the well understood concept of ‘financial literacy’. [2]
See McCowage and Dwyer (2022) for more details on the TEL. [3]
See Walstad, Rebeck and Butters (2013a) for a discussion of the latest revision of the TEL, and Walstad, Rebeck and Butters (2013b) for the latest Examiner’s Manual, including all questions in the 4th edition of the TEL. [4]
For recent research, see Preston (2020); Preston and Wright (2019). [5]
HILDA is an annual panel study of 17,000 Australians relating to income, experiences in the labour market and family dynamics, which periodically includes questions testing financial literacy, including in the 2016 and 2020 surveys. In 2021, the Australian Government also began surveying Australians about their sense of financial capability and testing their understanding of financial literacy topics (Australian Government 2021). The ANZ has also run large-scale surveys of financial literacy since the early 2000s (ANZ 2021). [6]
The Treasury is responsible for the National Strategy on Financial Capability, and the Australian Securities and Investments Commission is responsible for provision of the services and tools for its implementation. [7]
BIT is based in the United Kingdom and collects data for ‘social purpose’ research, working with universities, private consultancies, international agencies, government agencies and central banks. [8]
This included an experiment to test how their understanding of economic concepts was influenced by the information source and context provided, which will be the subject of a future publication. [9]
‘Money illusion’ refers to the tendency of individuals to think about their incomes and wealth in nominal terms, rather than inflation-adjusted (or real) terms. [10]
The HILDA survey asks: ‘Suppose that by the year 2020 your income has doubled, but the prices of all of purchases have also doubled. In 2020, will you be able to buy more/the same/less than today?’ (Respondents could also answer ‘refused/not stated’, or ‘don’t know’.) See Melbourne Institute of Applied Economic and Social Research (2022). [11]
The 2016 and 2020 HILDA data showed significant differences in the share of mortgage-holders who answered the financial literacy questions correctly compared with other Australians. On average, the share of mortgage holders who got each of the five questions correct was around 10 percentage points higher compared with non-mortgage-holders. [12]
Three methods of estimation were utilised: ordinary least squares (OLS), as well as ordered probit and ordered logit, which are suitable for data like these where the dependent variable (the economic literacy score) is ordinal with scores ranked between 0 and 5. See Greene and Hensher (2008) for more information. [13]
References
ANZ (2021), ‘Financial Wellbeing: A Survey of Adults in Australia’, December.
Australian Government (2021), ‘2021 National Survey Dashboards’. Available at <https://financialcapability.gov.au/strategy/dashboards>.
Greene W and D Hensher (2008), ‘Modeling Ordered Choices: A Primer and Recent Developments’, June.
Happ R, M Kato and I Rüter (2021), ‘Results from the Test of Economic Literacy in Germany and Japan: A Critical Discussion on the Gender Effect’, Citizenship, Social and Economics Education, 20(1), pp 48–68.
Leitz P and D Kotte (2000), The Importance of Economic Literacy, Peter Lang GmbH, Frankfurt.
McCowage M and J Dwyer (2022), ‘Economic Literacy: What Is It and Why Is It Important?’, RBA Bulletin, December.
Melbourne Institute of Applied Economic and Social Research (2022),’ The Household, Income and Labour Dynamics in Australia Survey: Selected Findings from Waves 1 to 20’.
National Center for Education Statistics (2012), ‘The Nation’s Report Card: Economics 12 – National Assessment of Educational Progress at Grade 12’, US Department of Education.
Preston A (2020), ‘Financial Literacy in Australia: Insights from HILDA Data’, Presentation at the UWA Public Policy Institute, March.
Preston A and RE Wright (2019), ‘Understanding the Gender Gap in Financial Literacy: Evidence from Australia’, Economic Record, 95(1), pp 1–29.
Walstad W, K Rebeck and R Butters (2013a), ‘The Test of Economic Literacy: Development and Results’, The Journal of Economic Education, 44(13), pp 298–309.
Walstad W, K Rebeck and R Butters (2013b), Test of Economic Literacy Examiner’s Manual, 4th edition, Council for Economic Education, New York.