Strategic Review of Innovation in the Payments System: Results of the Reserve Bank of Australia's 2010 Consumer Payments Use Study – June 2011 Appendix A – Study Methodology
The 2010 Consumer Payments Use Study closely followed the Bank's 2007 Study of the day-to-day use of payment methods by individuals in Australia. As for the 2007 Study, the Bank commissioned Roy Morgan Research to assist with the design and to conduct the study. For the 2010 Study, around 1,700 individuals were recruited with the aim of yielding a representative sample of around 1,000 completed studies. Based on the experience of the first study, younger people were oversampled to overcome the fact that they were less likely to respond than older individuals. All respondents in the first study were invited to participate in the second study; 401 agreed to participate again and 317 completed the study. Including these repeat respondents, a total of 1,240 valid responses were received.[21]
Responses were weighted according to gender, age group, geographical location (metropolitan or regional) and credit card holding. Targets for the weightings were based on ABS population statistics for the demographic variables and Roy Morgan Research's Single Source re-contact database for the credit card holding variable. This was the same weighting scheme used in 2007, except for the addition of credit card holding, which was added when preliminary analysis of the 2010 data showed credit card holders were significantly over-represented in the sample. The original 2007 data were also reweighted using this new weighting strategy so that consistent study comparisons could be made. This made little difference to the 2007 results.
Like the 2007 Study, the 2010 Study had two main components: a payments diary; and an end-of-study questionnaire. Demographic data for each respondent was also obtained again from Roy Morgan Research's Single Source re-contact database, although the 2007 repeat respondents were required to complete a short demographic and background update questionnaire. These demographic and background data could be directly matched to the responses for the diary and the end-of-study questionnaire for each respondent.
In the second study, changes to the payments diary were kept to a minimum so that results from the two studies could be easily compared. However, some changes were made to address minor methodological issues raised by the first study, and to capture additional information in particular areas. Most notably, modifications were made to allow for online payment methods, such as internet/telephone banking, Paymate, PayPal and POLi. In sum, the 2010 diary captured data on the use of 12 different payment methods in 15 merchant categories. As before, the diary also captured information on the channel that was used to make the payment (in person, internet, phone or mail) and whether a surcharge was applied.
For cash withdrawals, the diary captured the same four methods of obtaining cash as used in the 2007 Study: ATM withdrawals; eftpos cash-outs; over-the-counter cash withdrawals; and other methods. The variable for a ‘special trip’ to obtain cash was dropped, while a new variable was added to indicate whether a direct charge was paid for ATM withdrawals.
The scope of the end-of-study questionnaire was greatly expanded. This was done primarily to provide information needed for the Strategic Review of Innovation. Questions were added to investigate individuals' attitudes to payment methods; in particular, individuals were asked their reasons for choosing particular payment methods and what factors might increase their use of online payment methods. Respondents were asked about payment behaviour not captured by the payments diary, including questions on cash holding, credit card repayments and use of direct debits. Also, new questions were asked about individuals' responses to charges on payment and withdrawals (i.e. surcharging on cards and direct charging at ATMs).
General demographic information on the participants was provided by Roy Morgan Research from its Single Source re-contact database. Participants from the 2007 Study were asked to complete an additional end-of-study questionnaire to update their demographic data.
Results of both the 2007 and 2010 studies exhibit some signs of ‘survey fatigue’, as evidenced by a drop-off in payments reported after the first day of the diary (Graph A1). Detailed analysis of the 2010 data suggests that this drop-off is partly explained by week-day factors, with around half of respondents having started their payment diaries on the peak spending days of Thursday and Friday. However, estimates of the week-day factors (based on variation in the averages for first-day spending) indicate that this only accounts for a small part of the decline.
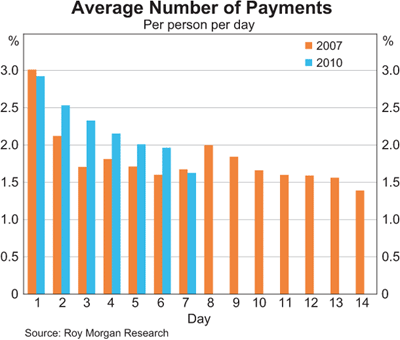
Despite the drop-off in the number of payments, the relative use of payments has remained constant. For both the 2007 and 2010 studies, the shares of the number and value of the different payment methods are similar across all days of the diary. This is slightly surprising as individuals might, for example, have been expected to increasingly overlook low-value cash payments, resulting in declining cash use over the study period. Alternatively, use of the payments diary may have caused individuals to modify their typical payments behaviour, perhaps by causing them to bring forward some payments to the early days of the diary period. Regardless of the cause of the ‘survey fatigue’, the consistency of the payment shares and the similar patterns across the two studies suggest that the results of the study are reliable.[22]
Another potential issue with the results is seasonal patterns, which can be significant in payments data. Whereas the 2007 Study was conducted in June, the 2010 Study was conducted in October/November. However, using merchant acquiring data obtained from a major bank, we were able to confirm that these dates were broadly neutral in terms of seasonal changes in both the overall levels of spending and the relative spending across payment methods. Importantly, the diary dates avoided the months around the end of the year when there are significant seasonal effects owing to factors such as Christmas shopping, sales and summer holidays.
| Payments(a) | Cash withdrawals |
|---|---|
| Date | Date |
| Day of week | Day of week |
| Payment amount (nearest dollar) | Withdrawal amount (nearest dollar) |
| Card surcharge paid (yes/no) | ATM operator fee paid (yes/no) |
| Payment method: | Withdrawal method: |
| 1 – Cash | 1 – ATM |
| 2 – ATM/eftpos | 2 – eftpos cash-out |
| 3 – Visa Debit/Debit MasterCard | 3 – Over-the-counter at a bank branch |
| 4 – Visa/MasterCard credit | 4 – Other (friends, Medicare office) |
| 5 – American Express/Diners Club | |
| 6 – Personal cheque | |
| 7 – BPAY | |
| 8 – Internet/telephone-banking transfer (pay anyone) | |
| 9 – PayPal | |
| 0 – Paymate | |
| X – POLi | |
| V – Other | |
| Payment channel: | |
| 1 – In person | |
| 2 – Phone | |
| 3 – Internet | |
| 4 – Mail | |
| Merchant category: | |
| A – Supermarket/bottle shop | |
| B – Small food store (butcher, deli, greengrocer) | |
| C – Electrical/furniture | |
| E – Other retailer (department, book, newsagent, hardware) | |
| F – Take-away food/fast-food | |
| G – Café/restaurant | |
| H – Pub/bar | |
| K – Petrol/service station | |
| L – Transport (tolls, parking, public transport, taxi) | |
| M – Leisure/sports/entertainment | |
| N – Holiday travel (accommodation, flights, car hire) | |
| P – Household bills (rent, phone, Pay TV, school fees) | |
| R – Medical/health | |
| S – Services (plumber, hairdresser, baby sitter, accountant) | |
| Z – Other | |
| (a) Participants were asked not to record: payments made for any business purpose; direct debits from deposit accounts or credit cards; payments made by someone else from a joint account; transfers of funds between members of the household; or loan repayments | |
Footnotes
In addition to incomplete responses, one response was dropped because of implausibly large payment values for all transaction types. [21]
See Schmidt (2011) for a review of the literature on survey fatigue and an empirical analysis of survey fatigue in the 2008 diary study conducted by the Deutsche Bundesbank. Similar to the results here, Schmidt finds evidence of survey fatigue, but with a similar distribution of payments on each day, so that there is no bias with respect to the recording of low-value cash payments. [22]