
Bulletin – May 2026 Finance Developments in Banks’ Funding Costs and Lending Rates

Abstract
Bank funding costs and lending rates declined in 2025 as the RBA cut the cash rate and have risen in early 2026 alongside increases in the cash rate. Bank funding costs are estimated to have declined relative to the cash rate since January 2025. This decline reflects a fall in the estimated cost of banks’ interest rate hedging, while changes in the cash rate have passed through to banks’ (unhedged) deposit and debt costs in line with historical experience. Over the period, lending rates have moved broadly in line with the cash rate and other reference rates. Accordingly, the spread between banks’ lending rates and funding costs has widened, though it remains narrower than pre-pandemic levels.
Introduction
Banks’ funding costs and lending rates are important in the transmission of monetary policy. The cash rate and expectations for the future path of the cash rate have a strong influence on banks’ funding costs, which, in turn, are a key determinant of the interest rates at which banks lend to households and businesses. This article examines developments in the banks’ funding costs and lending rates over 2025 through to March 2026.1
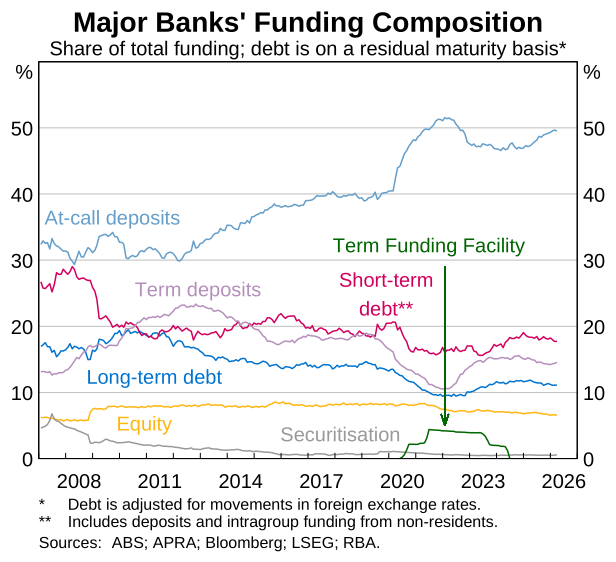
Banks raise funding from a range of sources, including deposits, debt and equity.2 Deposits account for around two-thirds, debt almost one-third and equity less than one-tenth of major banks’ funding (Graph 1). The share of funding sourced from at-call deposits has increased a little since the beginning of 2025, alongside strong growth in credit. At the same time, there has been a small shift from term deposits to at-call deposits, consistent with a modest decline in the spread between term deposit rates and at-call deposit rates.
Major banks’ funding costs are estimated to have declined relative to the cash rate since January 2025
Changes in the cash rate typically pass through almost fully to bank funding costs. That is, when the cash rate rises or falls, banks’ funding costs generally increase or decrease by a similar amount. This happens because banks structure most of their liabilities to have variable-rate payments, either directly or after hedging. They do this to mitigate interest rate risk, as most of their assets are variable-rate loans. The rates banks pay on their variable-rate liabilities, and hence their overall funding costs, tend to move broadly in line with the cash rate over the medium term.
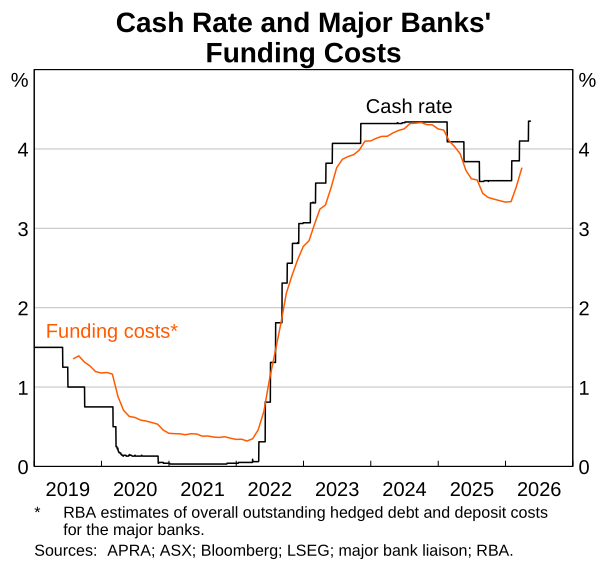
However, we estimate that major banks’ funding costs have declined relative to the cash rate since January 2025 (Table 1; Graph 2). This decline has been driven by interest rate hedging costs, which we estimate to have fallen significantly in 2025 relative to previous easing phases. The rates banks paid on deposits and debt (before hedging) fell by a little less than the cash rate over 2025 and rose by a little less than the cash rate in early 2026, which is in line with past episodes when the cash rate was changed. However, actual funding costs may vary from our estimates, which rely on simplifying assumptions about hedging practices. Individual banks’ funding costs may also vary depending on their specific funding and hedging strategies.
| Latest value | Change since January 2025 | Contribution to change | |
|---|---|---|---|
| Per cent | Basis points | Basis points | |
| Total funding costs | 3.76 | −47 | |
| Outstanding deposit rates | 3.45 | −29 | −18 |
| – At-call deposits(a) | 3.24 | −18 | −9 |
| – Term deposits | 4.15 | −57 | −9 |
| Outstanding debt rates | 3.76 | −39 | −13 |
| Funding composition | −1 | ||
| Hedging costs | −15 | ||
| For reference: cash rate target | 4.10 | −25 | |
|
(a) Includes (non-interest bearing) transactions deposits, savings deposits and deposits in loan offset accounts. Sources: APRA; ASX; Bloomberg; LSEG; major bank liaison; RBA. |
|||
Deposit costs
Deposit costs declined by less than the decline in the cash rate over 2025 and rose by less than the cash rate as it was increased in early 2026. This is consistent with past easing and tightening phases (Graph 3). On average, at-call deposit rates have adjusted by less than the cash rate. By contrast, new term deposit rates have adjusted broadly in line with the cash rate. This reflects the fact that most term deposits are priced against bank bill swap rates (BBSW), which are strongly influenced by expectations for the cash rate (Black and Titkov 2019).
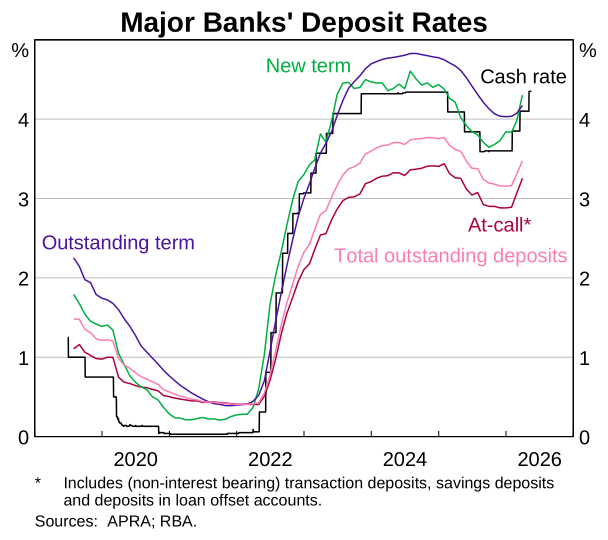
The weaker pass-through of cash rate changes to at-call deposit rates mainly reflects two factors. First, cash rate changes have limited influence on the rates paid on those at-call deposit accounts that offer little or no interest (e.g. transaction accounts). Second, for savings accounts that offer a base rate plus a bonus rate of interest, there tends to be weaker pass-through of cash rate changes to the base rates than to the bonus rates (ACCC 2023). Around one-fifth of deposits in these savings accounts receive only the base rate due to depositors not meeting the conditions required for receiving the bonus rate.
Over the past year, some banks have said that stronger competition for deposits has weighed on profitability. At the same time, deposit balances – particularly term deposit balances – have become a little less concentrated among banks, which is often correlated with more competitive pressure in deposit markets (Drechsler, Savov and Schnabl 2017). While more competition could result in a widening in spreads between deposit rates and their corresponding reference rates, such as the cash rate or BBSW, there has been little evidence of this at the aggregate level. However, there has been some indication of increased competition for deposits in non-price factors. For example, a few banks have promoted savings accounts that do not require depositors to meet bonus conditions to achieve competitively priced deposit rates.
Wholesale debt costs
Major banks’ wholesale debt costs declined over most of 2025 and have risen since late 2025. In line with past experience, there has been strong (though less-than-full) pass-through from changes in the cash rate to wholesale debt costs. This reflects the link between the bulk of banks’ wholesale debt and Australian short-term market rates that move closely with the cash rate. Banks’ domestic debt is mostly composed of bank bills and floating-rate bonds, on both of which banks usually pay BBSW (plus a spread), while only a small share is fixed-rate bonds (Johnson 2022). And banks generally swap the principal and interest payments on their offshore debt into Australian dollar exposures, at Australian short-term interest rates, using foreign exchange swaps and cross-currency basis swaps (Atkin and Harris 2023).
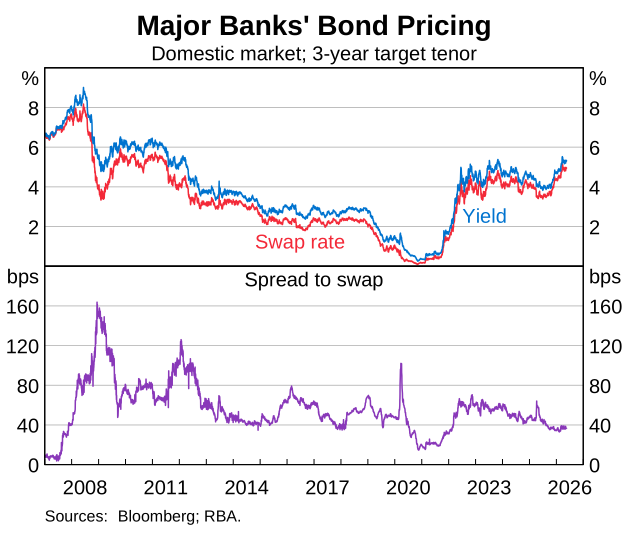
Wholesale market conditions have generally been favourable for bank issuance over 2025 and into 2026. This has been reflected, for example, in the spread between bank bond yields and swap rates having declined to its narrowest level since 2022 (Graph 4). Consistent with favourable funding conditions and strong credit growth, the pace of bank bond issuance in 2025 and early 2026 has been in line with its average of the past decade, relative to GDP. The pace of issuance slowed a bit at the onset of the Middle East conflict but has since recovered. The spread between bank bond yields and swap rates was little changed over the period (RBA 2026).
Hedging costs
Banks use hedges to reduce the interest rate risk that arises from making interest payments on their liabilities that are generally less sensitive to broader interest rate changes than are the interest earnings on their assets. This hedging involves banks entering into interest rate swaps on which they pay floating-rate cash flows (typically at BBSW) and receive fixed-rate cash flows (at the swap rates that prevailed when the hedges were established). As such, the cost of these hedges generally rises and falls with the cash rate as the floating-rate cash flows paid on the hedges rise and fall.3 Without hedging, declines in the cash rate could reduce banks’ net interest margins (NIMs) and profitability, as the interest banks earn on their assets would typically fall by more than the interest they pay on their liabilities.
We cannot observe banks’ hedging costs directly. Instead, we estimate these costs using observed changes in market interest rates and models that use simplifying assumptions about banks’ hedging practices, which have been informed by liaison. While our estimates of hedging costs are broadly consistent with bank commentary, the actual hedging costs faced by banks may differ from our estimates.
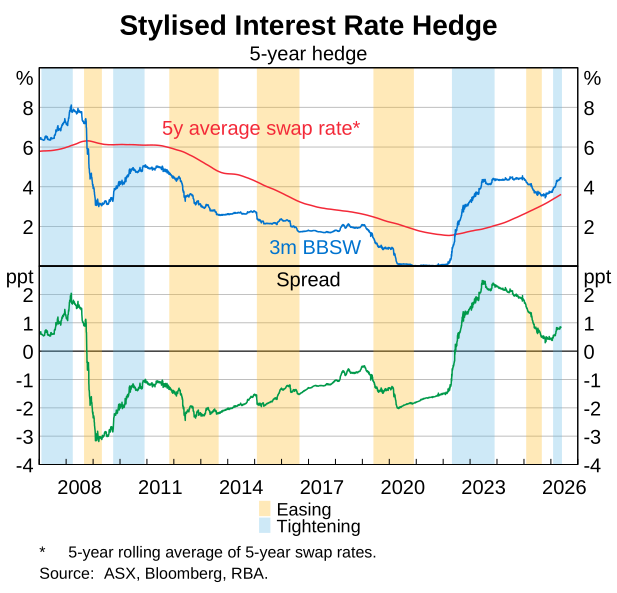
Over 2025, we estimate that major banks’ hedging costs fell by more than would typically occur for the given reduction in the cash rate. This is explained by the period of historically large and rapid cash rate rises in 2022–2023, during which the swap rate received by banks on newly transacted interest rate swaps increased. As a result, the average swap rates that banks received on their hedges rose over 2025, as the hedges that were entered earlier at lower swap rates were replaced by hedges with higher swap rates (Graph 5). This differs from previous easing phases, which did not come so soon after tightening phases that were as sharp. At the same time, the BBSW paid on these hedges declined with the cash rate over 2025. As a result, hedging costs are estimated to have declined significantly. In their 2025 profit reports, some banks pointed to lower hedging costs as one factor supporting their NIMs.
Banks have passed through changes in the cash rate to lending rates
Major bank lending rates to households and businesses declined through 2025 and have increased in 2026, broadly in line with changes in the cash rate. Spreads between lending rates and the cash rate have remained at their narrowest levels in almost two decades, reflecting low bank funding costs (relative to the cash rate) and strong competition between lenders (Jennison, Spiller and Wallis 2026). The narrow spread between lending rates and the cash rate means that financial conditions are more accommodative than would otherwise be the case and is one of many factors that has been considered in the setting of monetary policy (Kent 2026).
Housing lending rates
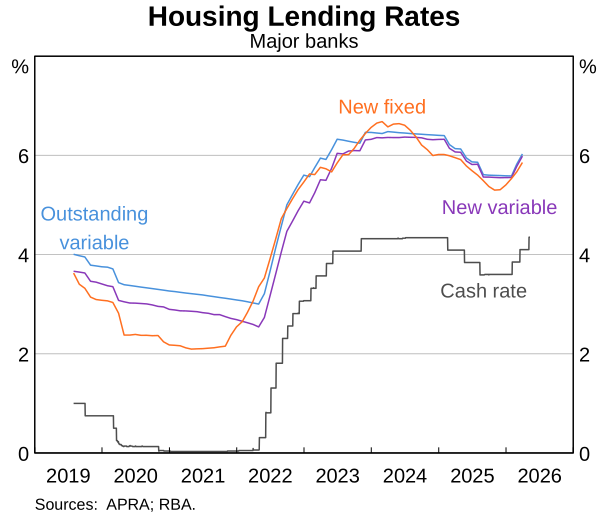
Banks fully passed through cash rate reductions to lending rates on new variable-rate housing loans in 2025 and have increased lending rates broadly in line with the cash rate in early 2026. (Graph 6). The spread between the average outstanding and average new variable rate has narrowed a little further since the beginning of 2025, to just 4 basis points. This is likely to reflect some borrowers continuing to secure lower rates on their mortgages by refinancing with another lender or negotiating with their existing lender. In addition, the substantial share of borrowers who, over recent years, secured larger discounts (relative to standard variable rates) have not seen these discounts unwind (Jennison, Spiller and Wallis 2026). New fixed mortgage rates declined through most of 2025 and began to increase around the end of 2025, following movements in tenor-matched swap rates, which they typically reference.
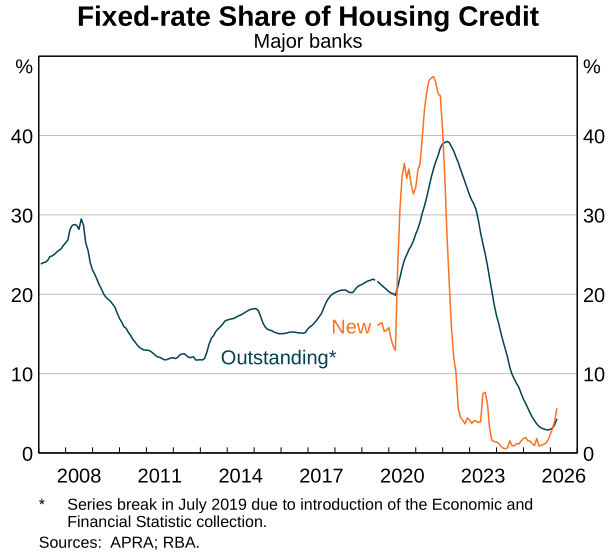
The share of outstanding housing loans with fixed rates fell to a historical low of less than 5 per cent in 2025 (Graph 7). This reflects the large volume of fixed-rate loans taken out during the pandemic having rolled onto variable rates, while only a small share of new mortgage lending by major banks has been at fixed rates since late 2023. All else equal, a lower fixed-rate share of lending increases the sensitivity of household cash flows to changes in interest rates, increasing the strength of monetary policy transmission through that channel (Kent 2024). However, many households have sizeable buffers in mortgage offset and redraw accounts, which can be used to smooth consumption in response to changes in mortgage repayments.4 Over the past five years, the share of housing loan facilities with an offset account has increased from around 40 per cent to 55 per cent, and the share with redraw facilities has increased from around 70 per cent to 80 per cent.
Business lending rates
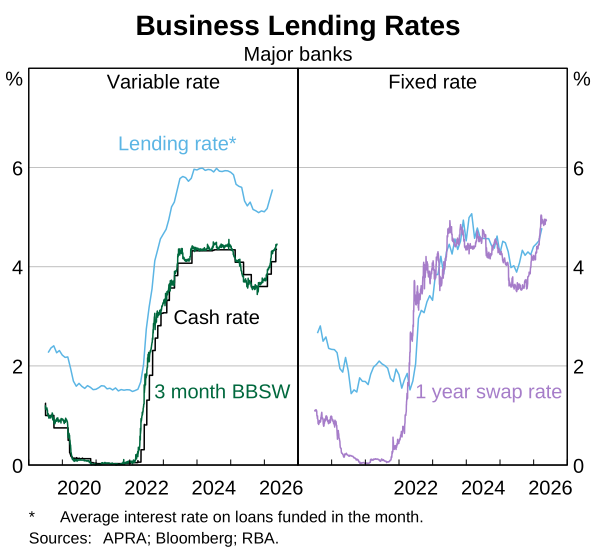
Variable-rate business loans are typically priced with reference to short-term interest rates, such as the cash rate or BBSW. New variable rates declined in 2025 and have increased in 2026, in line with movements in these short-term rates (Graph 8). Similarly, new fixed rates declined in early 2025 and have increased since late 2025, following movements in the tenor-matched swap rates that they are generally set against. Fixed-rate lending remains a small share of total business lending.
Lending spreads and net interest margins remain low relative to pre-pandemic levels
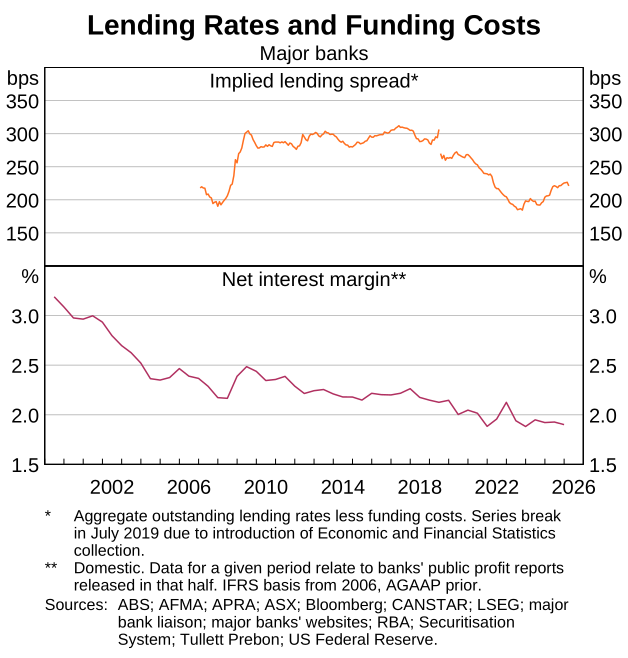
We estimate that the spread between banks’ lending rates and funding costs has increased since early 2025 but remains well below its pre-pandemic levels (Graph 9). The widening in this lending spread reflects our estimate that funding costs have declined relative to the cash rate, due to a strong decline in hedging costs, while lending rates have moved broadly in line with cash rate changes. By contrast, banks’ NIMs – a broader measure of bank profitability – stabilised in 2025 around historical lows. NIMs measure the difference between total interest income (on loans and other interest-earning assets) and interest expenses, divided by interest-earning assets, while the lending spread excludes the effect of non-loan interest-earning assets. Bank commentary suggests that competition in deposit and lending markets weighed on NIMs and lending spreads in 2025, while a shift by some banks towards higher margin business lending supported these metrics.
The difference between recent trends in NIMs and estimated lending spreads may partly reflect the breadth of the measures. It may also reflect that NIMs capture banks’ actual hedging costs, whereas our measure of lending spreads is derived from our estimates of funding and hedging costs. The stabilisation in NIMs alongside the increase in estimated lending spreads may therefore indicate that we have over-estimated the recent decline in hedging costs.
Conclusion
Banks have passed on the cash rate reductions in 2025 and increases in early 2026 to deposit and lending rates, in line with previous easing and tightening phases. However, we estimate that overall funding costs have declined relative to the cash rate over this period, due to a large decline in the costs banks face in hedging interest rate risk. As a result, the estimated spread between lending rates and funding costs has risen from low levels. By contrast, banks’ NIMs remain around historical lows.
Endnotes
* Paul Hutchinson and Patrick Manning are from Domestic Markets Department and Emma Searle completed this work while in Domestic Markets Department. The authors would like to thank Iris Chan, Michael Thornley, Vikas Vashishtha, Josh Spiller and Peter Wallis for their assistance.
1 Data on banks’ funding costs and lending rates are currently available up to March 2026.
2 In this article, our estimates of the costs of banks’ funding include deposit and debt costs, which are strongly influenced by monetary policy settings, and exclude the costs of equity funding.
3 Banks use two main types of interest rate hedges: a ‘replicating portfolio’ hedge for zero or near-zero rate deposits and a ‘whole-book’ hedge to reduce interest rate risk across their entire balance sheet (De Zoysa, Dunphy and Schwartz 2024). These hedges transform the fixed (or zero) interest rate payments on banks’ liabilities into floating rate payments, such as BBSW, that move with changes in the cash rate.
4 There is evidence from 2022 to 2023 that households facing higher mortgage payments drew down on savings buffers to smooth consumption when interest rates were rising. For example, the spending of households with variable-rate mortgages remained similar to households with fixed-rate mortgages for at least two years after interest rates started to increase (Elias et al 2025).
References
ACCC (Australian Competition and Consumer Commission) (2023), ‘Retail Deposits Inquiry’, Final Report, December.
Atkin T and J Harris (2023), ‘Foreign Currency Exposure and Hedging in Australia’, RBA Bulletin, March.
Black S and D Titkov (2019), ‘Developments in Banks’ Funding Costs and Lending Rates’, RBA Bulletin, March.
De Zoysa V, J Dunphy and C Schwartz (2024), ‘Bank Funding and the Recent Tightening of Monetary Policy’, RBA Bulletin, April.
Drechsler I, A Savov and P Schnabl (2017), ‘The Deposits Channel of Monetary Policy’, The Quarterly Journal of Economics, 132(4), pp 1819–1876.
Elias M, C Gillitzer, G Kaplan, G La Cava and N Prasad (2025), ‘The Mortgage Debt Channel of Monetary Policy When Mortgages Are Liquid’, RBA Research Workshop on Quantitative Macroeconomics, 11–12 December.
Jennison S, J Spiller and P Wallis (2026), ‘Recent Changes in Credit Markets and Their Implications for Monetary Policy’, RBA Bulletin, February.
Johnson C (2022), ‘Trends in Australian Banks’ Bond Issuance’, RBA Bulletin, September.
Kent C (2024), ‘The Financial System and Monetary Policy in Australia’, Speech at the Sir Leslie Melville Lecture, Canberra, 18 November.
Kent C (2026), ‘Reassessing Australian Financial Conditions’, Address to KangaNews Debt Capital Market Summit, Sydney, 26 March.
RBA (Reserve Bank of Australia) (2026), ‘Chapter 1: Financial Conditions’, Statement on Monetary Policy, May.
Underlying data
This file contains all underlying data that are available for public release. Underlying data