Bulletin – December 2017 Australian Economy Housing Accessibility for First Home Buyers
- Download 1.51MB
Abstract
The ability of Australians to purchase their first home (‘housing accessibility’) has been an important topic of public debate recently. In this article, we construct an indicator of housing accessibility that suggests that the median potential first home buyer can currently afford about one-third of homes in Australia. However, accessibility varies significantly with geographic location, and the quality of housing affordable to potential first home buyers has declined, particularly in Sydney.
Introduction
The affordability of housing, particularly for young Australians and households with low incomes, is an important topic of public debate. The concept of affordability refers to the relative cost of purchasing housing services, which has a number of dimensions. It can refer to how much saving is required to buy a home, how much it costs to repay a mortgage or how much it costs to rent a home.
An important part of housing affordability is the accessibility of ownership; that is, the ability of non-home owners to buy their first home. This article focusses specifically on housing accessibility for young first home buyers (FHBs). We first outline some conventional estimates of housing affordability and discuss their shortcomings. We then propose an alternative indicator of housing accessibility, first discussed in Richards (2008), which tries to address some of these shortcomings. For instance, conventional estimates normally focus on the housing prices and incomes facing the average household. But FHBs are not the average household; they are usually younger, have lower incomes and are less wealthy.
This alternative indicator of housing accessibility has two key features that distinguish it from conventional measures:
- It measures the purchasing capacity of potential FHBs, rather than all households, by using household survey data on the incomes of young renting households.
- It looks at the full spectrum of housing prices, not just the average home price, in a given location by using transaction-level data on home-sale prices.
Given the decision to buy a home is also a choice between renting and owning, the article also briefly discusses trends in the cost of renting.
Conventional Measures of Housing Affordability
Relative housing prices
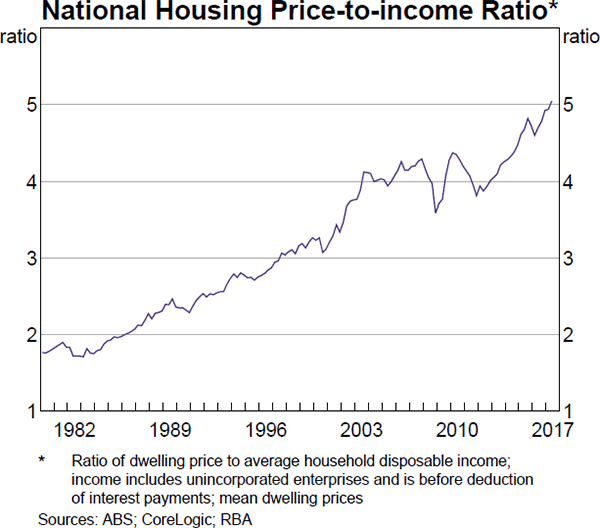
A common measure of housing affordability is the ratio of mean housing prices to mean household disposable income (or the ‘housing price-to-income ratio’; median prices and incomes are also sometimes used). This indicator effectively measures the relative expense of purchasing a home for an average household, and takes growth in real incomes and overall inflation into account. If housing prices are rising relative to household income, then housing is becoming less affordable, all else being equal. This is because a higher ratio implies that households have to borrow more to buy a home. Alternatively, they may need to save a higher share of income, or save for a longer period of time, to accumulate a larger deposit.
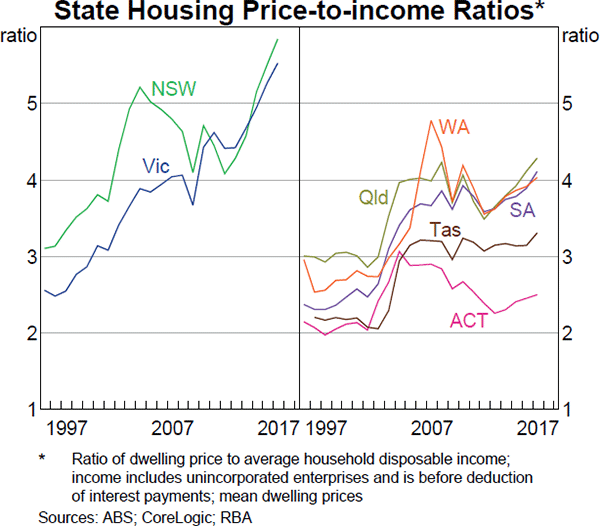
In Australia, the housing price-to-income ratio has increased since the early 1990s, and has increased particularly rapidly over the past five years to reach its highest level on record (Graph 1). At face value, this suggests that housing affordability is at a record low. However, this masks significant differences across states. The recent trend increase in the housing price-to-income ratio is largely due to increases in the ratios in New South Wales and Victoria (Graph 2). The housing price-to-income ratios have increased by less in other states in recent years and suggest that housing affordability in those states is at a similar level to the mid 2000s.
This housing affordability measure accounts for changes in average housing prices and household income. However, it ignores the effect of changes in interest rates on borrowing costs and other financial factors that may affect a household's purchasing capacity and therefore their ability to purchase a home.[1]
Mortgage repayment burden
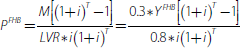
Another common metric for measuring housing affordability is the mortgage debt-servicing ratio. This measure is based on a standard bank loan formula that assumes that mortgage borrowers make constant loan repayments over the life of a mortgage (this is known as a ‘credit foncier’ loan). This ratio is calculated as the monthly required repayment (M) on a new mortgage divided by monthly disposable income (Y):
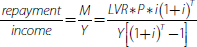
The required repayment is estimated based on the loan-to-valuation ratio (LVR) and dwelling price (P) at the time of loan origination, as well as the per period interest rate (i) and the number of months remaining in the term of the loan (T). This formula is designed to assess the borrowing capacity of individual borrowers. However, it is common for this formula to be used instead to measure housing affordability at the national (or state) level using time-series data for average household income, housing prices and mortgage interest rates, and a given LVR and loan term.
As the formula shows, this measure again captures the effect of changes in the housing price-to-income ratio (P/Y) on housing affordability, but it also captures the effect of interest rates (i) at the time of origination.[2] More specifically, it captures the share of household disposable income that is needed to service a new mortgage given the interest rate, the loan size and term, and household income at the time of origination. As such, it explicitly accounts for the direct effect of interest rates on housing affordability.[3] For example, if interest rates fall, households can afford to repay a larger mortgage, all other things being equal. This would be reflected in a lower mortgage debt-servicing ratio, and would imply greater affordability. There is no role for changes to the deposit burden in the mortgage debt-servicing ratio, as the LVR is considered to be fixed.
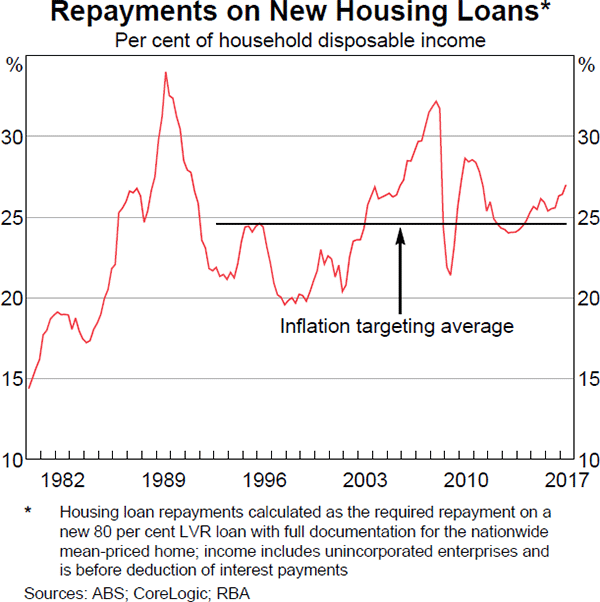
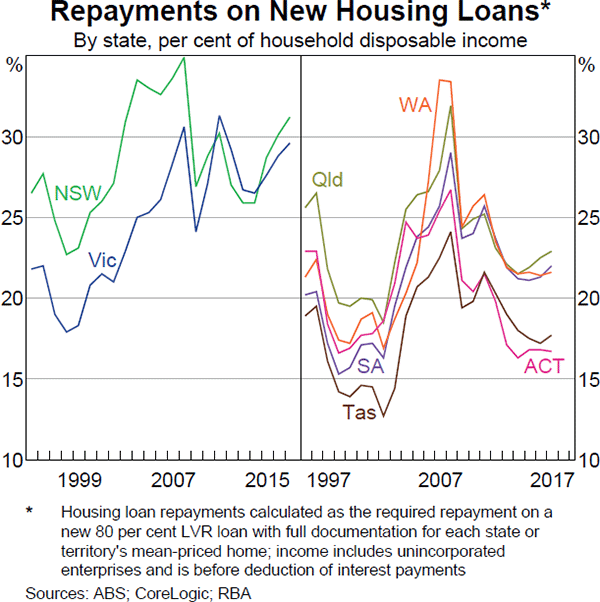
Looking at the trends over time, the aggregate mortgage debt-servicing ratio has risen over the past year or so and is currently above the average of the inflation-targeting period but below historical peaks (Graph 3).[4] This suggests housing affordability has not declined by as much in recent times as the housing price-to-income ratio suggests. The difference is due to the current low interest rate environment in Australia.
Again, trends by state differ from those in the aggregate. According to this measure, housing affordability has declined in New South Wales and Victoria in recent years, although by less than indicated by housing price-to-income ratios (Graph 4). In most other states, housing appears as affordable as it has been in the past 20 years.
An Alternative Indicator of Housing Accessibility
A shortcoming of the conventional estimates of housing affordability is that, by focussing on the average home price and average household income, they measure affordability for the average household. But the typical FHB is not the same as the average household – they tend to be younger and less wealthy. Also, if most FHBs buy homes that are cheaper than the average, then measures that focus on the average home will provide a poor guide to the ability of FHBs to purchase their first home (i.e. housing accessibility).
To address these shortcomings, we construct a housing accessibility index that specifically focuses on the purchasing capacity of potential FHBs based on Richards (2008). The housing accessibility index is based on the same bank loan formula for the mortgage debt-servicing ratio as before. However, we impose a few assumptions, and manipulate the formula to determine the dwelling price that the median potential FHB could afford (or purchasing capacity; PFHB).[5] The following assumptions are imposed:[6]
- interest rates are assumed to be equal to the annual average of banks' advertised owner-occupier discounted variable package mortgage rates
- the mortgage has a 25-year term
- the required LVR is 80 per cent and buyers have saved the required deposit equal to 20 per cent of the value of the home
- buyers are able to make loan repayments worth 30 per cent of their disposable household income.[7]
More specifically, purchasing capacity is given by the formula:
where the purchasing capacity depends directly on the median income of potential FHBs (YFHB) and the nominal mortgage interest rate (i). All other things being equal, the purchasing capacity of the potential buyer increases with higher income and/or lower mortgage rates because they can borrow a higher amount without exceeding the repayment threshold.
An important component of the formula is the disposable household income of potential FHBs. This is estimated using data from household surveys conducted by the Australian Bureau of Statistics (ABS).[8] These surveys provide annual snapshots of housing and income-related data for individual Australian households. The surveys are available on an irregular basis prior to 1994/95, but are available roughly every two years between 1994/95 and 2015/16.
Using the household surveys, potential FHBs are defined as households that are renting and have a household head aged between 25 and 39 years.[9]
Household survey data indicate that more than 60 per cent of FHBs come from this age group.[10] For the six states, we obtain median disposable household income for this group by capital city and by ‘rest of state’ (i.e. regional areas).
Growth in the purchasing capacity of the median potential FHB has generally outpaced their household income growth due to falls in nominal interest rates. FHB purchasing capacity is very sensitive to interest rates, which are currently at a very low level; if interest rates in 2016 had instead been equal to their average over the 1995 to 2016 period, the purchasing capacity of FHBs would have been about 18 per cent lower, all else being equal.[11]
To examine trends in housing accessibility, we can look at how the purchasing capacity of FHBs has evolved over time relative to movements in actual housing prices. The housing transaction data used in this analysis are sourced from CoreLogic. The benefit of these data is that they can provide information on the distribution of housing prices within each major capital city and regional area. More specifically, the annual data can be separated into percentiles, allowing us to see how FHBs' purchasing capacity has changed relative to the housing price distribution over time. Note that these data relate to all dwellings (i.e. both houses and apartments).[12]
A useful feature of this housing accessibility measure is that the level is easy to interpret.
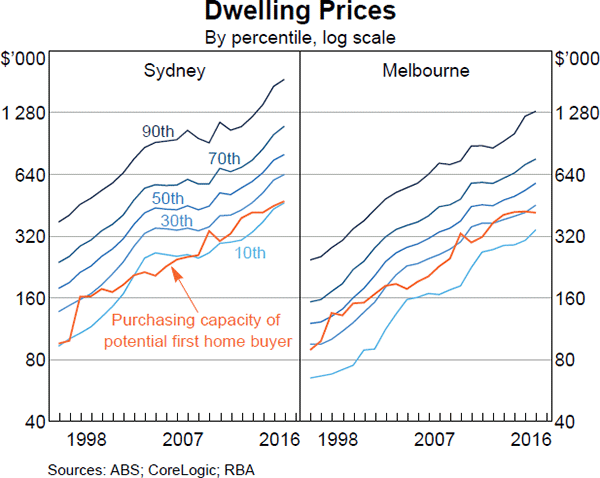
To take an example, the purchasing capacity of the median potential FHB in Sydney in 2016 is estimated to have been around $474,000. By comparison, the median home price was $800,000, while the housing price at the 10th percentile was $465,000 and at the 90th percentile was almost $1,900,000. Therefore, the estimates indicate that the median potential FHB in Sydney could afford just over 10 per cent of homes sold there in 2016.
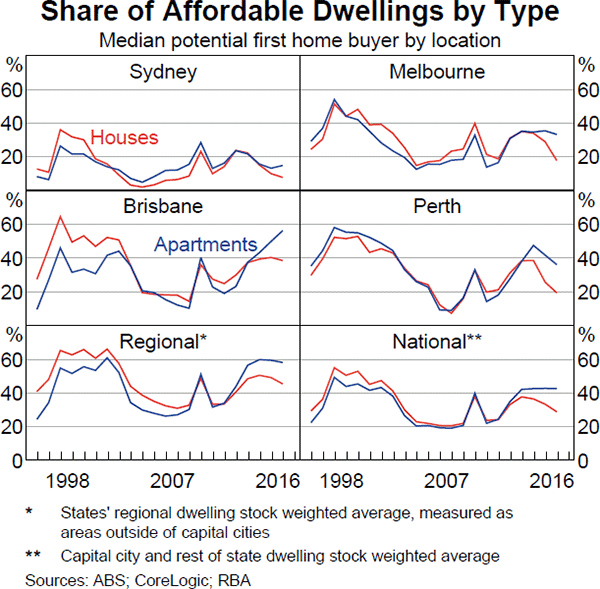
Over the past 20 years, the median potential FHB could generally afford to buy around 10 to 30 per cent of the homes for sale in Sydney (Graph 5). This has varied over housing price and interest rate cycles, but the purchasing capacity of the median potential FHB has never been close to the median-priced property in Sydney. In Melbourne, the median potential FHB has generally been able to afford a greater proportion of the homes for sale, often 30 per cent and in the late 1990s, as high as 50 per cent.
Nationally, the median potential FHB could afford around 32 per cent of all homes sold in 2016 (Graph 6). This is about the average of the past 20 years. Of the capital cities, the most accessible for FHBs has been Hobart. A decline in potential FHB incomes in Perth in recent years has decreased accessibility there despite falling housing prices. The housing accessibility indicator suggests that potential FHBs could afford more homes in regional areas than in capital cities; the median potential FHB could afford almost half of the housing stock sold in 2016 in regional areas, which was a little higher than the average of the past 20 years.
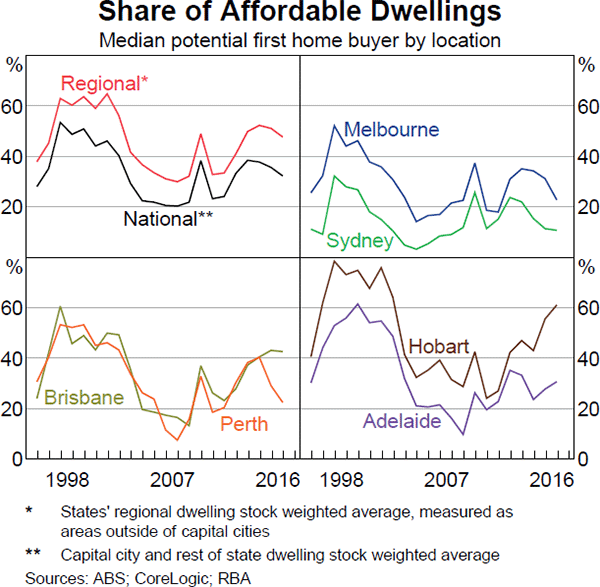
The share of homes affordable for FHBs differs by city, but the trends in accessibility have tended to follow a similar cyclical pattern. This is due to the accessibility measure being very sensitive to changes in interest rates. For example, the spike in the share of affordable properties for the median potential FHB in 2009 can be attributed to a significant decrease in interest rates, which was partially unwound over the following two years. While interest rates have declined since 2011, higher housing prices and lower income growth have lowered accessibility in around half of the cities and regions recently. Increases in potential FHB incomes have improved accessibility in other areas.
Another advantage of the CoreLogic transaction data is that they contain information on the characteristics of each property sold in Australia, so we can also examine the quality of the homes affordable to FHBs. For example, using the same methodology, a higher share of detached houses than apartments has typically been affordable using our measure (Graph 7). This can be explained by apartments typically being closer to the CBD, which is an important aspect of housing quality for many people as jobs have become more concentrated in our cities' CBDs over time (Ellis 2014). In Melbourne, for example, 45 per cent of houses sold from 1995 to 2016 were in the outer suburbs (more than 25 kilometres from the CBD) but 82 per cent of apartments sold were located in the inner and middle ring suburbs (less than 25 kilometres from the CBD). Despite this, houses have become less affordable than apartments in all cities and regions recently. This is likely to be due to an increase in the relative scarcity of houses given the large increase in the supply of apartments over the past few years (Rosewall and Shoory 2017).
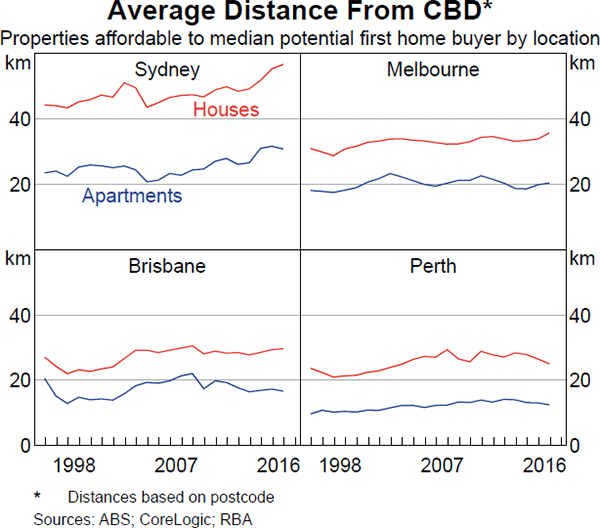
In Sydney, the average distance to the CBD of homes that our measure suggests are accessible to the median potential FHB has trended up fairly consistently over the past decade for both houses and apartments (Graph 8). In other capital cities there has been only a slight increase in the average distance of affordable homes from the CBD over the past two decades, even as city limits have expanded, and affordable homes are typically much closer to the CBD than in Sydney.
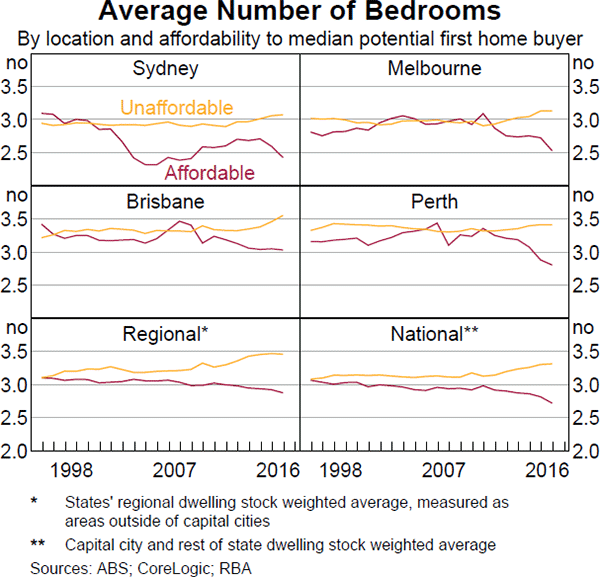
Another measure of quality is the average number of bedrooms of the dwellings affordable to median potential FHBs. In all capital cities, the average number of bedrooms in affordable housing has declined over the past 20 years, most notably in Sydney (Graph 9). This partly reflects apartments being smaller and an increased share of affordable homes, although the average number of bedrooms for affordable houses has also declined over time. In contrast, the average number of bedrooms in the housing stock assessed as being out of reach of FHBs has increased, and the average number of bedrooms of all homes sold between 1995 and 2016 has increased slightly in aggregate. This, along with the increase in the average distance from the CBD, suggests that there has been some structural decline in the quality of housing that is affordable to FHBs.
Overall, this measure suggests that housing accessibility (abstracting from quality changes) has fluctuated over the past two decades, rather than experienced a trend decline. Nevertheless, the 2016 Census data indicated that home ownership rates among younger households have decreased consistently over the past two decades. In addition, the shares of affordable dwellings calculated above are higher than FHBs' share of owner-occupier loan approvals in most years, suggesting that other factors may have restricted FHBs from entering into the market.
Sensitivity Analysis
The estimated purchasing capacity of FHBs is sensitive to the assumptions outlined earlier. For example, the required deposit was assumed to be a constant share of the dwelling price. As the dwelling price-to-income ratio increases over time, we have assumed that a household's deposit (relative to income) correspondingly increases. This ignores that households now have to save more, and often for longer, to accumulate the required deposit. Under our assumption of a 20 per cent deposit, the deposit-to-income ratio has increased over time from about 70 per cent to over 110 per cent of the median potential FHB's annual income. If we instead hold the deposit constant at 70 per cent of household income, FHBs' purchasing capacity decreases and the nationwide share of affordable dwellings would have been about 6 percentage points lower in 2016 than shown by our measure.
We also assumed that a household's borrowing capacity was limited such that repayments would equal 30 per cent of disposable household income. However, some households may be willing and able to spend more of their income on housing; lender serviceability tests that take expenses into account may result in a higher figure. Allowing potential FHBs to spend 40 per cent of their income on repayments increases the share of affordable dwellings by around 20 percentage points on average nationally. This is a significant increase, but there may be a trade-off between greater housing accessibility initially (due to relaxed financial constraints) and a higher possibility of mortgage stress (due to more income being devoted to repayments) at a later stage when incomes may fall or interest rates or expenses may rise.
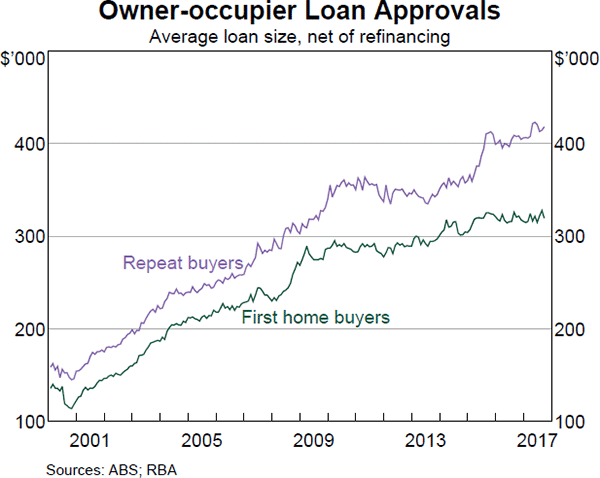
This is a drawback of this housing accessibility measure more generally. It ignores the lifetime loan repayment burden and possible subsequent mortgage stress when making comparisons across time, as it takes the interest rate and income at loan origination as fixed and does not consider how these may change after the purchase is made. Prudent lenders, on the other hand, do attempt to take account of the lifetime loan repayment burden. Indeed, since 2014, the Australian Prudential Regulation Authority (APRA) has introduced measures to ensure this is the case.[13] Accordingly, although this measure of housing accessibility assumes that purchasing capacity increases with declining interest rates (all else being equal), FHBs (generally being the most financially constrained buyers) are not always able to increase their loan size in response to lower interest rates because of lenders' policies. Indeed, the average FHB loan size has been little changed over recent years while the gap between repeat buyers and FHBs' average loan sizes has widened (Graph 10). This is likely because there has been little or no change in the interest rate used to calculate allowable loan sizes, which generally does not decrease by as much as actual mortgage rates. Therefore, borrowers for whom financial constraints are not binding (typically repeat buyers who are trading up or down and investors) may have a relative advantage during low interest rate periods, as they can increase their loan size and make larger offers for specific properties (RBA 2014). Holding purchasing capacity constant to reflect these financing constraints from 2014 lowers the share of affordable dwellings for potential FHBs slightly, by about 2¼ percentage points in 2016.
There are other caveats to our analysis. The analysis focussed on the median potential FHB and did not consider differences in purchasing power and expenses across the group of potential FHBs. There may be important distributional aspects to housing accessibility for FHBs that are not captured in this measure. In addition, if more higher-income renter households do not move into home ownership over time, the income of the median renter household may be skewed upwards and could mask real changes to accessibility.[14]
We also assumed the mortgage term was fixed at 25 years; however, 30-year terms have become increasingly common. If we instead allowed median potential FHBs to take out mortgages with 30-year terms, the national share of affordable dwellings in 2016 would be about 7 percentage points higher.
Lastly, our analysis abstracts from the effect of government incentives such as FHB grants and stamp duty savings. However, these incentives are estimated to have had little effect on the calculated shares of affordable homes.
Rental Affordability
Housing affordability is also an issue for the large number of households that rent a dwelling. The majority of Australian households are owner-occupiers, but the share of private renter households has increased over the past few decades to almost a third. One measure of rental affordability is the ratio of rent paid to household income. ABS household surveys show that over the past decade, this has trended up as rents have increased by more than households' disposable income (Graph 11). Disaggregating households by income quintile allows us to examine the distributional differences in rental affordability; about half of all renter households are in the first and second household income quintiles and pay a much higher proportion of their income in rent than renters in higher-income quintiles. For renters in the first income quintile, the ratio of rent paid to household income has been increasing over the past 20 years.
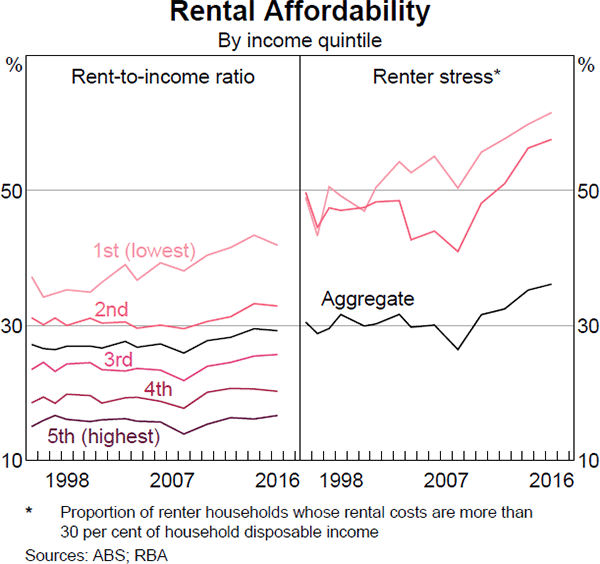
Another indicator of rental affordability is the share of households whose rental costs are more than 30 per cent of their disposable income. This is considered an indicator of renter stress (at least for low-income households) and has increased markedly over the past decade for the two lowest income quintiles. Census data also show an increase in the proportion of households in renter stress in all capital cities except Darwin between 2011 and 2016, and that almost 60 per cent more Australian households are in renter stress than in mortgage stress in 2016.[15]
This suggests that housing costs are an increasing share of disposable income for often the most disadvantaged in society, which might reduce their capacity to spend on other goods and services. While Australia does have social housing and affordable housing programs, reports from the Bank's liaison program suggest demand for it far outstrips supply and low-income earners are often forced into the private market. Further, there are non-rent costs associated with renting. For example, renters move more often than owners (and often not by their choice), which is costly and disruptive (Ellis 2017). Inferior housing and housing insecurity may also affect social outcomes and mental and physical health (Evans, 2003; Evans, Wells and Moch, 2003).
Summary
Housing affordability, particularly for young FHBs, can be difficult to measure. A conventional affordability measure such as the housing price-to-income ratio suggests that housing has never been less affordable in Australia. But this story has been largely confined to Sydney and Melbourne in recent years. Another conventional affordability measure, which captures the cost of servicing mortgage debt relative to income, suggests that housing affordability is around its long-run average due to the low level of mortgage interest rates in recent years.
We construct an alternative indicator to measure housing accessibility for FHBs specifically, that is, the ability of renters aged between 25 and 39 years to buy their first home. This measure combines information from household surveys with data on all housing sale transactions in Australia. It shows housing accessibility is around the long-run average in aggregate in Australia, with the median potential FHB being able to afford around one-third of all homes sold in 2016, although this share is significantly lower in Sydney, Melbourne and Perth. Moreover, the quality of homes that potential FHBs can afford has fallen over time, as measured by location and the number of bedrooms. This measure also shows accessibility is lower in capital cities, particularly in areas close to the CBD.
The cost of renting is also an important component of housing affordability and the number of households renting has trended up over the past few decades. In aggregate, rents have grown broadly in line with household incomes, although rent-to-income ratios suggest housing costs for lower-income households have increased over the past decade.
Footnotes
The authors are from Economic Group. [*]
That housing prices and household income are also affected through interest rates in a variety of ways complicates this further. [1]
The measure is ‘static’ in that it captures housing affordability at the time of purchase. For a given borrower, the measure ignores changes to mortgage interest rates and income that occur after purchase. For instance, the repayment burden of a specific loan for a given borrower tends to fall over time as income rises and the borrower makes their repayments. [2]
However, lower interest rates also mean less interest is paid on savings, which makes it harder to save for a home deposit. At the same time, lower interest rates may also contribute to rising housing prices. [3]
The average for the inflation-targeting period is considered a relevant comparison because prior to that period inflation and thus interest rates were much higher. [4]
The median rather than mean income of potential FHBs is used so that very large or very low incomes do not skew our results. [5]
The assumptions of a constant loan term, a constant LVR and constant repayments are clearly simplifications; however, fixing these allows us to gauge the relative contributions of household income growth, interest rates and housing prices to overall housing accessibility. Simon and Stone (2017) suggest that LVRs for FHBs have been broadly stable since 2001 at 83 per cent. We examine the sensitivity of our results to these assumptions later. [6]
This is based on historical rules of thumb that imposed this repayment-to-income ratio as a criterion for determining maximum allowable loan sizes. More sophisticated serviceability tests that take borrowers' expenses and other circumstances into account generally produce implied repayment-to-income ratios of between 30 and 50 per cent. [7]
In this article we use a number of ABS household surveys, all of which survey a representative sample of Australian households and provide income, age and housing status data on these households. The surveys are: the 1994/95, 1995/96, 1996/97, 1997/98, 2002/03, 2003/04, 2005/06, 2007/08, 2009/10, 2011/12, 2013/14 and 2015/16 Survey of Income and Housing; and the 1999/00 and 2000/01 Survey of Income and Housing Costs. Although the name of the survey has changed over time, it is one survey that focuses on income and housing. [8]
We include all households in this defined group regardless of employment status, but exclude those on incomes below government assistance minimums. [9]
These household surveys directly identify actual FHBs but these data are ignored because the focus is on potential FHBs. [10]
However, it is unlikely that all else would have been equal. Interest rates are also a key driver of housing prices. If interest rates had been higher, housing prices are likely to have been lower so that for a given level of purchasing capacity, a FHB would have been able to afford more properties than otherwise. [11]
Relatively more sales may be missing in recent years due to lags in data collection (see Leal et al (2017) for more details). Sales with a price equal to zero in the unit record data indicate transfers of property ownership (for example, by inheritance) and are removed from the analysis. The top 1 per cent and bottom 2.5 per cent of sales by price are also removed. More transactions are removed from the bottom due to the prevalence of tokenistic transfer prices. [12]
In 2014, APRA stipulated that lenders must ensure borrowers are able to afford a floor rate of 7 per cent or actual rates plus 2 percentage points (whichever is highest). Mortgage interest rates have been below 5 per cent since February 2015, suggesting no real change to purchasing capacity from subsequent declines in interest rates. Prior to 2014, minimum rates and buffers were not explicitly regulated; buffers were estimated by APRA to be 1 to 2 percentage points and minimum floor rates were 6 to 7 per cent (Richards 2016). Authorised deposit-taking institutions generally had either a buffer or a floor, but not both, as is now the case. [13]
Simon and Stone (2017) find that fewer people are making the transition from renter to owner-occupier following the global financial crisis than before. Those that do are more financially stable than earlier cohorts. [14]
This is calculated as the percentage of total households with housing costs greater than 30 per cent of gross household income. The picture is even starker when it is considered that this level of housing costs would probably lead to more stress for low-income households, who generally rent. [15]
References
Ellis L (2014), ‘Space and Stability: Some Reflections on the Housing–Finance System’, Address to the CITI Residential Housing Conference, Sydney, 15 May.
Ellis L (2017), ‘Opening Remarks to Plenary Panel at the Australasian Housing Researchers Conference’, Australasian Housing Researchers Conference, Melbourne, 16 February.
Evans G (2003), ‘The built environment and mental health’, Journal of Urban Health, 80(4), pp 536–555.
Evans G, N Wells and A Moch (2003), ‘Housing and mental health: A review of the evidence and a methodological and conceptual critique’, Journal of Social Issues, 59(3), pp 475–500.
Leal H, S Parsons, G White and A Zurawski (2017), ‘Housing Market Turnover’, RBA Bulletin, March, pp 21–30.
RBA (2014), ‘Submission to the Inquiry into Affordable Housing’, Senate Economics References Committee, February.
Richards A (2008), ‘Some Observations on the Cost of Housing in Australia’, Outlook Conference, The Melbourne Institute, Melbourne, 27 March.
Richards H (2016), ‘A prudential approach to mortgage lending’, Macquarie University Financial Risk Day, Sydney, 18 March.
Rosewall T and M Shoory (2017), ‘Houses and Apartments in Australia’, RBA Bulletin, June, pp 1–11.
Simon J and T Stone (2017), ‘The Property Ladder after the Financial Crisis: The First Step Is a Stretch but Those Who Make It Are Doing OK’, RBA Research Discussion Paper No 2017-05.