Reserve Bank of Australia Annual Report – 1990 The Economy and Monetary Policy
World Context
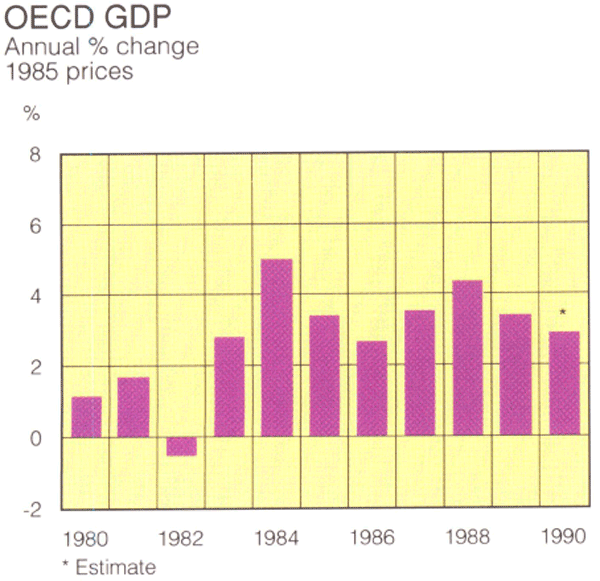
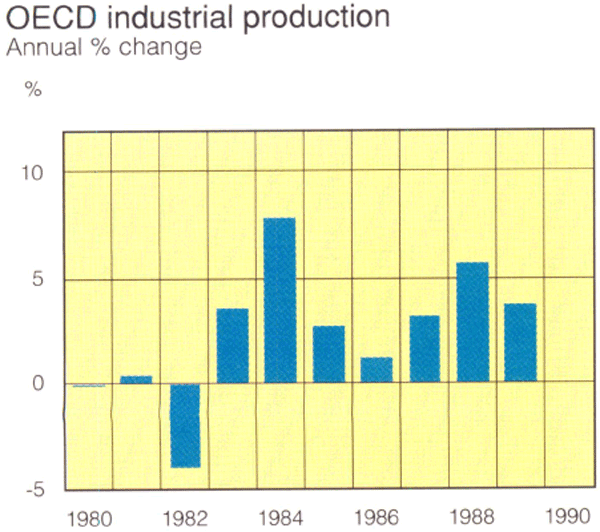
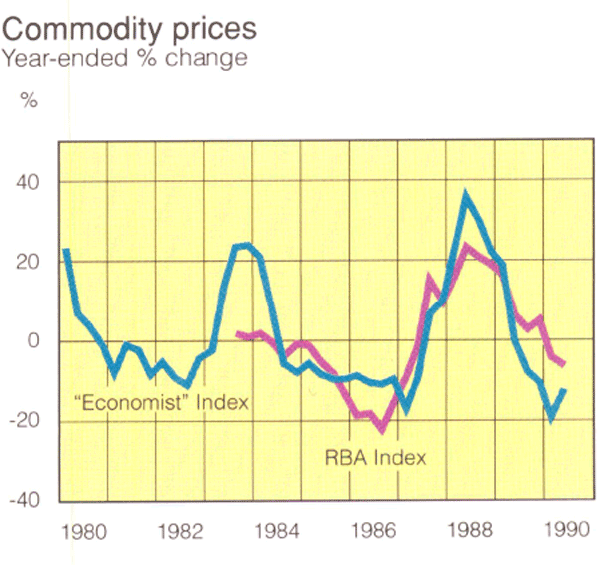
The world economy again provided a relatively benign background for economic developments in Australia in 1989/90. Economic expansion continued into its eighth year, although at a slower pace than in the previous two years. Industrial production also slowed, after very strong growth in 1988. As a result, demand for raw materials eased slightly and indices of international commodity prices fell. Prices of Australia's exports were resilient initially but weakened in the second half of the year.
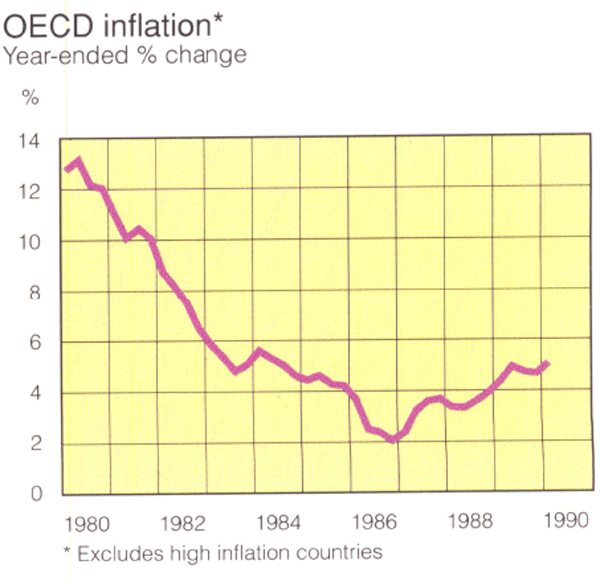
For much of the year, inflation was a major concern of policy-makers, as it had been in the previous year. Helped by falling oil prices, inflation in OECD countries reached a low point of about 2 per cent in late 1986 and early 1987. However, as economic activity expanded more rapidly, initially in the United States, Japan and the United Kingdom and subsequently in continental Europe, inflationary pressures emerged. By late 1988 inflation had edged up to about 4 per cent. While still relatively low by the standards of the 1970s and early 1980s, the rise was viewed as a worrying development compared with achievements in the mid 1980s. The post-1982 expansion of the world economy owed much of its durability to the success in curbing inflation and sustained expansion was seen as being heavily dependent on that success continuing.
1 OECD output and inflation, and commodity prices
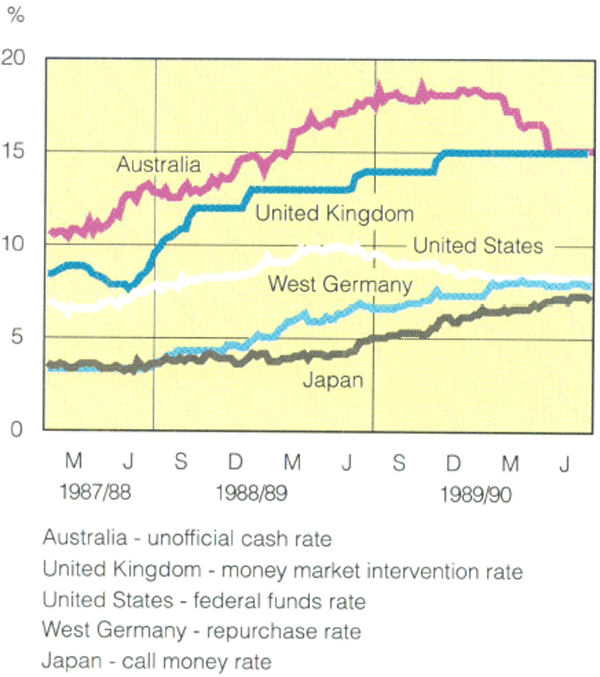
To this end, monetary policy was tightened around the world although concerns about the possible implications of the October 1987 sharemarket crash tended to hold back these moves for a time. The United States was first to move in early 1988 (Australia followed soon after, with policy being tightened from April 1988). By mid 1988, the United Kingdom and, to a lesser extent, West Germany had also started to tighten; Japan, from mid 1989, was the last of the major economies to act.
By the middle of 1989 the major economies were moving in different directions. Growth in the United States was showing signs of slowing; there was also evidence that US inflation was falling. The Federal Reserve eased monetary policy from around June 1989, in a series of steps. Meanwhile, in Japan and West Germany, increasing inflationary pressures were emerging in the wake of strong growth in activity and capacity constraints: real GNP in Japan and West Germany grew by about 5 per cent and 4 per cent respectively in 1989. West Germany continued to tighten monetary policy through 1989; by the end of the year, short-term interest rates had risen by about 4 percentage points from their low points in 1988. In Japan, by the end of 1989, short-term interest rates were almost 3 percentage points higher than in 1988. (In contrast, Australian interest rates rose by about 7 percentage points from their trough in early 1988 to their peak in the second half of 1989.)
Early in 1990, the inflationary threat to world activity appeared to have increased. In the United States, the earlier slowdown in inflation was followed by a sharp rise in the CPI in the first quarter of 1990 which threatened to push the inflation rate over 5 per cent. In Japan also, the falling yen and tight labour market pointed to rising inflation; this was countered by the tightening of monetary policy which caused a shake-out in the equities market and put downward pressure on property prices. In West Germany, expectations of inflationary pressure flowing from the reunification process added to existing (although still moderate) pressures. In the United Kingdom, the rate of inflation rose early in 1990 to about 8 per cent and increased further to nearly 10 per cent by the middle of the year.
2 Australian and overseas short term interest rates
With monetary policy tighter everywhere in early 1990 than it was two years earlier, it was not surprising that economic activity had slowed somewhat. By mid 1990, however, the prospects for extending the expansionary phase were looking brighter. In the United States, inflation returned to a rate well below that recorded in the March quarter, and activity, while remaining subdued, did not fall away sharply. Japan recovered from the financial uncertainty of the first quarter, and growth seems to be continuing at a rate not greatly below the high rates of the previous two years. Other Asian economies, like most OECD countries, have come off their recent very high growth rates but, as a group, continue to experience faster growth than either Europe or North America.
With both the United States and Japan slowing, Europe — and particularly a united Germany — is likely to provide much of the stimulus for world output growth in the period immediately ahead. European growth rates in 1988 and 1989 were already at their highest for the decade, partly reflecting the strong growth in investment as firms sought to position themselves for the 1992 common market. The opening-up of eastern Europe and, in particular, the reunification of Germany has given an additional boost to growth although, in economic terms, most of the countries of eastern and central Europe have small economies by western European standards and limited capacity to service debt.
Overall, the world economy has negotiated the 1980s reasonably well. The macroeconomic threat posed by trade imbalances among major countries seems to have abated although protectionist pressures still lurk beneath the surface. The US external deficit has declined, as has the Japanese surplus, while the West German surplus is expected to diminish as reunification proceeds. This has occurred against a background of greater stability in exchange rates in recent years compared with the first half of the decade. The threat posed by renewed inflation also appears to have lessened, at least for the time being. At the end of the decade Europe, for many years the slowest growing and most rigid economic region, seems set to sustain strong activity, investment and employment growth.
Australian Economy
As in a number of overseas economies, the main task for monetary policy in Australia over the past year was to slow an excessively buoyant level of domestic demand to help reduce pressures on inflation and the current account.
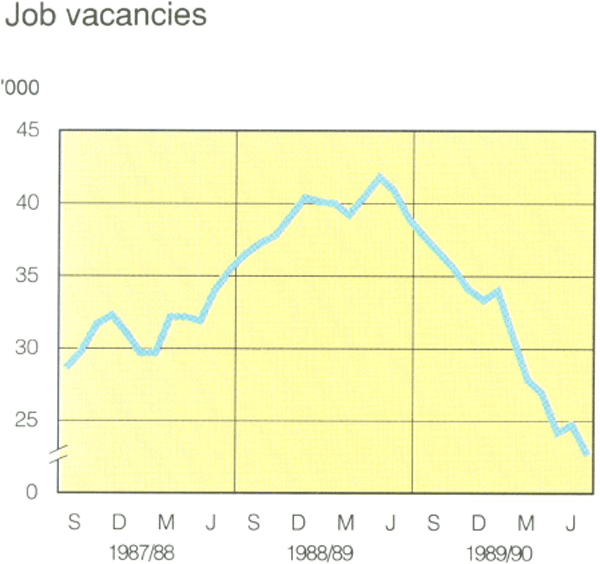
Monetary policy had been tightened in a series of steps between April 1988 and May 1989 but its impact remained unclear at the start of 1989/90: economic indicators, such as the main national accounts aggregates and employment, were still showing strong levels of activity. For example, the March 1989 quarter national accounts — received in June — continued to suggest an extremely strong domestic economy. Although housing finance had fallen sharply, other indicators which traditionally lead the business cycle, such as job vacancies, had shown only small falls.
While the underlying rate of inflation had not risen with the rise in activity, the prospects were not encouraging. In a mechanical sense, the combination of higher mortgage rates and higher house prices would boost the CPI, and possibly flow through to the community's inflationary expectations. In a more fundamental sense, there was always a risk that wages could break out in conditions of continuing high activity and tight labour markets. On the other hand, the asset price inflation that characterised much of the second half of the 1980s was waning. Share prices were well below their 1987 peak, although this was more a function of earlier overshooting than of tighter monetary policy. Monetary policy was, however, beginning to have an effect on residential and commercial property values, which had risen rapidly in the previous year.
The current account deficit continued to increase in the September quarter of 1989. Reflecting the strong growth of domestic demand over the previous year and declining competitiveness (a result of the relatively high inflation rate in Australia and a broadly stable exchange rate), imports grew strongly. This growth in imports more than offset the effects of steady growth in export volumes and generally favourable export prices.
With domestic demand still seemingly buoyant and inflationary pressures apparent, a case might have been made for a further tightening of monetary policy in the early months of 1989/90. Instead, it was decided to hold the line in the belief that the economy was beginning to slow. This belief reflected the existing degree of tightness and an assessment of the lags before monetary tightenings are translated into real effects. There was some tentative evidence also that credit growth was slowing in response to the earlier monetary policy action.
As the year progressed, evidence began to accumulate that the economy had slowed significantly. The September quarter was the first occasion for some time in which the growth of domestic demand was unambiguously lower than the growth of production. By the December quarter, domestic demand was estimated to have fallen. Information on these developments was, as usual, received with a lag, but by December it was becoming clear that the period of excessive domestic demand was passing, and various surveys showed that business expectations were becoming less confident. All this suggested that the very high real interest rates required to pull back the earlier excessive demand were no longer necessary or appropriate in the changing conditions.
Monetary policy was eased in January, February and April of 1990. Each move was communicated clearly at the time in media statements, with subsequent steps tied to assessments of trends in inflation, domestic demand and imports. Over the remainder of 1989/90 monetary policy was held steady.
The slowing in activity during the year exhibited two characteristics typical of an economic contraction. First, investment showed a sharper downturn than consumption, although the latter has been relatively subdued by past standards and the former relatively very strong. Continued investment in the tradeable goods sector is important for Australia's medium-term prospects but monetary policy is not suited to selectively encouraging such investment while discouraging consumption and certain other types of spending (such as non-residential construction). The second effect was more favourable, although also typical of a cyclical downturn: import volumes slowed noticeably, while export volumes continued to grow at a reasonable rate so that net exports made a positive contribution to the growth in GDP.
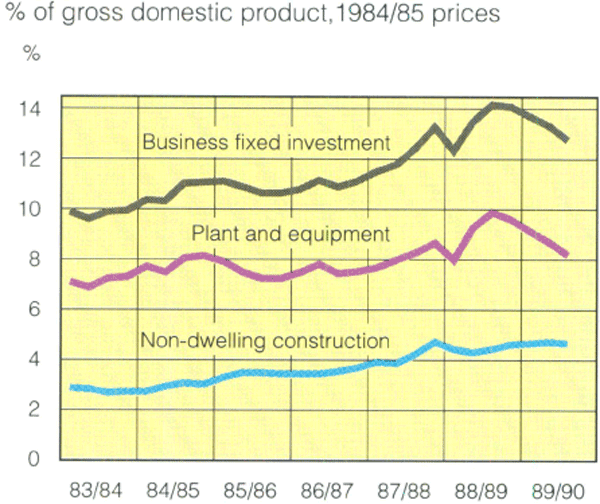
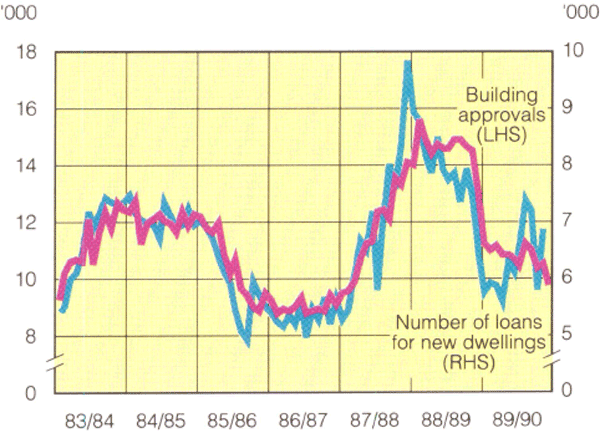
The fall in private investment, although pronounced, was from a very high level as a percentage of GDP. As a result, private investment in 1989/90 was still running at a rate about 15 per cent higher in real terms than it had been two years earlier. The falls in plant and equipment were sharper than in buildings and construction; the high degree of work-in-progress meant that investment in the latter remained buoyant in the short term. Its medium-term prospects, however, are for a sharp decline, given an oversupply of commercial building, particularly in central business districts and tourist areas. Investment in dwellings fell, although to a level somewhat higher than in the last housing downturn in 1986/87, in keeping with the longer-term upward trend in household numbers.
3 Business fixed investment
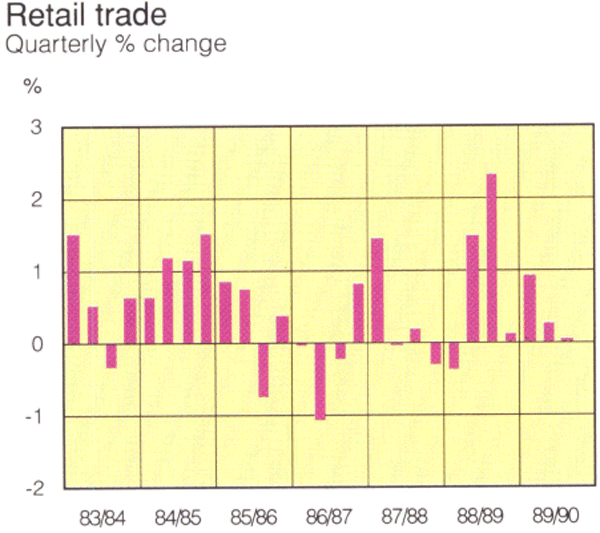
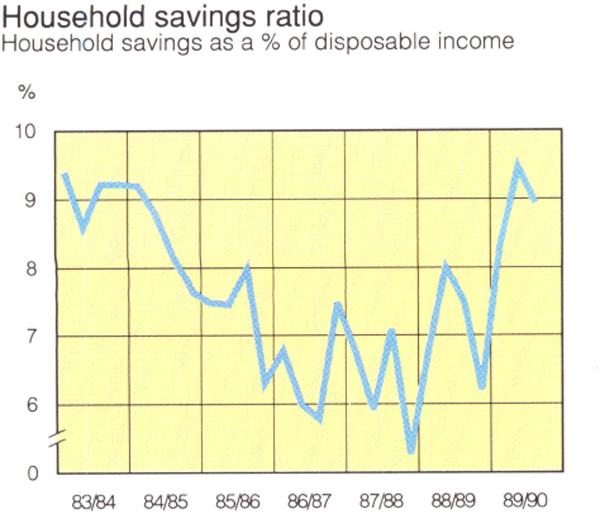
Despite the strong employment growth in the first half of the year, and the boost to disposable incomes from the 1 July 1989 tax cut, private consumption grew by a modest 2¼ per cent during the year. This represented restrained growth by historical standards, and contributed to a rise in the household saving rate. Within the components of consumption, the strongest growth was in motor vehicles, with consumption of services also holding up; sales of most goods were weak throughout the year.
4 Housing finance and activity
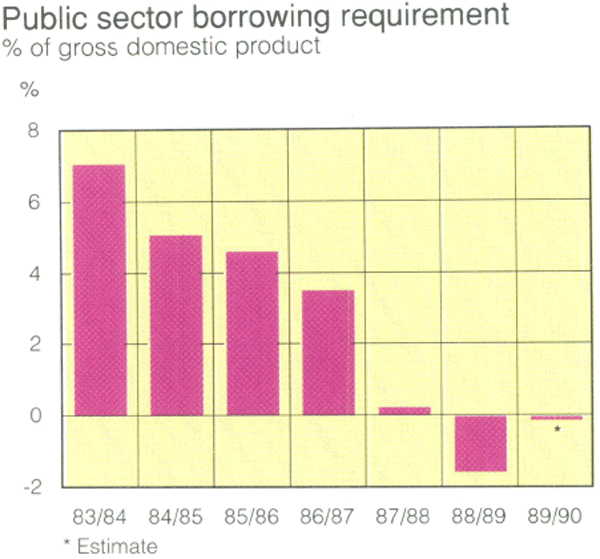
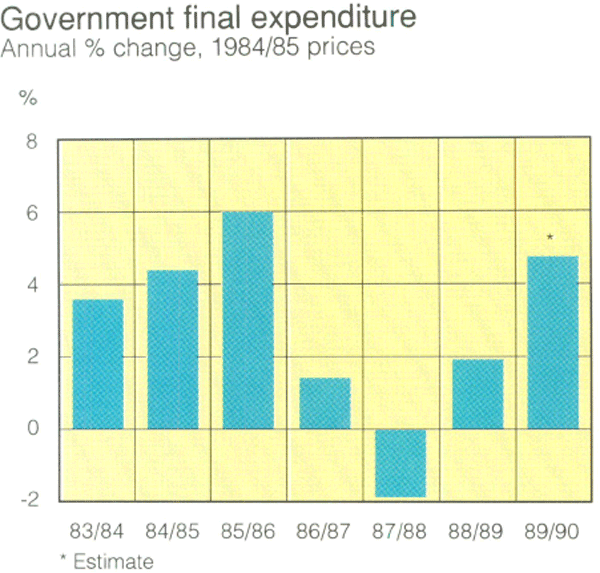
The public sector as a whole is estimated to have been close to balance in 1989/90, having recorded a surplus of about 1½ per cent of GDP in the previous year. This slippage mainly reflected higher borrowings by the Wool Corporation, together with a larger-than-expected deficit in respect of the State and local government sector. In 1989/90, public demand grew by about 4¾ per cent in real terms, roughly double the growth rate of demand by the private sector. Within the public sector, both investment and consumption spending grew strongly.
5 Consumption indicators
6 Public sector borrowing and spending
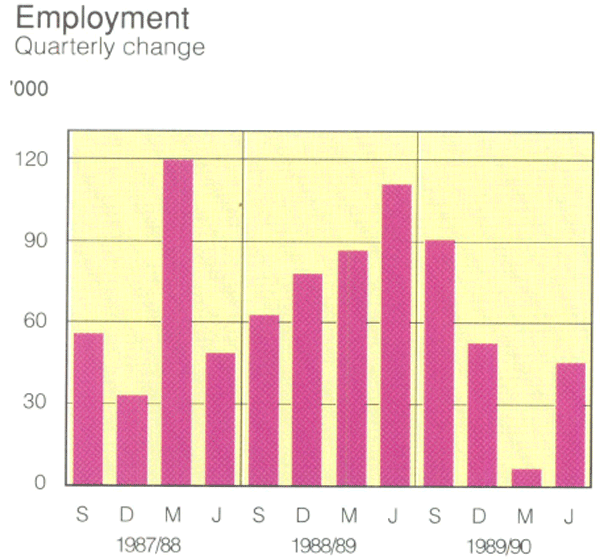
Employment growth remained strong in the first half of the year and the labour market was tight. The unemployment rate fell to 6 per cent, the lowest rate since 1981. Employment growth did not slow appreciably until the March quarter of 1990, about one quarter after the drop in output growth. In the first half of 1990 it grew at an annual rate of about 1 per cent, a little below the rate of growth of the labour force. As a result, the unemployment rate edged up. This slowdown in the growth of employment is an unavoidable consequence of the process of reining back domestic demand. Thanks to sustained restraint in wage growth, the economic slowdown has occurred, at least to this stage, without a major shake-out of employment.
7 Employment and job vacancies
The downturn so far has been uneven. Some sectors which sell to the world market, such as the resource sector, have continued to work at or near full capacity and good profits have been maintained. Conditions in the rural sector, apart from the problem of oversupply of wool, were also generally good until late in the year when returns from wheat and some other commodities came under pressure. Businesses that were heavily geared, particularly those that were exposed to property, have come under heavy pressure. Slowing cash flow and falling asset prices have brought home the burden of servicing debt at what are still high interest rates. As businesses seek to cope with this situation, they have cut back on investment spending, become more reluctant to hire new staff, and reduced orders in an attempt to bring down stock levels. Financial intermediaries and service industries, such as property development, real estate and stockbroking, have also scaled back their activities in response to falling asset values, increasing bad debts and subdued turnover in financial markets.
Small businesses, traditionally heavy users of debt, have been affected by high interest rates and slowing demand. Overall, however, it is difficult to establish a firm connection between business failure and the economic cycle. There is no clear evidence from the available figures of an increase in bankruptcies, for instance, but there were increases in liquidations, in the number of receivers appointed and in stock exchange delistings. The available information does not indicate that small businesses have suffered disproportionately more than large businesses.
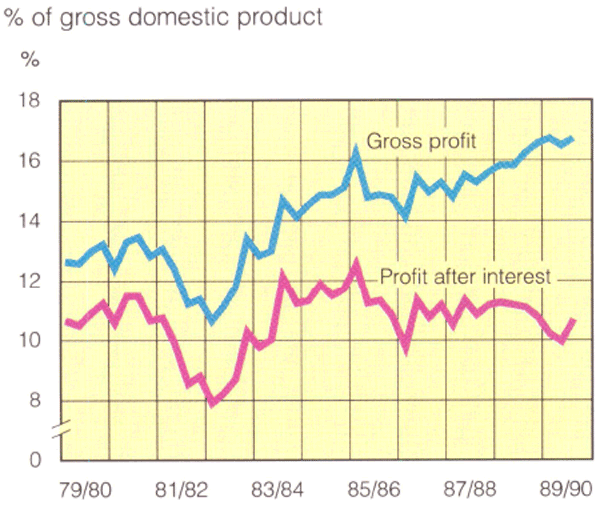
In 1989/90, gross corporate profits, before payment of interest, remained at the historically high ratio to GDP reached in the previous two years. However, an increasing proportion of gross profits was absorbed by interest payments. By the December quarter 1989, net interest payments by companies amounted to nearly 40 per cent of gross profits. As a result, profits after interest fell to under 10 per cent of GDP, a similar level to that reached in the 1986 slowdown, but well above that in 1982/83. Within this aggregate, profit performance varied markedly among industries; mining profits were exceptionally strong, rising by 89 per cent in the year to the March quarter 1990, while aggregate profits for all other industries fell by 17 per cent. As the year progressed, interest payments would have declined following the reductions in interest rates in early 1990 but, for many firms, this effect would have been more than offset by the decline in cash flows as the economy slowed.
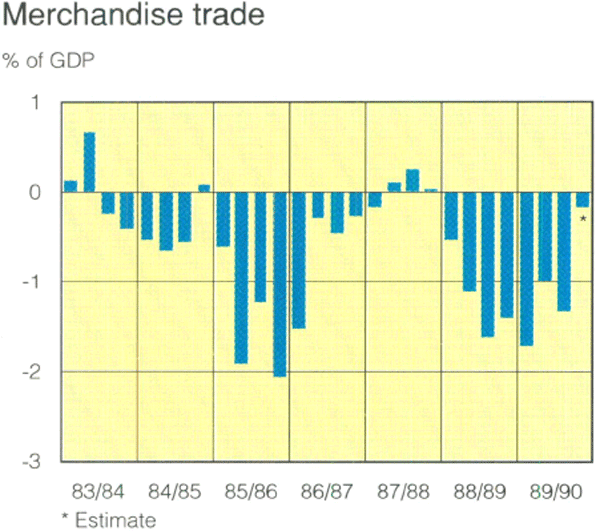
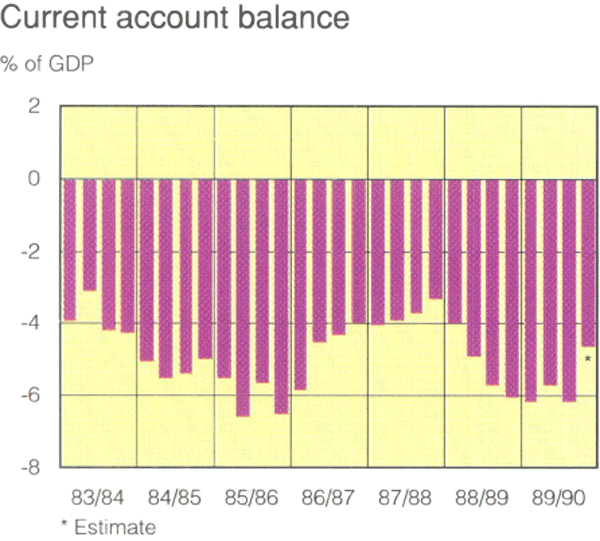
The balance of payments outcome in 1989/90 was disappointing. The current account deficit of $21¼ billion was larger than forecast at the beginning of the year and, at 5¾ per cent of GDP, remained excessively high. Progress in reducing the current account deficit is proving stubbornly slow; since the early 1980s, it has varied between 4 and 6 per cent of GDP. It was over 6 per cent in both the September and March quarters though it fell to 4¾ per cent in the recent June quarter.
8 Company profits
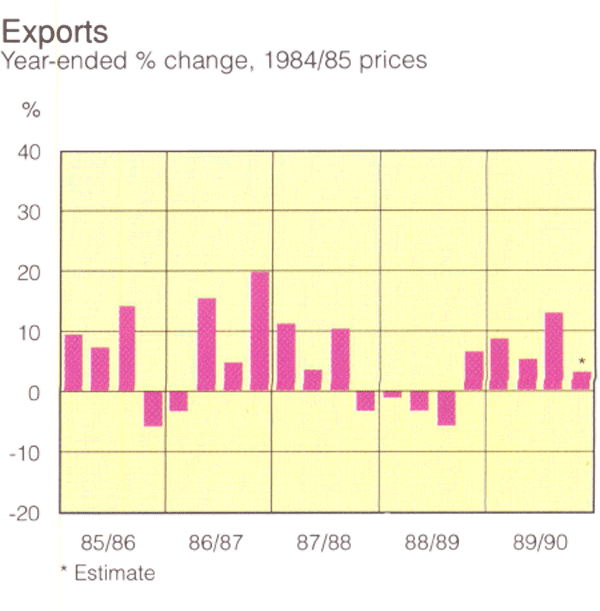
9 Volume of imports and exports
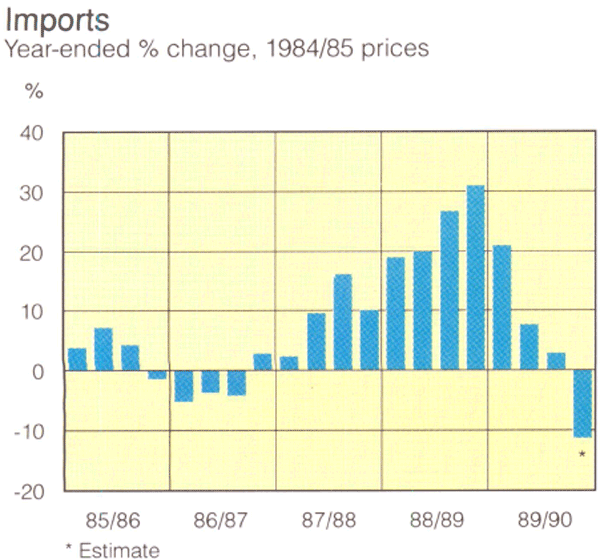
The fall in domestic demand led to a fall in the volume of imports in the course of 1989/90, in sharp contrast to the growth of about 30 per cent that had occurred over 1988/89. The fall in import volume was widespread and was concentrated heavily in the June quarter of 1990. The turnaround through the year mainly reflects the usual cyclical pattern in which variations in imports are much more pronounced than variations in domestic demand. It occurred despite an adverse movement in competitiveness, attributable mainly to prices and costs in Australia rising faster than overseas rather than the rise in the trade-weighted index of the Australian dollar.
The volume of exports grew by around 6 per cent, with the increase coming from non-rural exports, particularly liquefied natural gas, coal and gold. Rural exports fell with declines in most categories; more than half of the wool clip was bought and stockpiled by the Australian Wool Corporation. Exports of manufactures continued to rise.
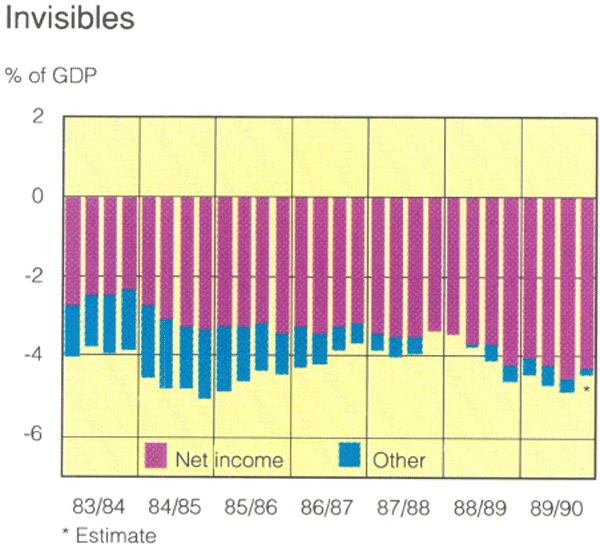
Despite the faster growth in export volumes relative to import volumes, the balance of trade did not improve. This largely reflected a fall in the terms of trade. The widening of the current account deficit was attributable mainly to the increase in net income payable abroad, which amounted to nearly $16 billion or 4¼ per cent of GDP. The services deficit was higher than in the previous year and partly reflected a reduction in tourist receipts following the pilots' dispute; it remained, however, much less sizable than the level recorded in the first half of the decade.
10 Balance of payments
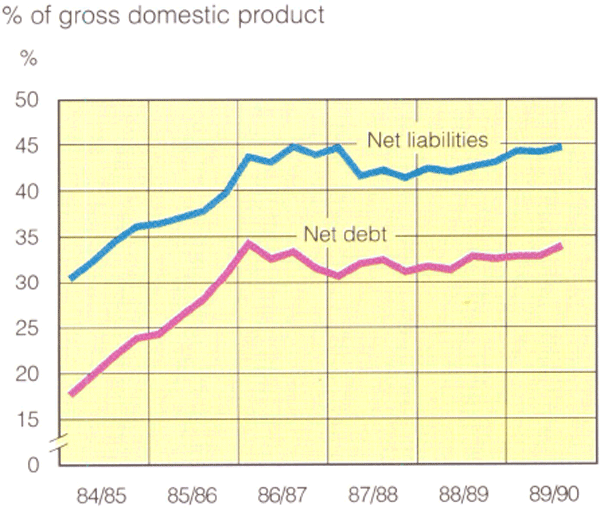
With a current account deficit of $21¼ billion and Australian equity investment abroad of around $6 billion, Australia again made substantial use of external financing. As in other recent years, the capital inflow was mainly in the form of debt rather than equity and the ratio of net external debt to GDP rose from 32.6 to 34.1 per cent. The broader measure of Australian external liabilities, the “net international investment position” which includes net equity as well as net borrowings, rose by a similar amount.
There have been some interesting developments in relation to net equity flows. Although there have been some notable and longstanding investments in other countries, Australia traditionally recorded net equity inflows.
This was attributable in part to the fact that prior to the end of 1983 outward investment was limited by official controls. Since the abolition of exchange controls Australian equity investment abroad has surged; between 1982/83 and 1987/88 net outflows were recorded in each year. Over the past two years the growth of Australian equity investment abroad has fallen from its peak level and Australia has been a small net importer of equity capital.
11 Net foreign liabilities
Australian commodity prices fell over 1989/90. In the year to June, prices were down by about 9 per cent measured in SDR terms, much the same as the fall in world commodity prices over the same period. However, Australian and world prices diverged through the year. Until late 1989, Australian commodity prices were resilient in the face of a more general decline in prices worldwide, the main influences being the strengthening in crude oil, gold and beef prices. Australian prices fell more rapidly than world prices over the second half of the year, reflecting weaker crude oil and gold prices and a sharp fall, especially late in the year, in prices of some rural commodities. Falls in wool and wheat prices continued into July though oil and gold prices picked up.
Prices and Wages
The rates of increase in prices and wages remained disappointingly high in 1989/90 but inflation did not rise. This had appeared a distinct possibility in mid 1989, given the rapid growth of domestic demand that had occurred in the previous 18 months. Over that period, domestic demand ran well ahead of the economy's capacity to produce, leading to a build-up of inflationary pressures and a rapid increase in imports.
After the initial tightening of monetary policy to counter these inflationary pressures, the exchange rate rose and this may have increased imports somewhat. However, the increase in imports was an important safety-valve during this time, increasing supply and limiting domestic inflationary pressures.
Even so, domestic producers were still in a strong position either to raise prices or refrain from passing through cost reductions associated with the appreciating exchange rate. With employment growing at this time at an annual rate of about 4 per cent, the labour market tightened appreciably and in some sectors, such as building and construction, competition for labour was intense.
The situation changed during 1989/90 and by mid 1990 the outlook for inflation hau improved. In part, this was because the Accord had held and the growth of earnings remained in the 6½ to 7 per cent range. This was a considerable achievement. Seen in the broader context it was no doubt assisted by the fact that monetary policy was at last slowing the economy and relieving pressure on goods, labour and asset markets. If the rapid growth of domestic demand that characterised 1988/89 had continued throughout 1989/90, it would have been extremely difficult for any set of institutions to have prevented an increase in wage and price inflation.
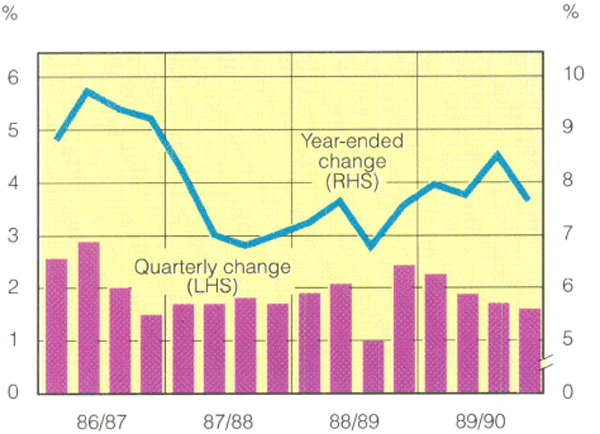
There is no unique measure of inflation but that most commonly used is the Consumer Price Index (CPI). This has been pushed up by mortgage interest costs and by temporary increases in fruit and vegetable prices. These factors contributed to increases of around 2½ per cent in each of the June and September quarters of 1989. As the year progressed, however, the quarterly increases declined to 1.9 per cent in December, 1.7 per cent in March, and 1.6 per cent in June. Even so, the growth over the year of 7.7 per cent is considered to overstate, to some extent, the underlying inflation rate because it is still influenced by earlier rises in mortgage interest costs.
Other quarterly and monthly price indices help to provide a broader perspective on inflation. The implicit deflator for private consumption of goods and services from the national accounts is estimated to show inflation rising at 6½ per cent over the year, while the equivalent figure for retail trade (mainly goods) shows 5½ per cent. The monthly measures of prices of materials used in the building industry show increases in 1989/90 of around 7 per cent, well down on the double-digit rates of increase in late 1988. The prices of materials used in, and articles produced by, manufacturing industry have risen at rates well below 7 per cent. The measure of inflation that shows the lowest increase in 1989/90 is the GDP deflator (around 5½ per cent), although this probably understates it because of the influence of declining export prices. In broad terms, the rate of inflation in Australia in 1989/90 was about 7 per cent or a little lower.
12 Consumer price index
13 Inflation
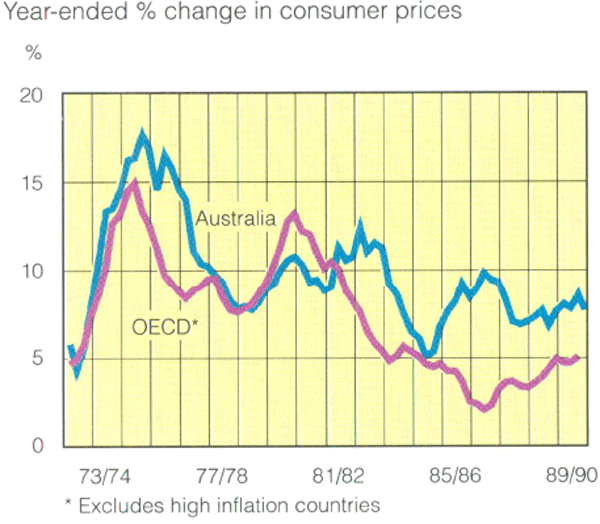
Overall, the past year can be said to represent some progress, particularly in the context of the last two decades. Nevertheless it is still well above the average of 5 per cent for OECD countries. In fact, in no year during the 1980s was Australian inflation lower than the average for OECD countries; the last time this occurred was in 1979/80, when the rise in oil and gas prices associated with OPEC actions pushed up import prices in major OECD countries more sharply than in Australia.
14 Asset prices
| June 1989 | March 1990 | |
|---|---|---|
| Consumption prices | ||
| CPI | 7.7 | 7.7* |
| Consumption deflator | 7.0 | 6.9 |
| Retail trade deflator | 6.2 | 5.5 |
| Building industry | ||
| House building | 9.7 | 6.7 |
| Other | 8.0 | 7.8 |
| Manufacturing industry | ||
| Materials used | 5.2 | 5.7 |
| Articles produced | 7.4 | 6.6 |
| GDP deflator | 8.4 | 5.1 |
| Average weekly earnings | 7.3 | 6.5 |
| * To June quarter 1990 | ||
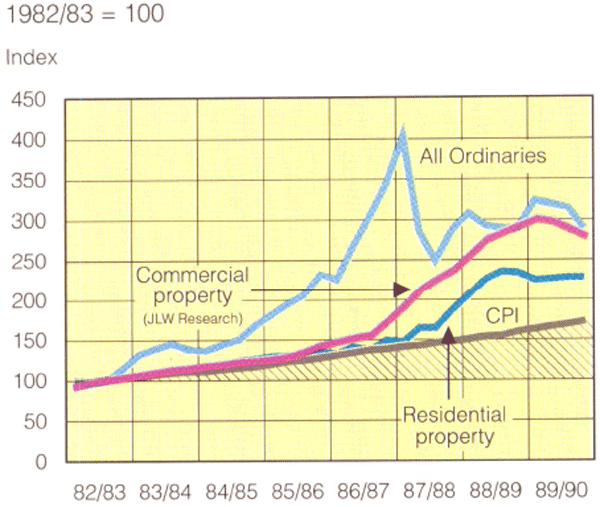
The tightening of monetary policy had a more pronounced effect on asset prices than on the prices of goods and services. Whereas growth in prices of the latter tended to decelerate over the course of 1989/90, there were absolute falls in many asset prices. This is not surprising given that asset markets have a larger speculative element built into them; they had risen more sharply in earlier years; and they are not underpinned by wage costs in the way prices of goods and services are. There is also a much more direct relationship between monetary policy and asset prices than there is with goods and services prices.
15 Average weekly earnings
The holding of an asset for capital gain necessarily implies a comparison with the alternative uses of funds, represented by the rate of interest. The surprise is not so much that asset prices fell, but that they took so long to fall. To buy an asset yielding 5 per cent, with funds costing 20 per cent or more, requires a high degree of confidence, yet this was common during much of the 1980s. The falls in asset prices over the past 18 months have changed this sentiment, with beneficial effects for both inflationary expectations and private savings.
Share prices ended the year around the same level they began. They remain, however, well below their 1987 peak. Real estate prices fell sharply during the year, with the falls spread across commercial, retail and industrial property in most States. The fall in property prices was made more severe by widespread overbuilding, and by the need to realise assets as a result of the failure of some highly-geared “entrepreneurial” companies. House prices, according to the most widely-used index, have fallen from their peaks in mid 1989, with the falls concentrated at the top end of the market; other indices show a flat picture in nominal terms, but falls in real terms. Prices of other assets, which had their prices driven up by debt-backed speculative activity, also experienced very large falls.
The main influence on wages in 1989/90, apart from the “pipeline” inherited from earlier years, was the decision in the August 1989 National Wage Case. This awarded two increases of 3 per cent, to take effect from the December quarter 1989 and the June quarter 1990. The latter increase will impact largely in 1990/91. Although measured wage drift varies greatly from quarter to quarter, in 1989/90 as a whole it was in line with average experience, with a tendency for it to be lower in the second half of the year.
16 Monetary aggregates
Monetary Conditions
With monetary policy tightening from April 1988, and with the economy starting to slow in the second half of 1989, the general slowing of all monetary and financial aggregates during 1989/90 was not surprising. However, the timing varied from aggregate to aggregate, in part because of the different nature of the claims that make up each aggregate, and in part because of the residual effects of earlier changes to regulations. The Bank has not used a formal monetary projection since early 1985 but the monetary and financial aggregates remain a significant part of the data base for assessing the state of the economy.
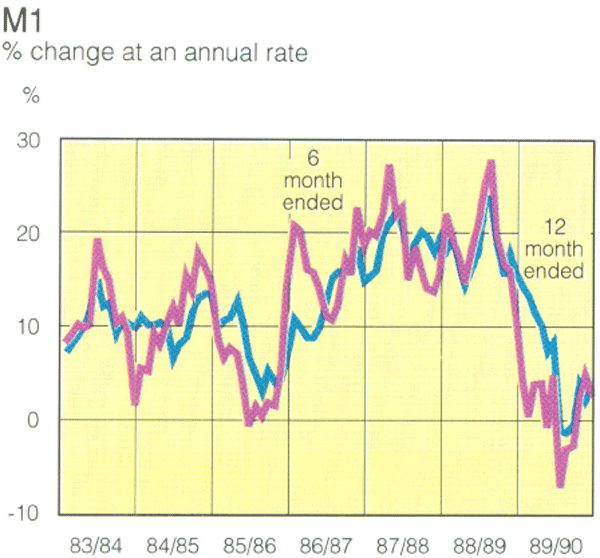
Among the conventional monetary aggregates, it is well known that narrow aggregates, such as M1, tend to have a close inverse relationship with interest rates, and therefore could generally be expected to respond quickly to a tightening of policy. In the present cycle, M1 continued growing quickly throughout 1988, but turned down sharply in early 1989. By early 1990, its growth, measured on a 12-month-ended basis, was fluctuating between zero and 5 per cent.
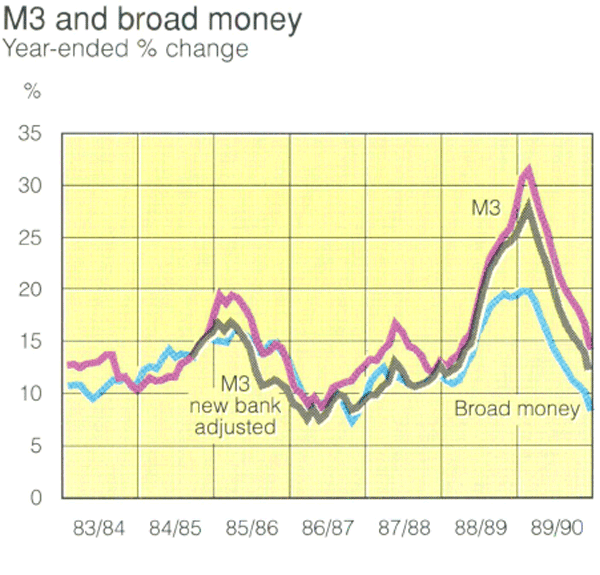
The two most widely quoted monetary aggregates in Australia — M3 and broad money — were still distorted in 1989/90 by the change from Statutory Reserve Deposits to Non-callable Deposits effective from September 1988. As was explained at the time, this regulatory change was bound to lead to a substitution of deposits for non-deposit liabilities within banks' balance sheets, and therefore to an “artificial” increase in measured monetary growth. In the event, the growth of M3 on a 12-months-ended basis rose to a peak of over 30 per cent in August 1989. At the same time, growth in broad money, which was also affected by this distortion but to a lesser degree than M3, rose to a peak of 20 per cent measured on the same basis. As the effects of this distortion have gradually dropped out of the measurement, the growth rates have fallen to 14.4 per cent and 8.6 per cent respectively in the 12 months to June. The figure for M3 is still overstated because of the addition of a building society that has converted to a bank; excluding this effect, the growth of M3 was 12.5 per cent.
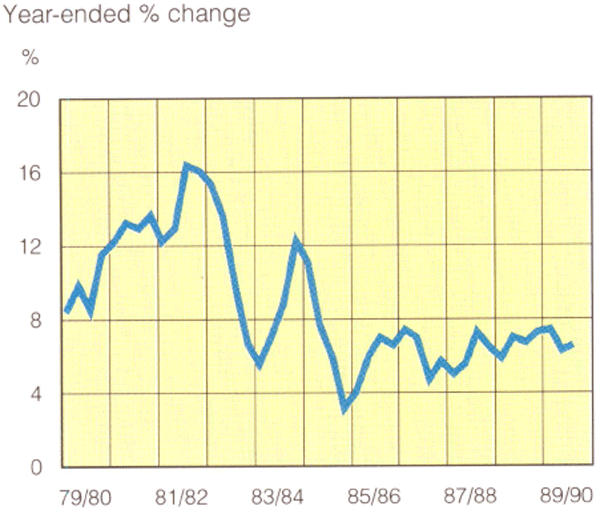
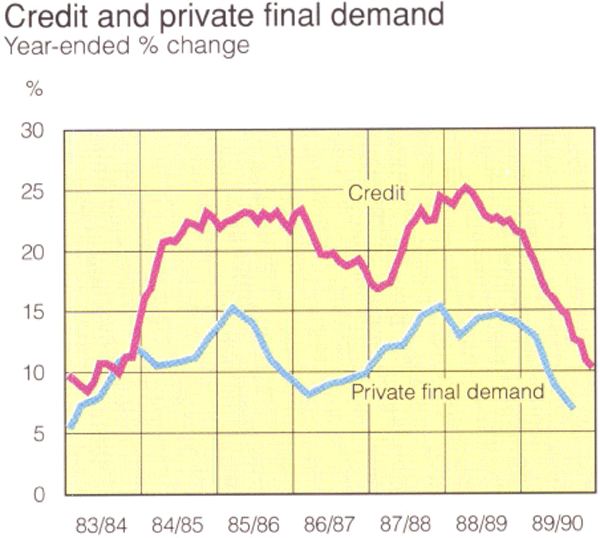
The financial aggregate which has been least subject to distortions over this period is credit provided by all financial intermediaries. Over the years credit and the value of private final demand tend to follow similar patterns; however, the growth in credit relative to this aggregate in the period from late 1983 to 1988 was about 6 per cent per annum higher on average than the previous relationship would have suggested. Over the past year, as asset prices have declined, credit appears to have come more into line with its old relationship to expenditure growth. After having grown at over 20 per cent per annum from 1983 to 1988, the rate slowed to 10 per cent in 1989/90.
Credit generally lags the cycle in real and nominal economic activity. This was certainly the case in 1982/83 and 1986/87. In the current downturn, however, this relationship seems to have been obscured by the exceptional rate of growth in credit provided to businesses in the first quarter of 1988, following the October 1987 stock exchange crash and the associated difficulty of raising equity. Abstracting from this effect by looking at the three-monthly growth rates of credit, it is apparent that credit continued to grow at about a 20 per cent annual rate through 1988 and into the first half of 1989. The sharp deceleration in credit growth that has brought it back to more normal levels can be dated from about August 1989.
17 Credit
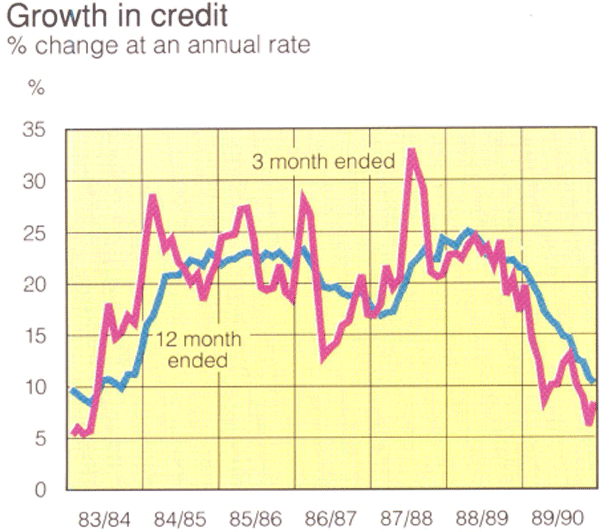
Over the most recent three months, credit has grown at an annual rate of about 8½ per cent. This is low by standards of the past few years, but is not greatly out of line with the growth of nominal demand in the previous quarter or two. Seen in this light, the behaviour of credit in the present cycle is not out of line with past standards. In addition, the periods where credit growth was at its highest were periods of rapidly rising asset prices. In effect, the growth of credit was supporting increases in asset prices as well as the normal turnover in the economy. With the tight financial conditions prevailing in the past year or so, there has been a downward shift in asset prices and credit growth.
“Imperfectly anticipated inflation — the only kind we have — generates massive redistribution of wealth between some borrowers and some lenders, some buyers and some sellers … the gainers attribute their gains to their own perspicacity, energy and virtue; the losers attribute their losses to inflation.”
R.M. Solow
The Intelligent Citizen's Guide to Inflation, 1975