Payments System Board Annual Report – 2018 Trends in Payments, Clearing and Settlement Systems
The Payments System Board monitors trends in retail payments, and activity and risk exposures across financial market infrastructure (high-value payment systems, securities settlement systems and central counterparties). This is consistent with the Board's responsibilities to promote efficiency and competition, and control risk, in the Australian payments system.
Retail Payments
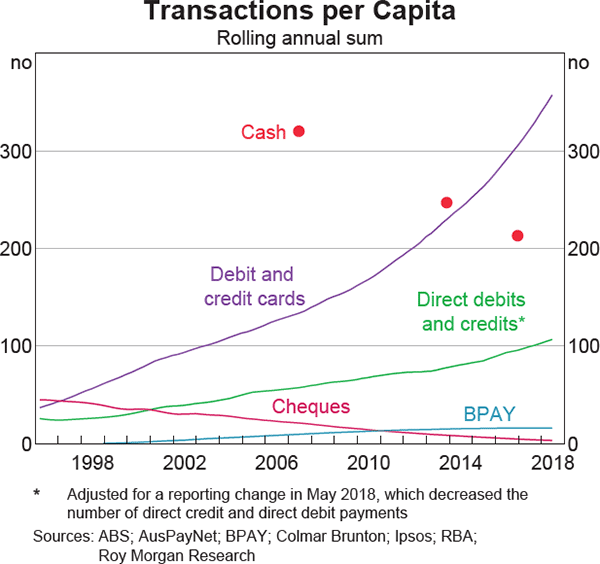
The past few decades have seen a gradual shift in Australian consumers' use of electronic payment methods, such as cards and direct debits, to make their payments (Graph 1). This shift appears to have accelerated in recent years. On average, Australians made around 480 electronic transactions per person in 2017/18, compared with 215 transactions per person a decade earlier. By contrast, the use of paper-based payment methods such as cash and cheques has declined. On average, Australians made about 210 cash payments per person in 2016, the latest year for which we have data, down from 320 transactions in 2007. Consistent with these broad trends, the Reserve Bank's Consumer Payments Survey (CPS), which was last undertaken in 2016, showed that cards had overtaken cash as the most frequently used payment method by Australian consumers.
Cash payments
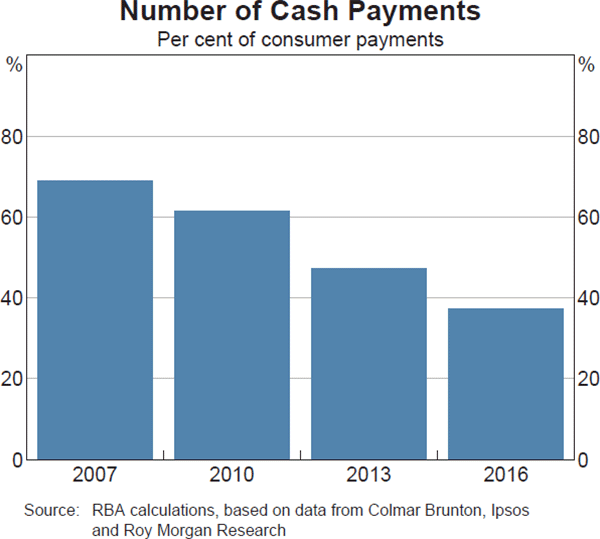
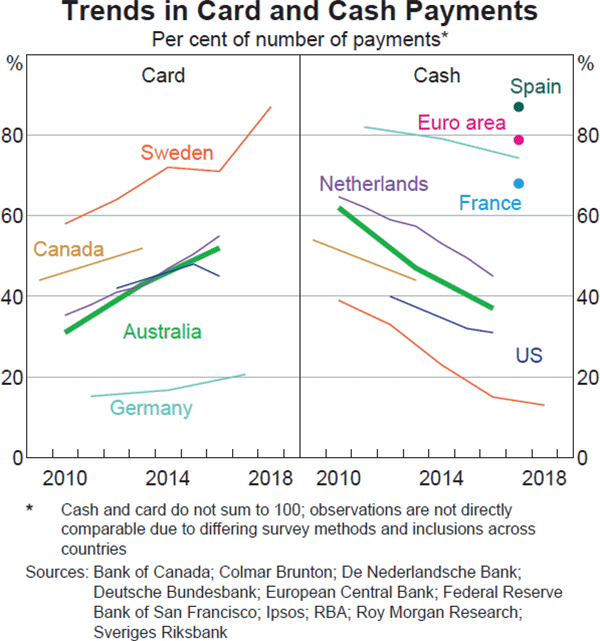
According to the 2016 CPS, the share of consumer payments made in cash fell to 37 per cent of the number of payments in 2016, from around 70 per cent in the 2007 survey (Graph 2).[5] The decline in the relative use of cash over the past decade or so largely reflects consumers preferring to use their debit and credit cards for in-person payments, with an increase in the share of online transactions also playing a role. In recent years, there has been a significant reduction in the share of lower-value payments made using cash, facilitated by the adoption of contactless ‘tap-and-go’ functionality by consumers and merchants at the point of sale. Nonetheless, cash still accounted for over 60 per cent of payments under $10 in 2016, and cash is still used relatively intensively at some types of merchants, such as food retailers. Moreover, cash continues to be used relatively often by some segments of the community, including older Australians and lower-income households. A shift away from cash to electronic payment methods has also been evident in many other countries, though there is still a fairly wide variation in how intensively cash is used across comparable countries (Box A).
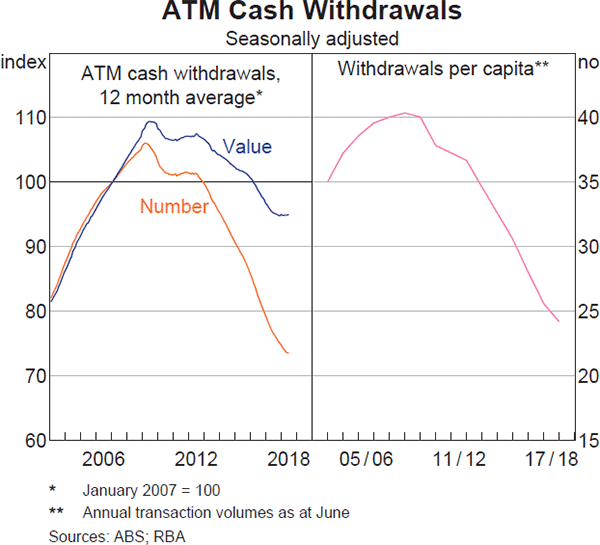
The declining use of cash for transactions has been reflected in falls in the use of ATMs for cash withdrawals (Graph 3, left panel). The number and value of ATM withdrawals declined by 4 per cent and 0.3 per cent, respectively, in 2017/18, slower than the average rates of decline of the past few years. In 2017/18, Australians made an average of around 24 ATM withdrawals per person, down from 40 a decade ago (Graph 3, right panel). The significant fall in ATM use over the past decade has increased the incentives for ATM deployers to rationalise their fleets. After rising for much of the past two decades, the number of ATMs in Australia has begun to decline, falling by about 3½ per cent over the year to June. Per-capita ATM coverage is still high in Australia in comparison to many other developed economies.
Despite the decline in the transactional use of cash, demand for cash more generally remains strong.[6] The value of banknotes in circulation increased by 2.6 per cent over the year to June 2018, to about $75 billion (or around 4 per cent of GDP). This increased demand partly reflects the use of cash as a store of value, often for precautionary purposes. Around 70 per cent of participants in the 2016 CPS reported holding some cash outside of their wallet. The use of cash as a store of value is also consistent with the strong growth in high-denomination banknotes in recent years (although it has moderated somewhat in 2018).[7] There is also evidence that overseas demand has contributed to growth in high-denomination banknotes. Over time, the increase in notes in circulation, together with declining use of cash for payments, has translated into a fall in the share of outstanding banknotes that are used for transaction purposes (rather than as a store-of-value).
Box A
International Trends in Consumer Payments
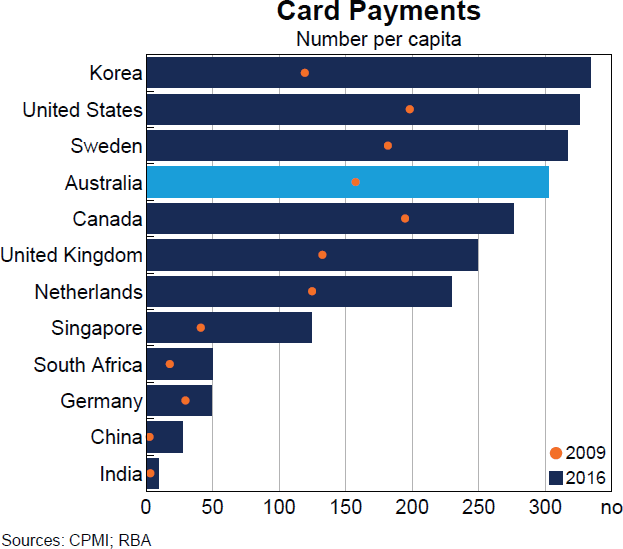
Consumers globally are increasingly using electronic methods, such as cards and mobile apps, instead of cash and cheques to make their payments. For example, data across a range of countries indicate that consumers' use of payment cards has increased in recent years (Graph A1).1 These trends reflect advances in technology, changing consumer preferences, and, to some extent, government policies aimed at facilitating increased use of electronic payment methods.
In Australia, the Reserve Bank's triennial Consumer Payments Survey (CPS) shows that the share of consumer payments made in cash has been falling steadily for a number of years and, in the 2016 survey, debit and credit cards overtook cash as the most commonly used consumer payment method (Graph A2). A number of advanced countries also conduct surveys of consumer payment patterns. Although they are not fully comparable due to survey design differences, these surveys show that Australian consumers are not alone in shifting away from cash for transaction purposes, although there are some notable differences across countries.
Swedish consumers, for example, now use cash relatively infrequently: less than 15 per cent of respondents to a central bank survey in 2018 reported that they had used cash for their most recent purchase, compared to around 40 per cent in 2010.2 A pronounced shift away from cash for consumer payments has also occurred in Norway.3 While cards are the most commonly used means of payment in Sweden, use of the mobile payment service Swish – which allows real-time consumer payments – has increased rapidly in recent years. The Swedish central bank has, however, noted concerns that the rapid decline in the use and acceptance of cash could lead to problems for segments of the population that still rely heavily on cash. It has also noted concerns about the resilience and possible monopolisation of private electronic payment systems. Reflecting these concerns, it has been analysing the case for the central bank to issue an electronic form of the krona and considering requirements on banks to continue to provide cash services.4
In contrast, cash remains the dominant means of payment in some other European countries (although the share of cash payments has also fallen). According to a recent European Central Bank survey, cash still accounted for around 80 per cent of payments at the point of sale in the euro area in 2016.5 In particular, cash was used relatively intensively in southern euro area countries – including Greece, Italy and Spain – and in Germany among others. Cash was used particularly intensively for low-value payments, and many consumers in these countries reportedly use cash because of speed and the ability to aid budgeting. On average, euro area consumers used contactless card payments for around 2 per cent of point-of-sale transactions, whereas Australian consumers made around one-third of their in-person payments with contactless cards in the 2016 CPS.6
Payment trends in a number of other countries have been broadly similar to those in Australia.
For example, while consumers in Canada, the United States and the Netherlands use cash less frequently than in the past, according to the most recent surveys it remains an important part of the payments mix. As in Australia, cards are now the most common way of making consumer payments in these countries. Research by the Federal Reserve Bank of Boston suggests that mobile (phone) payments that connect to card networks are also gaining popularity in the United States, with a third of consumers making such payments in 2016.7 However, cheques remain a significant payment method in the United States, where the decline in their use has not been as pronounced as it has been in Australia and some other advanced economies. In the Netherlands, for example, the processing of cheques was terminated in 2001.
While consumer survey data are typically unavailable for other regions and for less-developed economies, there is evidence that a shift to electronic payment methods is occurring globally, albeit with significant variation across countries. In some cases, government policies are aiming to promote electronic payments and reduce the economy's reliance on cash. For example, in 2015, the Thai government introduced its National e-Payment initiative, a series of projects aimed at improving the efficiency of financial infrastructure by reducing the need for cash.
In some developing economies, a notable development has been a move away from cash to the use of mobile payment methods. In China, for example, the use of mobile payment apps such as AliPay and WeChat Pay has grown rapidly in recent years, particularly for low-value transactions. These non-bank systems use quick response (QR) code technology to facilitate transactions between users' accounts. This technology has provided a cost-effective way for merchants to accept electronic payments in an environment where many of them were previously unable to do so, largely because of a lack of access to card terminals. Mobile payment technology has also played a significant role in facilitating financial inclusion in some developing countries with large unbanked segments of the population; a notable example is Kenya, where the M-Pesa system is widely used to transfer value and make payments using text messages on mobile phones (without the need to access card networks).
Footnotes
[1] CPMI (2017), ‘Statistics on payment, clearing and settlement systems in the CPMI countries – Figures for 2016’, December. Available at <https://www.bis.org/cpmi/publ/d172.pdf>.
[2] Sveriges Riksbank (2018), ‘Payment Patterns in Sweden 2018’, May. Available at <https://www.riksbank.se/globalassets/media/statistik/betalningsstatistik/2018/payments-patterns-in-sweden-2018.pdf>.
[3] Norges Bank (2018), ‘Retail payment services 2017’, Norges Bank Papers 2. Available at <https://www.norges-bank.no/en/Published/Publications/Norges-Bank-Papers/2018/norges-bank-memo-22018/>.
[4] See, for example, Ingves S (2018), ‘Money and payments – where are we heading?’, Stockholm School of Economics, Stockholm, 4 June. Available at <https://www.bis.org/review/r180725e.pdf>.
[5] Esselink H and L Hernández (2017), ‘The use of cash by households in the euro area’, European Central Bank Occasional Paper Series 201.
[6] See Doyle M-A, C Fisher, E Tellez and A Yadav (2017), ‘How Australians Pay: New Survey Evidence’, RBA Bulletin, March, pp 59–66.
[7] Greene C and S Schuh (2017), ‘The 2016 Diary of Consumer Payment Choice’, Federal Reserve Bank of Boston Research Data Reports 17-7.
Card payments
Debit and credit cards combined are the most frequently used payment method in Australia. In 2017/18, domestic personal and business cardholders made around 8.7 billion card payments worth $591 billion, an increase of around 13 per cent and 7 per cent respectively from the previous year (Table 2). Reflecting the increased use of cards for low-value payments, the average value of card payments continued to fall and is now just below $70 (Graph 4, left panel). This is consistent with both changing consumer preferences and merchants being more willing to accept cards for low-value transactions.
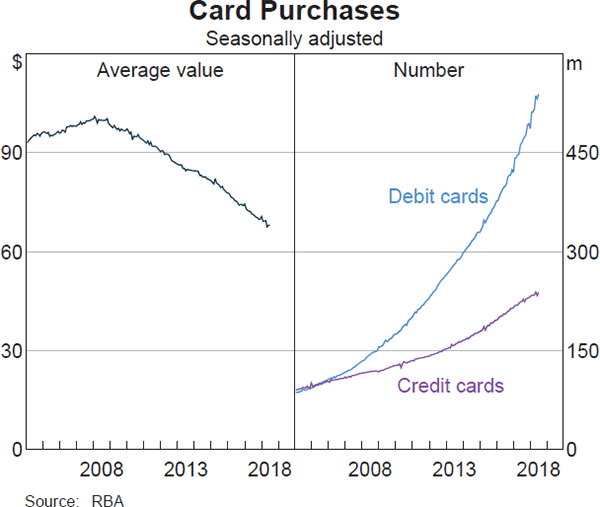
Growth in card payments has been underpinned by the rising popularity of debit card payments (Graph 4, right panel). Both the number and value of debit card transactions continues to grow at a faster pace than credit card transactions. The number of debit card transactions has grown at an average annual rate of 14 per cent over the past decade, compared to 7 per cent for credit cards. The share of debit card payments made using the international (Mastercard or Visa) debit system has been increasing steadily over the past five years, while the share of the domestic eftpos system has been declining. This largely reflects the increased use of contactless payments, which were only supported by the international debit schemes until eftpos introduced the capability around a year ago. For credit card payments, the combined market share of American Express and Diners Club (by value of transactions) has declined noticeably in recent months as several banks have ceased issuing American Express companion cards (see the chapter on ‘Retail Payments Regulation and Policy Issues’).
Mobile payments – contactless payments made with a mobile device using an electronic representation of a debit or credit card – are now being offered by an increasing number of card issuers via their own mobile banking applications or third-party electronic wallets (such as Apple Pay and Android Pay). The Bank's 2016 CPS indicated that mobile payments accounted for a small share of in-person payments, with only around 10 per cent of respondents reporting that they had made a mobile payment or were interested in making them. Other sources suggest that this share has increased modestly since then.
Merchant fees
Merchant fees are paid by merchants to their financial institution (or directly to the card scheme in the case of American Express and Diners Club) for the provision of card acquiring services. The level of merchant fees is heavily influenced by the wholesale interchange fees paid from a merchant's financial institution (known as the acquirer) to the cardholder's financial institution for each transaction and the scheme fees that acquirers pay to the schemes. They can also include annual or monthly fees, terminal fees, terminal rentals, joining fees and other fees charged to merchants by their acquirers.
Average merchant fees for international scheme cards have declined since the early 2000s when the Bank started its card payments reforms. In 2017/18, the average merchant fee for transactions on Mastercard and Visa debit cards declined by 4 basis points, to 0.58 per cent in the June quarter, after being unchanged the previous year (Graph 5). This decline followed a reset in the scheme's debit interchange fees following the lowering of the Bank's weighted-average interchange fee benchmark for debit cards in July 2017; overall, however, the fall in merchant fees appears to have been only around half what would have been seen if there had been full pass-through by acquirers of the fall in interchange fees.[8] The average merchant fee for eftpos transactions was 0.26 per cent of transaction values in the June quarter, broadly unchanged over the year and remaining well below the average rates for transactions in the international debit networks.
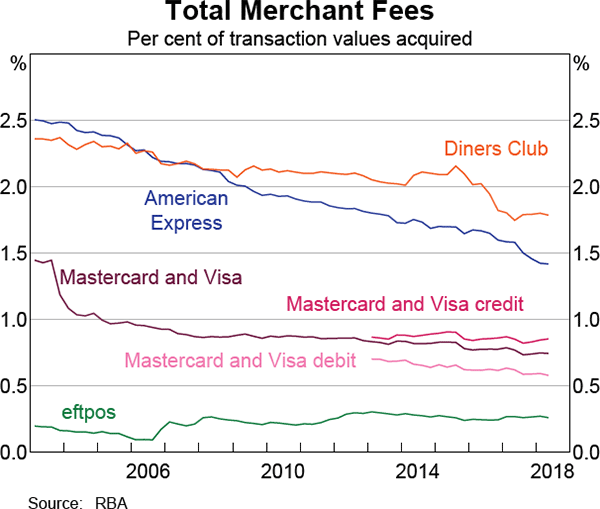
The average merchant fee for Mastercard and Visa credit cards was 0.85 per cent of transaction values in the June quarter, broadly unchanged relative to the past few years. By contrast, the average fee for American Express transactions has continued to decline, falling by 16 basis points over 2017/18, to 1.42 per cent in the June quarter. This reflects reductions in fees for some merchant types by American Express to bolster its acceptance. Over the same period, the average fee for Diners Club remained broadly unchanged at around 1.8 per cent.
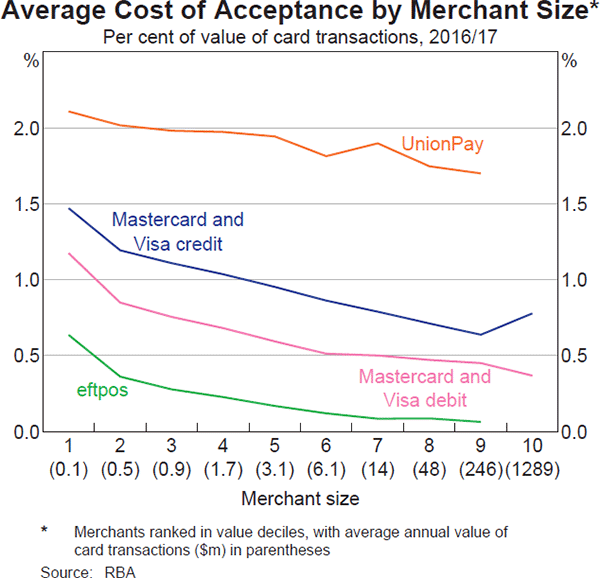
Over the past year, the Bank has focused on some issues regarding the cost of electronic payments to merchants. In late 2017, the Bank asked all the larger acquirers to provide anonymised merchant-level data on the costs to their merchants of accepting different types of cards. The data were collected for about 680,000 merchant accounts and included the total value of card payments and the average cost of payments (in terms of merchant service fees and other costs) in 2016/17 for each of the four-party card schemes (eftpos, Debit Mastercard, Visa Debit, Mastercard credit, Visa credit, and UnionPay). The data corresponded to the information that acquirers are now required to provide their merchants each year as part of the Bank's new surcharging framework.[9] A scatter plot of these data shows that there is a wide range in the cost of payments (averaged across all schemes) for merchants of different sizes, with a tendency for merchants' payment costs to fall as their transaction values rise (Graph 6).
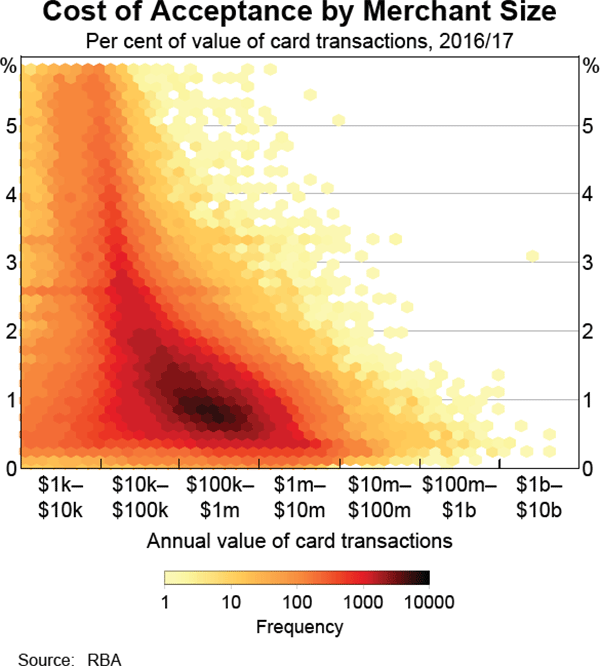
For each of the four-party schemes, average payment costs decline fairly consistently as merchant size increases. Furthermore, merchants of all sizes pay less on average for transactions via eftpos as opposed to the international debit schemes. On average, across different merchant sizes, eftpos is around 44 basis points less expensive than scheme debit, which in turn is around 32 basis points less expensive than scheme credit. UnionPay costs are significantly higher than the other international scheme credit costs, which is not surprising given that most UnionPay transactions in Australia are made with overseas-issued cards that usually have higher interchange fees (UnionPay is not covered by the Bank's interchange standards) (Graph 7).
Direct Entry and BPAY payments
Direct Entry payments account for the bulk of the value of non-cash retail payments (Table 2). Banks and other financial institutions use this system for a wide range of payments, including consumers' internet ‘pay-anyone’ transactions and various types of bulk payments (such as salary and welfare payments) by businesses, corporations and governments. The average value of Direct Entry payments has declined over the past decade, but remains large relative to other electronic payment methods: around $3,500 and $2,950 for direct credits and direct debits, respectively.
In 2017/18, the number and value of BPAY transactions increased by 2.1 per cent and 9.7 per cent, respectively. Consumers and businesses use BPAY to make a range of bill payments, including for utilities, education fees and investments. BPAY payments are much less common than card payments, but the high average value of these payments means they account for a greater share of the value of electronic retail payments than either credit or debit cards. According to the 2016 CPS, consumers are increasingly paying their bills automatically, including via BPAY.
New Payments Platform
The New Payments Platform (NPP) was launched to the public on 13 February. The NPP was developed through industry collaboration to enable households, businesses and government agencies to make real-time payments on a 24/7 basis. Each NPP payment message is capable of carrying up to 280 characters, permitting richer remittance information than the 18 characters currently available for Direct Entry payments. In addition, the NPP provides a ‘PayID’ service, which allows a payment to be made to a registered mobile phone number, ABN or email address (instead of sending a payment to a BSB and account number).
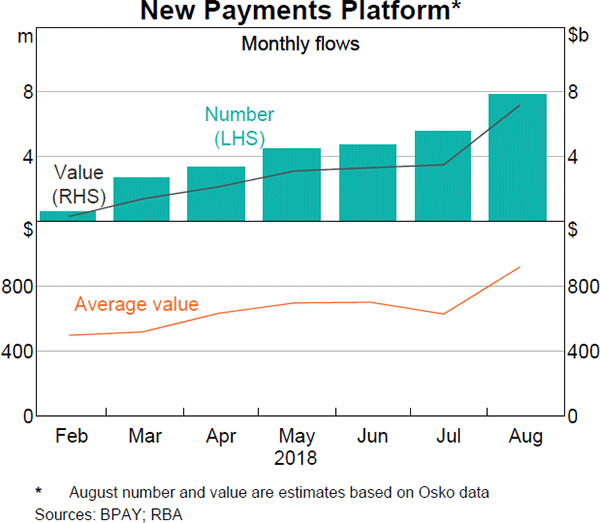
As expected, the financial institutions connected to the NPP have been rolling out services to customers gradually, with some choosing to bring on particular channels or customer segments earlier than others. In addition, a number of financial institutions are still in the process of connecting to the new infrastructure. However, there has been significant progress in this regard recently. Consistent with the gradual rollout, NPP transactions have been growing steadily since its launch (Graph 8). More than 1.9 million PayIDs had been created as of late August, and around 29 million payments worth $21 billion had been sent through the platform. The average value of an NPP payment has increased and is now around $900, consistent with the NPP being used for some larger-value payments that previously would have gone through the Direct Entry system. Over time, it is expected that the NPP will replace an even greater share of Direct Entry payments, particularly those that are more time critical or which benefit from the additional data capabilities.
Cheque payments
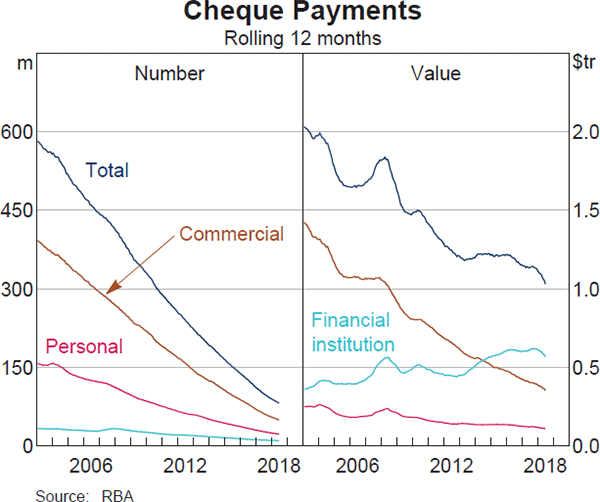
The decline in cheque use in Australia has continued, driven by changing preferences and payment innovations. The total number of cheque payments fell by around 20 per cent in 2017/18 (Graph 9). While the decline was driven by commercial cheques, the number of personal and financial institution (bank) cheques also declined. Overall, the number of cheque payments in Australia has fallen by around 80 per cent over the past decade. As a result, cheques now account for less than 1 per cent of the number of non-cash payments or around 9 per cent by value (Table 2). Where cheques are still used, they are most often for relatively large transactions, including some property purchases. This is reflected in the high average value of cheques written of around $12,500.
The shift away from cheques to electronic payments is expected to continue. The recent launch of the NPP, with its capacity to attach richer data to payment messages, as well as e-conveyancing systems like Property Exchange Australia (PEXA), will likely encourage a further reduction in cheque use. As cheque use declines, the per-transaction cost of supporting the cheque system will continue to rise and it is likely that more businesses and other payees will eventually stop accepting cheques. The Australian Payments Council has been developing a strategy to manage the decline in the cheque system in a way that ensures that the payment needs of individuals and businesses continue to be met in a safe, convenient and efficient manner.
Payment fraud
According to data collected by AusPayNet, losses related to fraudulent payment transactions increased by 6 per cent in 2017, to around $650 million, a slightly slower pace of growth than in the past few years (Graph 10, left panel). The estimated fraud rate (the value of fraudulent transactions as a share of overall transactions) increased to 34 cents per $1,000 transacted, from 32 cents in 2016. The vast bulk of fraud losses, around 95 per cent, come from international scheme debit, credit and charge cards; these fraud losses rose by 8 per cent to about $625 million in 2017 (this includes cards issued and/or acquired in Australia). Fraud losses from ATM transactions and on eftpos-only cards declined from $24 million to $17 million in 2017, while cheque fraud remained broadly steady at $6 million.
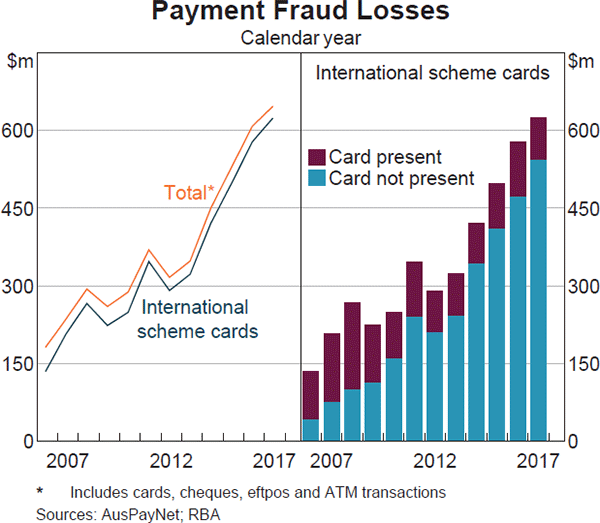
Consistent with the trend in recent years, the increase in card fraud in 2017 was driven by the fraudulent use of scheme cards in the card-not-present (CNP) environment (i.e. online, telephone or mail order). This type of fraud rose by 15 per cent in 2017 to around $550 million, accounting for nearly 90 per cent of total scheme card fraud losses (Graph 10, right panel). Around half of CNP fraud losses in 2017 occurred at Australian merchants (on both Australian and overseas-issued cards) and the other half was perpetrated overseas using Australian-issued cards.
In contrast to CNP fraud, card-present (CP) scheme fraud losses fell by around $25 million in 2017. For domestic scheme transactions, CP fraud losses have been relatively stable over the past few years, and are lower than they were a decade or so ago, consistent with the enhanced security measures that have been introduced, including chip-and-PIN. CP fraud committed with lost and stolen cards has been increasing in recent years, rising by a further 6 per cent in 2017 and accounting for around 80 per cent of CP scheme fraud losses. The rise in this type of fraud has likely been facilitated by tap-and-go payments that do not require a PIN for transactions below $100. Nonetheless, these fraud losses are still significantly less than CNP fraud losses.
While the industry has had success in reducing CP fraud, there has been more focus recently on measures to tackle the significant rise in CNP fraud, particularly given the expectation that online shopping will continue to grow. An industry framework for mitigating CNP fraud is currently being developed by AusPayNet, and is expected to be implemented over the coming year, subject to industry discussions. The core feature of this framework is a risk-based requirement for merchants and issuers to authenticate customers in CNP transactions using two or more authentication factors, such as one-time passcodes, device information and biometrics (see the chapter on ‘Retail Payments Regulation and Policy Issues’). The industry is also pursuing other strategies to combat CNP fraud, including strengthening data security standards and extending the use of tokenisation to a broader range of payment use cases to protect sensitive card data from theft.
Cryptocurrencies
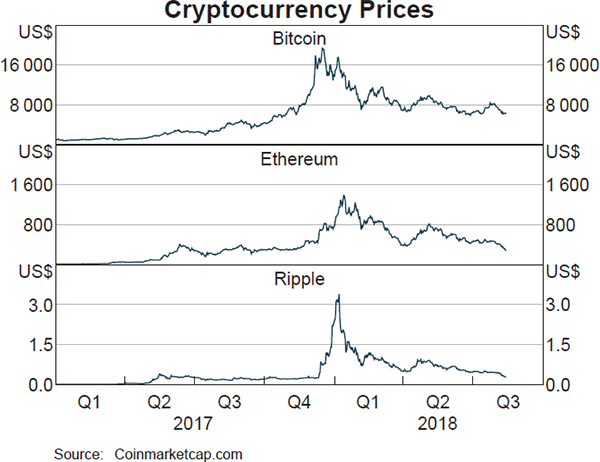
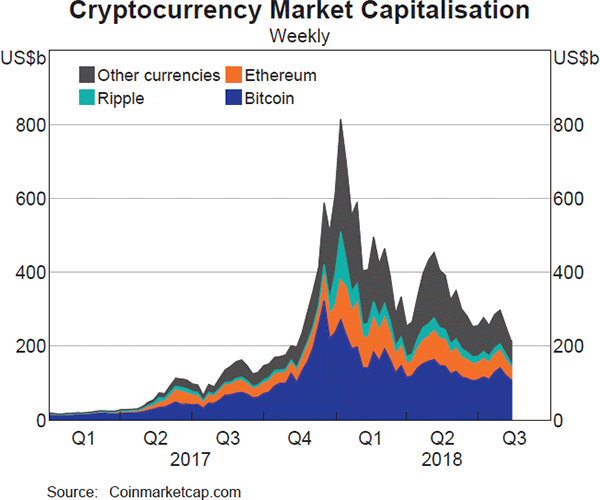
Interest in cryptocurrencies (or crypto-assets or crypto-tokens) has increased significantly in recent years, together with a sharp run-up in prices and the emergence of new products and intermediaries that facilitate trading in them.[10] The prices of Bitcoin and other cryptocurrencies, such as those associated with the Ethereum and Ripple systems, rose particularly sharply in late 2017, as part of what appeared to be a speculative mania that has since significantly subsided (Graph 11). The total market capitalisation of cryptocurrencies reached a peak of over US$800 billion in early 2018, but has since fallen back to around US$200 billion (Graph 12). One factor contributing to the run-up in prices in 2017 was a surge in Initial Coin Offerings, which are a method of fundraising for distributed ledger-based business ventures in which new digital tokens or coins are issued, usually against the payment of cryptocurrencies.
In Australia, it has been estimated that around A$6 billion of cryptocurrencies were traded (bought and sold) at Australian digital currency exchanges (DCEs) in 2017, according to a study by the Australian Digital Commerce Association and Accenture. Around 60 per cent of the total trading value for that year took place in the month of December alone, when cryptocurrency prices and activity spiked higher. The study estimated that Australian DCEs had around 313,000 customer accounts at the end of 2017, however these figures would overstate the number of unique users to the extent that some users had accounts at more than one DCE.
While they are frequently touted as an efficient and anonymous way of making payments, the demand for cryptocurrencies seems to be more focused on their use as a speculative investment than as a payment instrument.[11]
Indeed, in Australia, very few merchants accept cryptocurrencies as a means of payment for goods and services, and cryptocurrencies do not display the other economic attributes normally ascribed to ‘money’. In particular, the volatility in their prices suggests they have not established themselves as a reliable store of value. Moreover, technical features that are required to facilitate trust in a decentralised environment mean that cryptocurrencies are significantly less efficient (e.g. in terms of transaction throughput) than modern payment systems that rely on trusted central parties. It is not obvious, therefore, that cryptocurrencies will ever become a significant part of the payments system in Australia.
High-value Payment and Settlement Systems
In Australia, the final settlement of Australian dollar (AUD) interbank payment obligations occurs across Exchange Settlement (ES) accounts through the Reserve Bank Information and Transfer System (RITS). RITS facilitates settlement of payments on a real-time gross settlement (RTGS) basis. Foreign exchange transactions involving the AUD are generally settled through CLS Bank International (CLS), with AUD funding paid to CLS through RITS. Together these two systems settle the majority of payments in Australia by value. RITS also facilitates the interbank settlement of the payment leg of securities transactions. Securities settlement involves delivery of the security in exchange for payment, typically through a securities settlement facility (SSF).
Reserve Bank Information and Transfer System
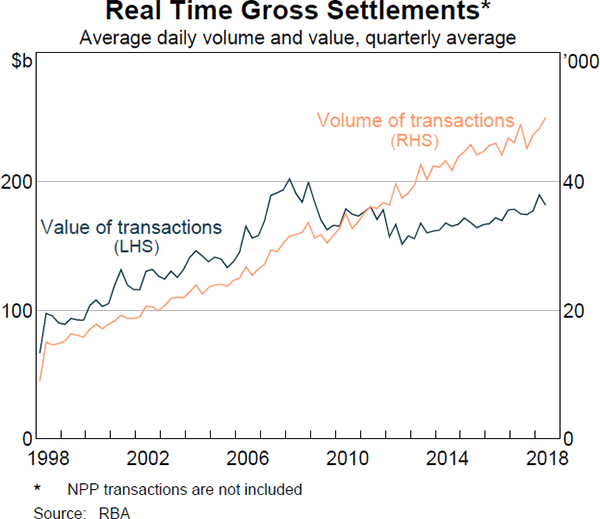
RITS is Australia's high-value settlement system, which is used by banks and other approved institutions to settle their payment obligations on a RTGS basis. RITS is used each day to settle time-critical wholesale payments for other financial market infrastructures (FMIs): Australian dollar pay-ins to or pay-outs from CLS; margin payments to central counterparties (CCPs); and debt and equity settlement obligations arising in securities settlement systems. RITS also settles the interbank obligations arising from non-cash retail payments. Over the past financial year average daily volumes and values of RTGS transactions in RITS increased broadly in line with the longer term trends (Table 3 and Graph 13).
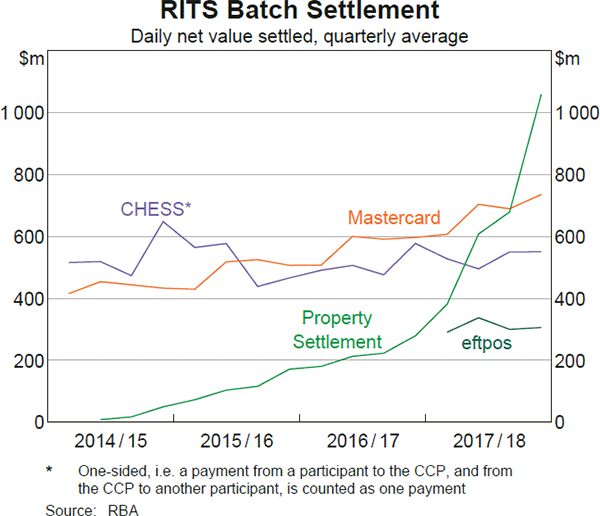
Although RITS is primarily an RTGS system, it also facilitates the multilateral net settlement of interbank obligations arising from other systems. These include non-cash retail payments – such as cheques, direct entry payments and card transactions – most of which are netted through the RITS Low Value Settlement Service. Direct entry makes up the majority of the value of retail payments through RITS. RITS also accepts transactions which are netted outside RITS: cash equity transactions through CHESS, ASX Settlement Pty Limited's (ASX Settlement) equities settlement system; Mastercard's AUD domestic obligations; eftpos scheme obligations and property settlement transactions, managed by PEXA. These batch settlement values have grown very strongly in the financial year due largely to property settlement activity by PEXA and the commencement of the eftpos batch in August 2017 (Graph 14).
During the past year, a new service of RITS – the Fast Settlement Service – was established under the RITS Regulations. The Fast Settlement Service was publicly launched with the NPP in February 2018 and settles transactions submitted via the NPP feeder system on an RTGS basis.
CLS Bank International
CLS is an international payment system that links the settlement of the two legs of a foreign exchange transaction. By operating such a payment-versus-payment settlement mechanism, CLS allows participants to mitigate foreign exchange settlement risk, i.e. the risk that one counterparty to a transaction settles its obligation in one currency, but the other counterparty does not settle its obligation in the other currency. CLS currently settles 18 currencies. The current daily average value of AUD settlements at CLS is around $280 billion. It has risen a little this year, consistent with a rise in the average daily turnover in the Australian dollar.
Securities settlement facilities
In Australia, ASX Settlement provides SSF services for ASX-quoted cash equities, debt products and warrants traded on the ASX and Chi-X Australia Pty Ltd (Chi-X) markets. ASX Settlement also provides SSF services for non-ASX listed securities quoted on the National Stock Exchange of Australia and the Sydney Stock Exchange Limited. The average daily value of cash equity settlements through ASX Settlement has increased moderately in recent years to $9.5 billion.
Austraclear Limited (Austraclear) provides SSF services for trades in debt securities, including government bonds and repurchase agreements. Over the last five years, the average daily value of debt securities settled in Austraclear (including under repurchase agreements) has increased by almost 20 per cent, to approximately $48 billion.
Central Counterparties
CCPs play a major role managing the risks associated with trading in financial instruments. CCPs stand between the counterparties to a financial trade, acting as the buyer to every seller and seller to every buyer; this activity is known as clearing. Participants in cleared markets have credit and liquidity exposures only to the CCP, rather than other participants in the market.
In the absence of a participant default, the CCP is not exposed to market risk as it stands between counterparties with opposite (i.e. offsetting) positions. However, in the event that a participant defaults, the CCP must continue to meet its obligations to its surviving participants. In such an event, the CCP faces potential losses from changes in the value of a defaulting participant's portfolio until it closes out the positions in that portfolio.
To mitigate the risk of such losses, CCPs maintain prefunded resources, typically in the form of initial margin and default funds. Initial margin, which is collected from participants, is sized to cover potential future losses on a participant's portfolio in the event they default, to a specified confidence interval. Accordingly, initial margin provides a risk-based measure of the magnitude of exposures faced by CCPs. Default funds (comprising contributions from participants and/or the CCP itself) are available to cover losses if, in the event of default, the defaulting participant's margin is exhausted.[12]
Four CCPs are licensed to provide services in Australia:
- ASX Clear Pty Limited (ASX Clear) provides CCP services for ASX-quoted cash equities, debt products and warrants traded on the ASX and Chi-X markets and equity-related derivatives traded on the ASX market or over-the-counter (OTC).
- ASX Clear (Futures) Pty Limited (ASX Clear (Futures)) provides CCP services for futures and options on interest rate, equity, energy and commodity products traded on the ASX 24 market, as well as AUD-and NZD-denominated OTC interest rate derivatives (IRD).
- LCH Limited's (LCH Ltd) SwapClear service provides CCP services for OTC IRD.
- Chicago Mercantile Exchange Inc. (CME) is licensed to provide CCP services for OTC IRD, and non-AUD IRD traded on the CME market or the Chicago Board of Trade market for which CME permits portfolio margining with OTC IRD.
Exchange-traded products
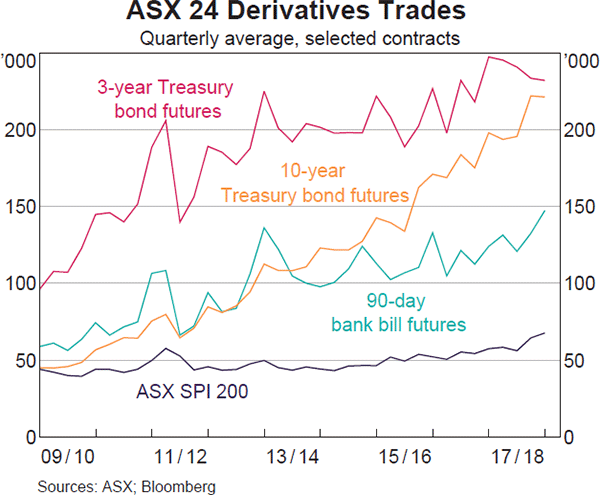
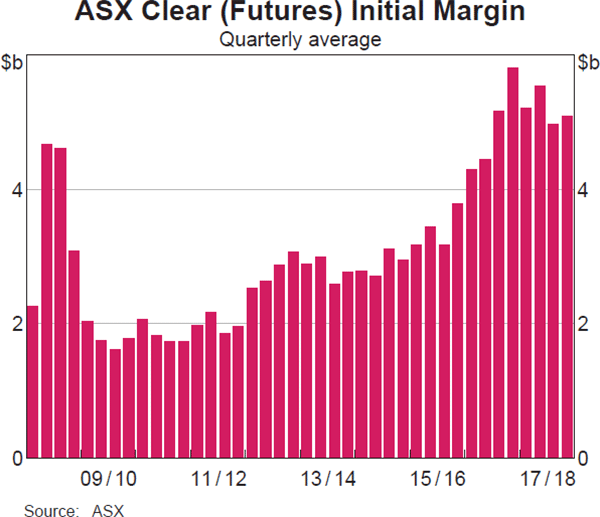
The ASX CCPs clear exchange-traded futures, options, and cash equities. The four major futures contracts cleared – the SPI 200 equity index, the 3-year and 10-year Treasury bond and 90-day bank bill swap – accounted for around 95 per cent of the total volume of transactions cleared at ASX Clear (Futures) in 2017/18 (Graph 15). Transaction volumes increased for each of the four most actively traded contracts on ASX 24 in 2017/18, with the 10-year Treasury bond futures and 90-day bank bill futures contracts experiencing the strongest growth. Exposures at ASX Clear (Futures), measured by initial margin, grew slightly over the year due in large part to growth in transactions in Treasury bond futures (Graph 16).
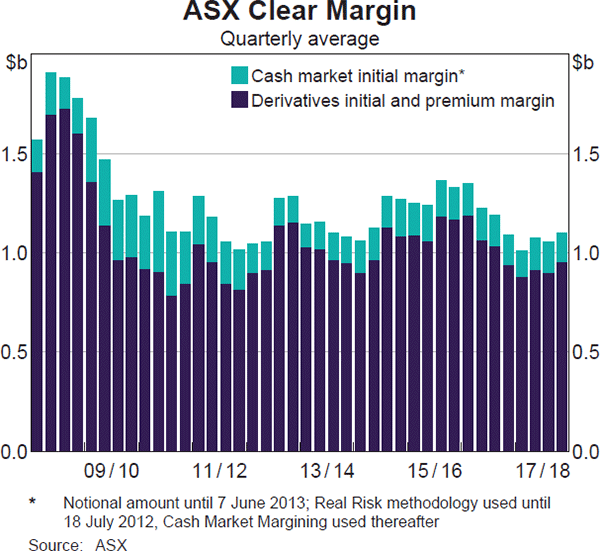
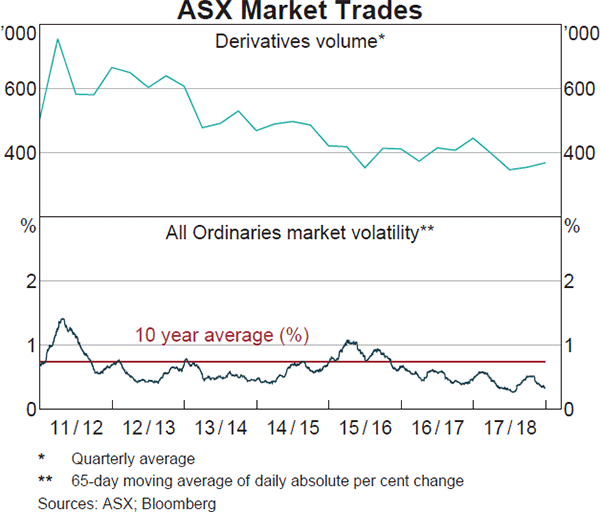
ASX Clear generates exposures from cash equities and equity derivatives products (including exchange-traded options). Exposures from cash equity transactions are much lower than for equity derivatives because of the short duration of cash security trades at two days. ASX Clear's total exposures (including both equity derivatives and cash equities), as measured by margin, was lower in 2017/18 than in recent years, reflecting the lower activity in equity derivatives products and a decline in the level of volatility in equity markets (Graphs 17 and 18).
Over-the-counter interest rate derivatives
Consistent with the G20's OTC derivatives reforms, mandatory central clearing of OTC IRD (denominated in AUD and major currencies) between internationally active dealers came into effect in Australia in April 2016. Due in part to these reforms there has been rapid growth in the proportion of OTC IRD that are centrally cleared. Other regulations, such as higher margin and capital requirements for OTC derivatives that are not cleared, and factors such as increased liquidity and netting benefits, have also provided an incentive for firms to clear more of their derivatives by increasing the relative benefits of clearing. Prior to 2012, Australian banks cleared almost none of their IRDs whereas they now clear over three-quarters of their single-currency interest-rate swaps (Graph 19).
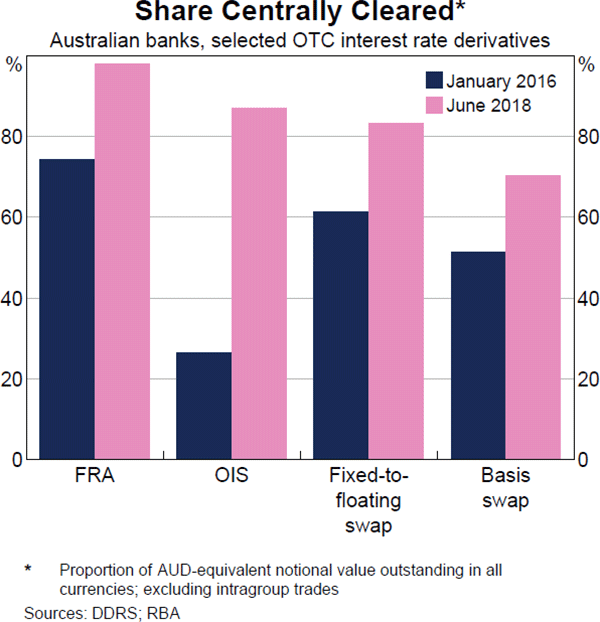
CME, ASX Clear (Futures) and LCH Ltd all offer central clearing for AUD-denominated IRD. The products which account for the majority of outstanding AUD positions are interest rate swaps and overnight index swaps. Other products offered include basis swaps, zero-coupon swaps and variable notional swaps. The notional value of all centrally cleared AUD-denominated OTC IRD rose moderately over the 2017/2018 financial year (Graph 20). As at June 2018, 84 per cent of centrally cleared AUD OTC IRD outstanding were cleared at LCH Ltd, with most of the remaining share cleared at ASX Clear (Futures). Slower growth in the notional value of outstanding AUD-denominated OTC IRD at LCH Ltd than ASX Clear (Futures) was partly attributable to strong trade compression activity at LCH Ltd. Compression involves identifying offsetting trades in participants' portfolios and terminating them, while leaving the participants exposures largely unchanged. It reduces the operational costs and risks of managing a large volume of redundant transactions. During 2017/18, nearly $25 trillion in AUD-denominated OTC IRD were compressed by LCH Ltd.
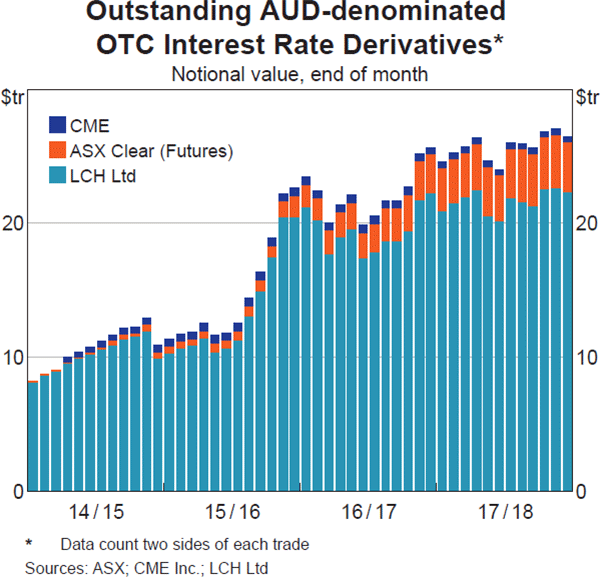
LCH Ltd and CME provide clearing services for OTC IRD in a range of currencies. AUD-denominated contracts make up a small share of outstanding contracts in all currencies – around 5 per cent at LCH Ltd's SwapClear service and around 1 per cent at CME. Australian participation in SwapClear increased over 2017/18, with one new Australian entity joining as a direct participant in April. There are now six Australian-incorporated entities participating as direct clearing participants. CME had no Australian direct clearing participants as at June, though a number of Australian-based banks, superannuation funds and other institutional investors clear products at CME indirectly as clients.
Client clearing
CCPs' exposures are to their direct clearing participants. These participants may offer clearing services to clients, from whom they collect margin to pass onto the CCP. Client margin accounts for a high share of the total initial margin requirements for the CCPs operating in Australia (Graph 21). One reason for these high shares is that clients tend to hold more directional exposures than clearing participants, which are typically dealers that prefer to hold balanced books. Furthermore, client clearing activity has increased over the past few years in response to regulatory changes in the wake of the global financial crisis. In particular, while clearing is not mandatory for many clients – clearing rules in Australia, for example, apply only to large APRA-supervised entities – it has been encouraged by the implementation of margin rules for uncleared OTC derivatives, which increase the costs of these transactions.
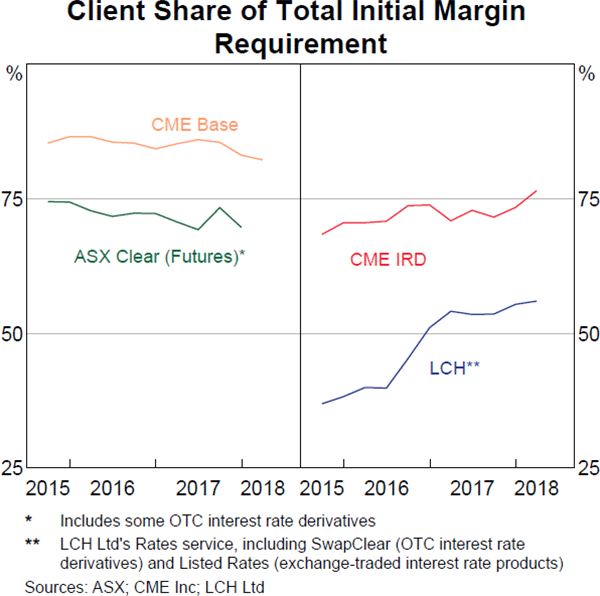
Client clearing changes some of the operational and financial risks faced by CCPs. For example, managing the default of a participant that clears for clients would typically involve the CCP ‘porting’ client accounts to a non-defaulting participant. But results of CCP default management ‘fire drills’ have previously indicated that the porting process could be challenging from an operational perspective, in particular for participants that have a large number of clients. And although CCPs usually have no direct credit exposure to clients, the default of a client could adversely affect the participant through which it clears.
Footnotes
For more information, see: Davies C, M-A Doyle, C Fisher and S Nightingale (2016), ‘The Future of Cash’, RBA Bulletin, December, pp 43–52 and Doyle M-A, C Fisher, E Tellez and A Yadav (2017), ‘How Australians Pay: Evidence from the 2016 Consumer Payments Survey’, Research Discussion Paper 2017-04. [5]
Flannigan G and A Staib (2017), ‘The Growing Demand for Cash’, RBA Bulletin, September, pp 63–74. [6]
Flannigan G and S Parsons (2018), ‘High-denomination Banknotes in Circulation: A Cross-country Analysis’, RBA Bulletin, March, viewed 27 August 2018. Available at <https://www.rba.gov.au/publications/bulletin/2018/mar/high-denomination-banknotes-in-circulation-a-cross-country-analysis.html>. [7]
As noted in the section on ‘Interchange fees’ in the chapter on ‘Retail Payments Regulation and Policy Issues’, under the new standards, the weighted-average interchange fee benchmark for debit cards was reduced from 12 cents to 8 cents, and applies jointly to debit and prepaid cards in each designated scheme. The weighted-average benchmark for credit cards was maintained at 0.50 per cent. These weighted-average benchmarks are now also supplemented by ceilings on individual interchange rates: 0.80 per cent for credit; and 15 cents, or 0.20 per cent if the interchange fee is specified in percentage terms, for debit and prepaid. [8]
See the chapter on ‘Retail Payments Regulation and Policy Issues’ for a discussion of the new surcharging framework, including the obligations on acquirers to provide information to merchants on the cost of acceptance for designated card schemes to assist merchants' surcharging decisions. [9]
For more information, see Lowe P (2017), ‘An eAUD?’, Address to the 2017 Australian Payments Summit, Sydney, 13 December. Available at <https://www.rba.gov.au/speeches/2017/sp-gov-2017-12-13.html>. Also, see Richards A (2018), ‘Cryptocurrencies and Distributed Ledger Technology’, Australian Business Economists Briefing, Sydney, 26 June. Available at <https://www.rba.gov.au/speeches/2018/sp-so-2018-06-26.html>. [10]
For a discussion of some policy issues related to cryptocurrencies see the section on ‘Technology and Innovation’ in the chapter on ‘Retail Payments Regulation and Policy Issues’. [11]
CCPs also call variation margin to cover the exposure to actual changes in market prices, to prevent the build-up of current exposures. It is collected from participants with mark-to-market losses, and typically paid out to participants with gains. [12]