Equity & Diversity Annual Report – 2008 Section 2: Workplace Profile
Section 2.1: Diversity Profile
The RBA currently employs 926 staff. This is an increase of 30, or 3.3 per cent on last year's figure and continues the general upward trend evident over the past five years. The increase in overall staff numbers has not had any significant impact on the share of designated diversity groups as shown in the graph below.
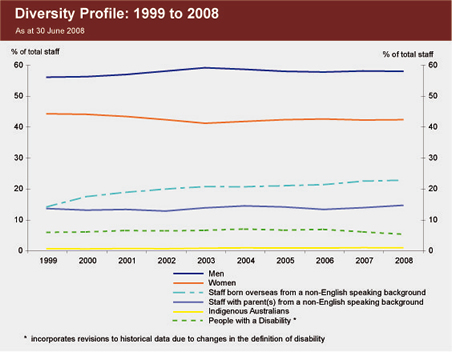
Indigenous Australians continue to account for a very small proportion of staff, at 0.8 per cent. This is lower than their representation in the Australian community (2.3 per cent), and the broader Australian workforce (1.3 per cent). It is, however, comparable to the proportion of indigenous Australians working in occupations similar to those employed at the RBA (0.9 per cent).
Twenty-three per cent of staff were born overseas from a non-English speaking background. The representation of these staff at the RBA is significantly higher than their representation in the Australian community (13.7 per cent) and is also higher than that of the broader Australian workforce, in which 14.3 per cent of Australian workers identified themselves as being from non-English speaking countries.[1]
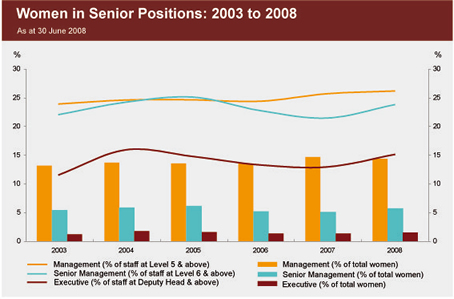
The representation of women employed at the RBA has also remained stable over the past five years at 42 per cent, comparable to the economy-wide female participation rate of 45 per cent. Women continue to be under-represented at the management levels of the RBA, particularly at the executive level. In June 2008, a research project commenced to analyse the career experience of staff by gender in more depth.
Section 2.2: Occupational Groups
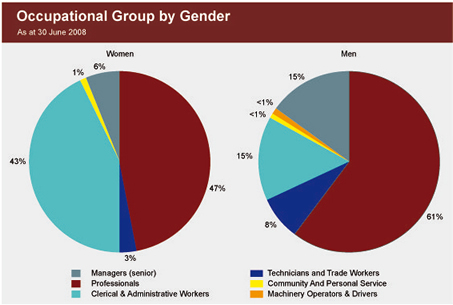
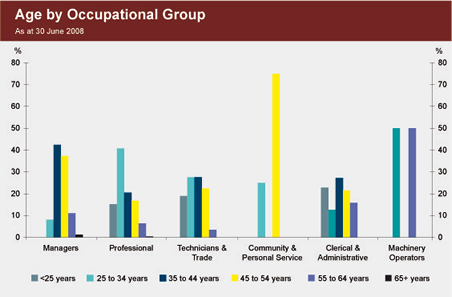
The RBA continues to change from an organisation predominantly comprising clerical and administrative positions to one of a predominantly professional nature. Currently, 47 per cent of all women at the RBA occupy professional positions compared to 61 per cent of all men. There continues to be an over-representation of women in the clerical/administrative occupational group with 43 per cent of all women employed in clerical positions, compared to only 15 per cent of men.
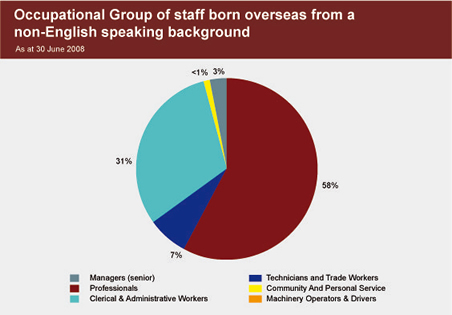
Staff born overseas from a non-English speaking background are highly represented in the professional occupational category with 58 per cent of all such staff employed in professional roles. Three per cent are employed in senior management positions, the same as the previous reporting period. Thirty-one per cent are currently employed in clerical/administrative positions.
Section 2.3: Age & Tenure
Age distribution and length of service data provide an interesting profile of the RBA and help determine strategies for succession planning and recruitment.
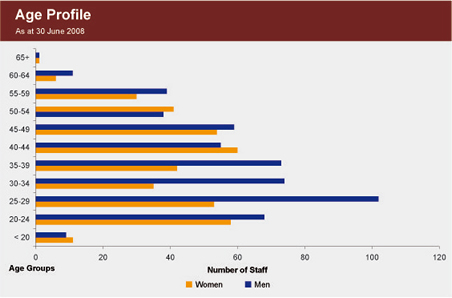
The median age of staff at the RBA is 37. Male staff tend to be slightly younger than female staff, with 48 per cent of men compared to 41 per cent of women under the age of 35; eight years ago, however, the reverse was true. The corollary to this is that there is currently a higher proportion of women that have 10 years or less to retirement age than there was in 2000. Currently, one-third of women are aged 45 and above, compared to 19 per cent in 2000; for men, 28 per cent are in this age bracket, which is lower than eight years ago (32 per cent). With few staff aged 45 and above resigning from the RBA, it serves as an indicator of future retirements. The percentage of staff that are currently eligible for retirement (over 54 years of age) is 10 per cent.
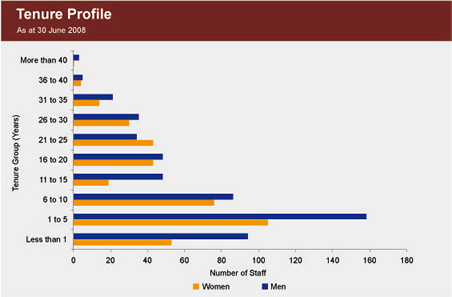
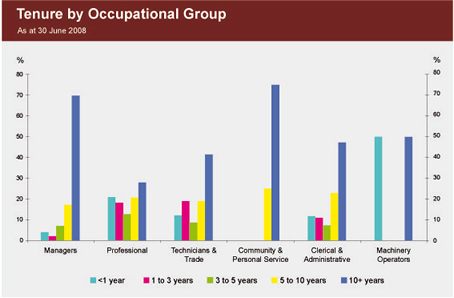
Length-of-service statistics provide a snapshot of the RBA's changing workforce. They indicate that, relative to the year 2000, the length of time that staff are employed at the RBA has shortened somewhat. Currently, 45 per cent of staff have spent less than 5 years at the RBA, compared with 35 per cent eight years ago. In comparison, 21 per cent of staff have been employed by the RBA for more than 20 years, while 31 per cent had in 2000. On average, staff currently spend about 11 years at the RBA.
Section 2.4: Educational Qualifications
Seventy-seven per cent of staff have a post-secondary or tertiary qualification. Overall, 61 per cent of staff now hold a Bachelor Degree or higher, whilst almost a quarter of staff hold a postgraduate qualification.
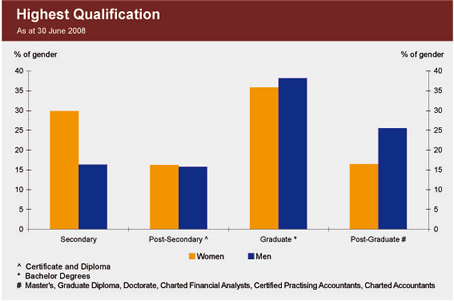
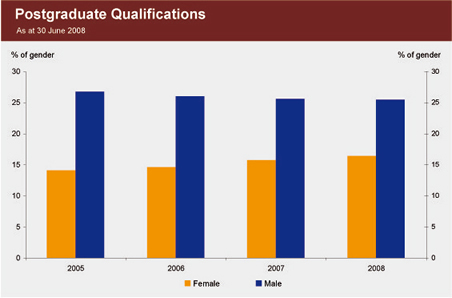
There is no significant difference in the percentage of women holding Certificate or Diploma and Bachelor qualifications when compared to men. A gap remains in postgraduate qualifications where 17 per cent of women compared to 26 per cent of men hold postgraduate qualifications, although this gap has narrowed a little in the past four years.
Footnote
ABS, Census of Population and Housing 2006, ABS, Canberra. People born overseas, excluding those born in the United Kingdom, Republic of Ireland, South Africa, United States of America, New Zealand and Canada. [1]