
Fireside Chat The Restrictive Stance of Monetary Policy
Christopher Kent*
Assistant Governor (Financial Markets)
Reuters NEXT Newsmaker Interview: LSEG Insight Series
– Sydney
Thank you to Reuters and LSEG for the opportunity to speak today.
The Monetary Policy Board sets the level of the cash rate that it judges will achieve low and stable inflation and full employment.
The cash rate affects economic activity, employment and inflation through its influence on financial conditions. Financial conditions is a broad concept capturing the ways in which various financial indicators – such as the exchange rate, asset prices, and the cost of and terms on which households and businesses can access finance – affect economic activity and inflation. These financial indicators are all influenced by the cash rate to different degrees. But financial conditions are also influenced by other factors. For example, credit spreads and the availability of funding will depend on the degree of uncertainty and the willingness of market participants and banks to take on risk.
Monetary policy is considered ‘restrictive’ if financial conditions are restraining aggregate demand and ‘accommodative’ if they are stimulating demand.
At its meeting earlier this week, the Board judged that monetary policy is somewhat restrictive.1 That’s important since, among other things, it underpins the forecasts for slow growth of aggregate demand, which is needed to reduce capacity pressures and bring inflation back to target.
Today I’ll discuss what underpins that assessment. I would emphasise at the outset that this assessment is uncertain. To illustrate that point I’ll step through just a few of the developments that are contributing to that uncertainty: the downturn in the housing market; and AI-related investment and fiscal policies globally.
I begin with how monetary policy has been influencing financial conditions this year.
Restrictive Financial Conditions
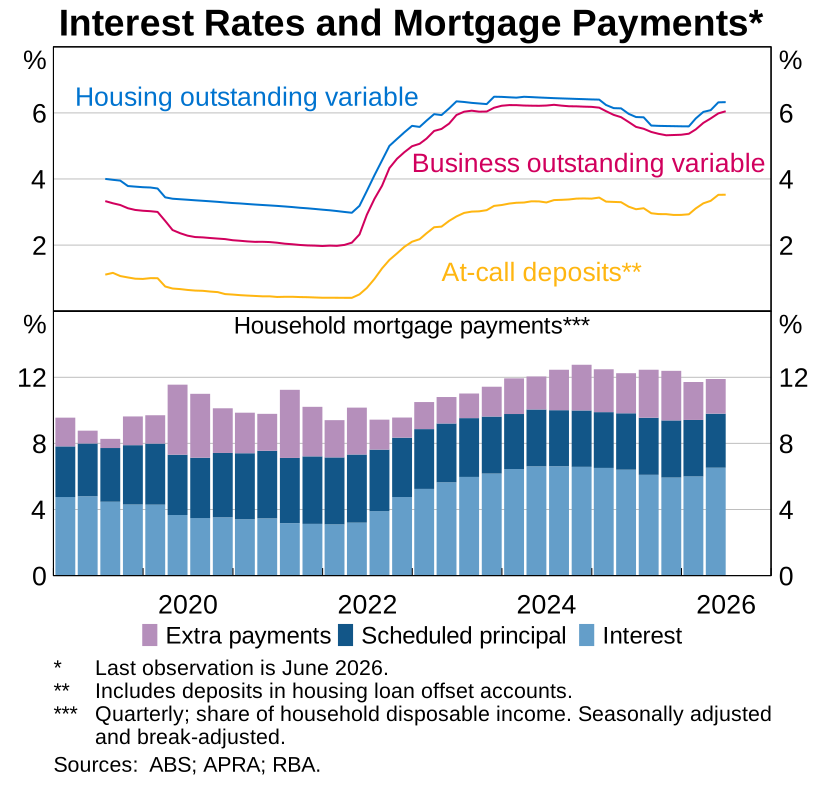
In short, the three cash rate increases earlier this year are having their intended effects and in time will start to encourage more saving and discourage spending. Lending and deposit rates have increased in line with the cash rate (Graph 1). Market interest rates have also increased since late last year, when expectations for the path of the cash rate first shifted higher. Scheduled mortgage payments have risen and are now close to their 2024 peak as a share of household disposable income. And housing credit growth, which moves closely with housing prices, has started to slow, with a noticeable decline in new lending for housing. It takes some time for tighter monetary policy to have its full effect on economic activity and inflation. Growth in private demand is projected to moderate over the remainder of the year as several headwinds weigh on activity, including the tightening in monetary policy earlier this year.
The cash rate increases have also contributed to the Australian dollar appreciating by around 5 per cent on a trade-weighted basis since the start of the year (Graph 2). This is a key part of the transmission mechanism. A higher exchange rate helps moderate inflation by lowering the domestic price of imports. It also dampens demand for locally produced goods and services from Australians and foreigners alike.
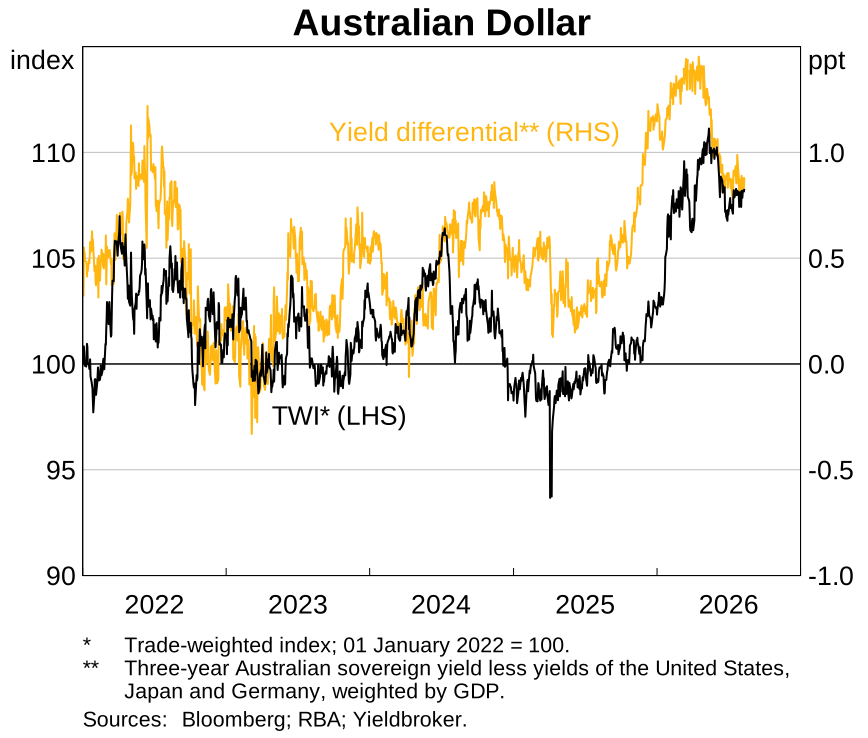
While financial conditions have tightened since the start of the year, some measures have eased over recent months. In particular, pricing implies that market expectations of the path of the cash rate have declined a little since May. This has reduced interest rates faced by some wholesale borrowers, and contributed to a modest pull-back in the value of the Australian dollar. Moreover, the supply of funding for banks, households and businesses remains readily available, with risk premia in many financial markets around historical lows.
So, while not all financial indicators point in the same direction, our assessment is that financial conditions overall are somewhat restrictive. This is supported by a comparison of the cash rate to estimates of the nominal neutral interest rate (Graph 3). This is the level of the cash rate that neither stimulates nor restrains economic activity. The current cash rate is around the top of the range of central estimates of the neutral rate from the various models we estimate and those provided by market economists.
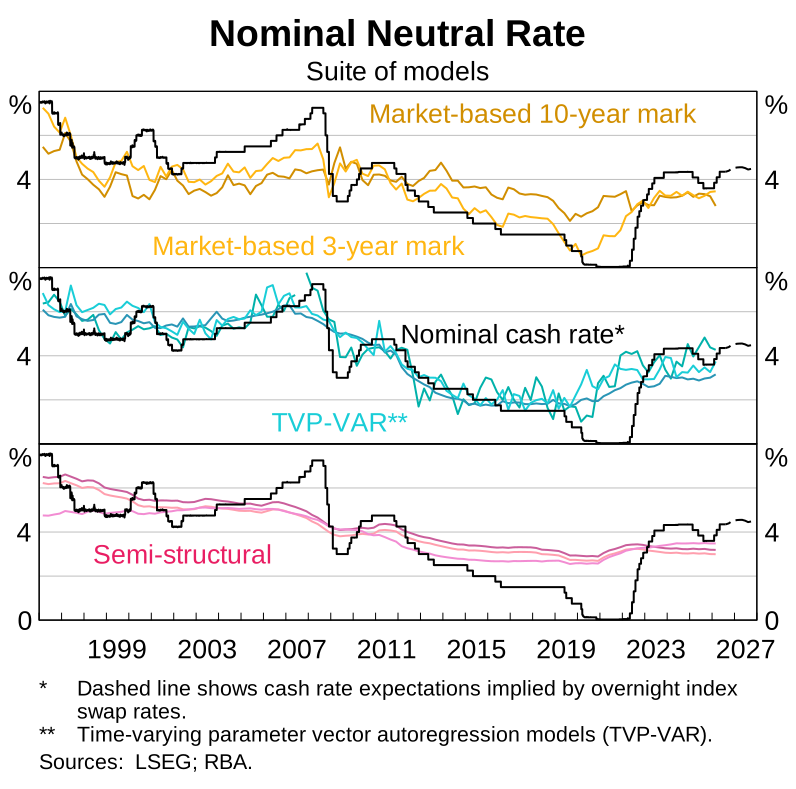
But as I’ve said in previous speeches, there is considerable uncertainty around our neutral rate estimates, including because they may be slow to capture more recent developments that could be influencing financial conditions.2
Housing Market Developments
One area that is relevant at present is the housing market. The housing market plays an important role in the transmission of monetary policy through to consumption and investment. Housing market conditions, including housing prices and growth in housing credit, also respond quickly to – and therefore can help inform our assessment of – financial conditions.
Housing market conditions have softened noticeably in recent months. Housing prices have declined in Sydney and Melbourne, with declines becoming increasingly broad-based (Graph 4). Growth of new housing loans has fallen significantly and forward indicators such as auction clearance rates have also declined to be below their long-run averages.
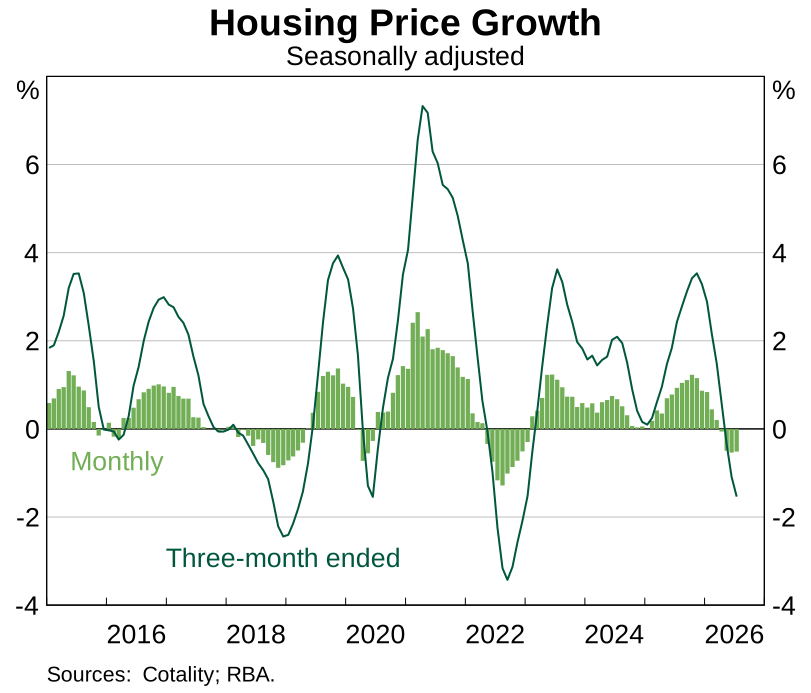
Some of the downturn in the established housing market is what we would expect following the cash rate increases earlier this year. Higher interest rates reduce the net present value of all assets, lower borrowing capacity, increase repayment burdens, and encourage saving.
And some of the downturn reflects a pull-back after a long period of very strong growth in housing prices. In addition, tax changes announced in the federal budget appear to have contributed to reduced demand in the established housing market by lowering the after-tax return from housing for investors. All else equal, these changes will tend to reduce the extent to which monetary policy needs to constrain the growth in aggregate demand to help bring inflation back to the RBA’s target.
Global AI Investment and Fiscal Policies
Another important development – and one that potentially works in the opposite direction in terms of its impact on economic activity – has been the resilience of the growth in aggregate demand globally associated with sizeable AI-related investments.
Substantial investment in data centres and AI-related infrastructure has helped to support growth in aggregate demand of late.3 This is most obvious in economies driving AI innovation and manufacturing, including the United States, South Korea and Taiwan. It is also occurring in Australia, though to a lesser extent.
By itself, this AI activity means that policy rates need to be higher than otherwise, at least in the short run.4 This will be reflected also in higher government bond yields. To the extent that yields rise by more offshore than in Australia, this will tend to imply a lower value for the Australian dollar than otherwise. Given that the exchange rate is a key part of the transmission of monetary policy, at the margin this means that a given level of the cash rate is less restrictive than otherwise, although it is difficult to quantify the magnitude.
In addition to this effect, large public debts and deficits are contributing to higher government bond yields in several advanced economies, including in Europe, Japan and the United States. This would tend to weigh on the Australian dollar exchange rate in a similar way to the effect of strong AI-related investment on aggregate demand offshore. Rising government deficits have also been cited as a factor contributing to the rise in global neutral rates over recent years, a trend which has reduced the tightness of Australian financial conditions for a given level of the cash rate.
Conclusion
In conclusion, the evidence suggests that monetary policy in Australia is somewhat restrictive and that the tightening earlier this year is working. Borrowing costs have increased, mortgage payments have risen, conditions in the established housing market have turned down and the Australian dollar has appreciated over the year to date. Moreover, the growth of aggregate demand appears to be slowing. This is intended and is needed to bring inflation back to target.
And although imprecise, estimates of the nominal neutral rate support the assessment that the current policy stance is somewhat restrictive.
At the same time, several forces other than monetary policy are influencing financial conditions in Australia and so the stance of policy. While it is hard to be precise, the housing market appears to have softened by somewhat more than the recent increase in interest rates would imply, contributing to financial conditions potentially being a bit more restrictive than otherwise. But going the other way, resilient global demand because of AI-related investment, as well as higher yields offshore because of the accumulation of large public debts, will tend to contribute to financial conditions in Australia being less restrictive than otherwise.
As the Board updates its assessment of the economic outlook to guide its decisions in the period ahead, among other things it will be carefully considering the wide range of factors that influence financial conditions and the restrictiveness of monetary policy.
Endnotes
* I would like to thank Richard Finlay, Michael Thornley, and Peter Wallis for assistance with these remarks.
1 RBA (2026), Statement on Monetary Policy, August.
2 See Kent C (2025), ‘Australian Financial Conditions – How Do We Judge How Tight or Easy They Are?’, Address to CFA Society Australia, Sydney, 16 October and Kent C (2026), ‘Reassessing Australian Financial Conditions’, Address to KangaNews Debt Capital Market Summit, Sydney, 26 March.
3 See Soto PE, M Thieu and JS Allen (2026), ‘The AI Buildout and the Economy: Publicly Available Data to Assess AI’s Impact’, FEDS Notes, 17 July.
4 The effect of AI on financial conditions, the nominal neutral rate and market rates is a topic of keen debate, given the various countervailing forces involved. As President Williams from the Federal Reserve Bank of New York noted in May this year, an AI investment boom should result in an increase in desired investment relative to desired savings, boosting real interest rates. To the extent that this investment leads to sustained higher productivity growth, and households understand this, standard macro models would suggest that households will spend some of their higher lifetime incomes immediately, which again pushes up real interest rates. But if productivity increases and that fact is not widely recognised in real time, the effect on real rates is delayed and higher productivity may instead lead to lower inflation. See Williams JC (2026), ‘Productivity Growth and the Challenge of Real-Time Policymaking’, Remarks at the Reykjavik Economic Conference, Reykjavik, Iceland, 28 May.
Underlying data
You can download the underlying data file for all data that are available for public release.