Financial Stability Review – April 2019 2. Household and Business Finances
Risks to the household sector have increased over the past six months given weak housing market conditions. Housing prices have fallen significantly in Sydney and Melbourne after the earlier large run-up in prices, while in Perth and other mining-exposed regions, prices have been declining for several years. However, nationally, only a small share of borrowers have seen the value of their property fall below the value of their loan (see ‘Box B: Housing Price Falls and Negative Equity’). Improved lending standards over recent years have supported this outcome. If there were further large housing price falls, the share of borrowers in negative equity would increase significantly. Even then, negative equity need not be problematic for financial stability as long as the unemployment rate remains low and households continue to be able to repay their debt.
Households are currently well placed to meet their debt obligations given low unemployment. Indeed, households have continued to make substantial voluntary repayments on their loans, albeit at a slower rate. Indicators of financial stress remain low outside the mining-exposed regions. However, the value of housing loans in arrears has drifted up from very low levels.
The risks associated with housing would increase with a rise in the unemployment rate or further substantial price declines. With weak housing market conditions, borrowers experiencing difficulties making loan repayments find it harder to resolve their situation by selling their properties. Housing constitutes a large share of households' wealth and further large declines in housing prices could cause households to pull back on consumption, particularly for those who are highly leveraged. This, in conjunction with falling dwelling investment, could add to rising unemployment. Such a scenario would have adverse consequences for financial stability to the extent that it increases both households' likelihood of default and the losses banks would experience in the event of default.
Housing price declines also increase settlement risk for apartments sold off the plan. If valuations at settlement are below the contracted sale price, some buyers may find it harder to obtain finance and some purchases could fall through. However, as discussed in ‘Box C: Risks in High-density Apartment Markets’, settlement failures remain low to date. Further, some larger and diversified developers have low gearing and can afford to hold some unsold stock.
Commercial property valuations continue to rise much faster than rents. As discussed in Chapter 1, low long-term interest rates have underpinned high asset valuations globally, which could reverse suddenly with increased risk aversion or a jump in expected inflation. Highly leveraged owners of commercial property experiencing falls in valuations could breach loan covenants, which could result in sales and further price falls. In Sydney and Melbourne office markets, vacancy rates are low and rents are rising, minimising these risks for now. In contrast, risks related to retail property markets have risen somewhat given weaker trading conditions over recent quarters and the subdued outlook for household consumption.
Business sector conditions generally remain good, with profits steady and gearing low. However, some businesses, such as those in the retail and farm sectors, continue to face challenges. In addition, credit conditions for small businesses have tightened, creating a risk of flow-on effects to employment in the broader macroeconomy.
Housing price declines in Sydney and Melbourne have been large …
Nationally, housing prices have fallen by 7 per cent over the year to March. Sydney and Melbourne account for almost 40 per cent of the Australian housing stock and have recorded large price falls since late 2017 (Graph 2.1). These price falls have become more broad based across regions within both cities. Weak conditions in Sydney and Melbourne have also been evident in non-price indicators such as low auction clearance rates and increases in the time taken to sell a property, although clearance rates have improved a little of late. Housing prices have declined further in Perth and Darwin to be 18 and 27 per cent lower than their respective peaks in 2014. In contrast, housing prices have been fairly stable in Brisbane and Adelaide over the year to March and have increased in Hobart.
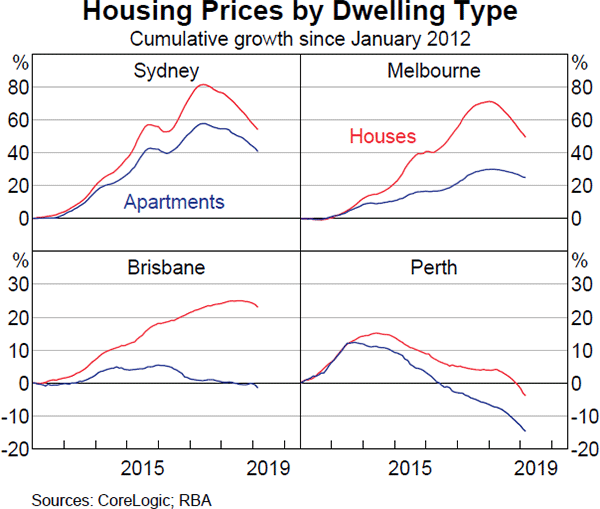
… but follow several years of very strong growth
Large housing price declines can pose risks to financial stability as they erode the equity of indebted households. However, the risks continue to be manageable given the benign economic environment. In Sydney and Melbourne, price declines follow several years of sizeable gains. Overall, Sydney and Melbourne housing prices remain 40–50 per cent higher than in 2012.
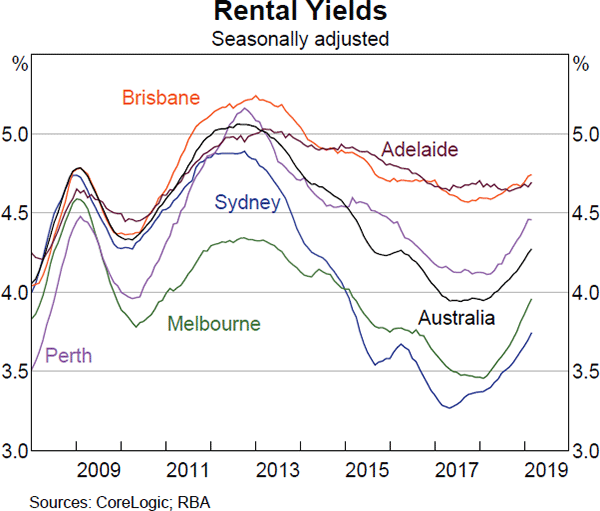
Declines in housing prices in Sydney and Melbourne reflect a number of demand and supply factors. Earlier valuations seemed stretched relative to some measures of prices suggested by fundamentals, particularly if very low interest rates were not expected to persist for the life of the loans used to purchase these properties. Measures of affordability were low and rental yields had also reached historic lows in Sydney and Melbourne (Graph 2.2). The eventual declines in prices occurred alongside a large increase in the supply of new dwellings and a reduction in foreign demand. Further, for some higher-risk lending, the cost of finance increased and non-price terms of lending were tightened in response to the housing policy measures introduced between 2014 and 2017.[1] More recently, price falls themselves appear to have weighed on sentiment towards housing and increased investors' expectations of capital losses, although at some point the adjustment in prices should be sufficient to stimulate additional demand.
There continue to be large volumes of new dwellings under construction, particularly in Sydney and Melbourne, which is likely to weigh on prices for some time. In Sydney, a small but increasing share of the apartment construction is in the outer suburbs, which have traditionally been dominated by detached houses and where demand for high-density dwellings is therefore less well established (see ‘Box C: Risks in High-density Apartment Markets’). In contrast, earlier concerns about the large volume of new apartments in Brisbane have not been realised. Apartment prices there have been relatively stable over the past six months, suggesting there has been sufficient demand for these new dwellings to absorb supply. Growth in housing supply is expected to run ahead of population growth in Sydney and possibly Melbourne for the next couple of years as the large volume of construction currently underway is completed. With continued strong population growth and fewer projects now being planned, this new supply is expected to be absorbed over time. Nevertheless, there is a near-term risk that the delivery of a large volume of new apartments into a weak market could amplify price declines.
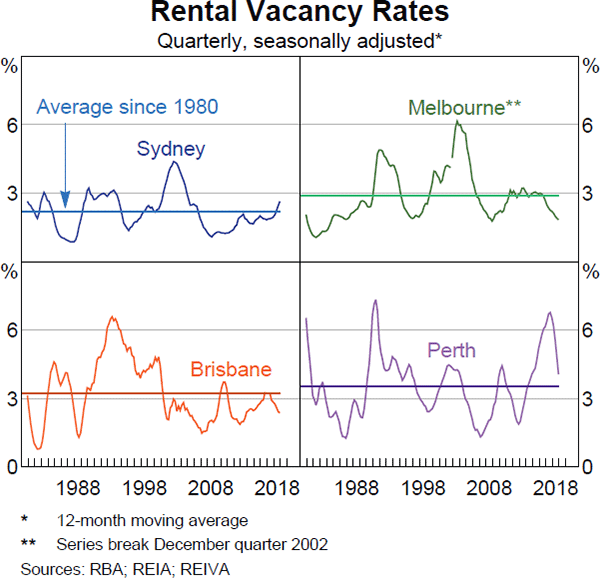
In Sydney, rental vacancies are rising and advertised rents have fallen (Graph 2.3). Some investors may experience declining net rental income with such losses compounded by falling capital values. In contrast, in other capital cities rental vacancy rates have fallen, suggesting that increases in supply have been met with ongoing strong demand. Despite this, large price declines increase settlement risk for off-the-plan apartment sales and could lead to an increase in financial stress for some, particularly smaller, developers.
Soft housing market conditions have contributed to lower housing credit growth
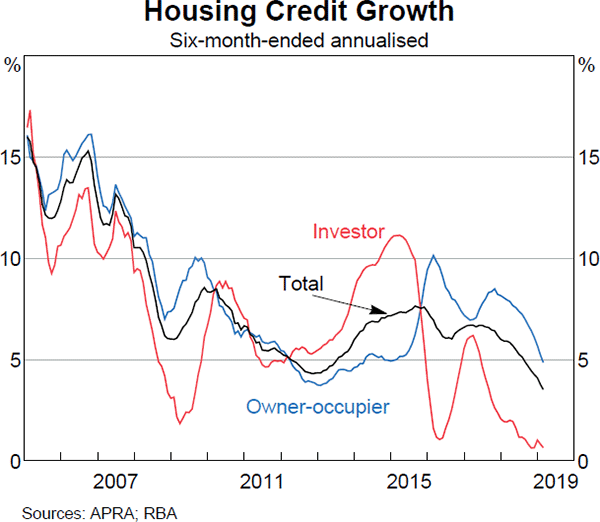
Housing credit growth has moderated since mid 2017, consistent with reduced demand for housing finance (Graph 2.4). The slowdown has been most pronounced for investor credit growth, which has slowed to a historical low of just under 1 per cent in year-ended terms. However, owner-occupier credit growth has also eased. The decline in housing credit growth over the past six months reflects a slowdown in lending by authorised deposit-taking institutions (ADIs), particularly the major banks. In liaison, banks reported that they had received significantly fewer loan applications over the past year. This has been partly offset by ongoing strong growth in non-ADI housing credit, with estimates suggesting it is at least twice as fast as for ADIs. Liaison with non-ADIs and brokers indicates that growth in non-ADI lending has been supported by a tightening in ADIs' lending practices. Despite this, non-ADIs continue to account for only a small share of housing credit.
Housing credit conditions remain tighter than they have been for some time. Although the largest changes to lending standards occurred between 2015 and 2017, lenders have continued to improve their processes for implementing the existing standards. The recent focus has been on improving how borrowers' living expenses are assessed in loan applications, including reducing lenders' reliance on living expense benchmarks. More recently, the introduction of comprehensive credit reporting from September 2018 for credit cards is enabling banks to see more complete information on borrowers' credit and store card debts and limits. In liaison, banks reported there were discrepancies in some applications between what borrowers disclosed and the information in the credit database. It is still too early to assess the impact on the availability of credit. Since credit assessments are based on credit card limits rather than balances, most prospective borrowers can respond by cancelling credit cards or reducing their limits. As a result, few households are reportedly being declined credit based on their comprehensive credit report. Nevertheless, it is foreseeable that the expansion of comprehensive credit reporting could lead to further tightening. Over 2019, additional information on personal credit and mortgages will be made available to lenders, which could be expected to reduce maximum loan sizes for some prospective borrowers. Overall, liaison with banks suggests that most people who apply for a loan can still obtain one, though they have to provide more documents and it is generally taking a few days longer to be approved.
Recent regulatory developments are a recognition that the current framework of lending standards provides adequate safeguards against excessively risky mortgage lending. The final report of the Royal Commission into Misconduct in the Banking, Superannuation and Financial Services Industry did not recommend any changes to responsible lending legislation under the National Consumer Credit Protection Act. It acknowledged the improvements that had already been made by lenders to meet the existing standards. By resolving some of the uncertainty around whether further tightening in standards would be required, the publication of the report could support credit provision. The Australian Securities and Investment Commission has recently commenced a public consultation to update its guidance on responsible lending. The objective is to provide greater clarity around existing requirements, rather than to change the obligations of lenders.
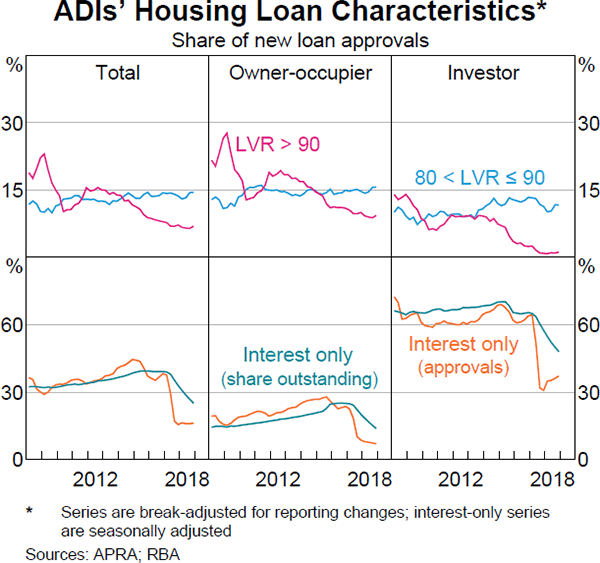
In December 2018, the Australian Prudential Regulation Authority (APRA) announced the removal of the interest-only (IO) lending benchmark. ADIs will not be subject to the IO lending benchmark if they have qualified to have the investor lending benchmark removed (the latter change was announced in April 2018). To be released from the investor lending benchmark, ADIs are required to provide APRA with assurances on their lending policies and practices. APRA expects that banks will continue to maintain prudent internal risk limits (not prohibitions) on IO lending, such as IO loans at high loan-to-valuation ratios (LVRs), with long IO periods and to owner-occupiers. APRA's decision to remove both benchmarks reflects an assessment that, with lending standards now sufficiently improved, these temporary measures are no longer required to curtail higher-risk lending.
The quality of banks' new mortgage lending has continued to improve
Improvements in the quality of banks' mortgage lending have mitigated the risks that weaker housing market conditions might otherwise pose to household and bank balance sheets. This is especially true for new borrowers, who have had less time to accumulate equity through earlier housing price rises and principal repayments. Changes in lending practices over the past few years mean that new borrowers will, on average, have less risky loans and be in a better financial position than previous cohorts.
The cumulative effect of the housing policy measures over recent years has been to reduce the maximum loan sizes available to most borrowers and to reduce higher-risk lending, including that at high LVRs and on IO terms (Graph 2.5). Loans with an LVR over 90 per cent remain less than 7 per cent of housing loan approvals, while new IO lending has fallen to around 16 per cent of total loan approvals and 7 per cent of owner-occupier loan approvals.
Household debt remains high but most indebted households can afford their debt repayments
Although lending standards have improved and housing credit growth has slowed, the ongoing high level of aggregate household indebtedness remains a key vulnerability. Highly indebted households are a key risk to financial stability since they are more susceptible to falling behind on their repayments in the event of an adverse shock to their ability to service their loans (for example, rising interest rates or unemployment). Highly indebted households may also be more likely to reduce their spending if macroeconomic conditions deteriorate. This could amplify the impact of any downturn. Most households are well placed to service their debt. However, the distributions of debt and prepayment buffers are uneven across households and, accordingly, a small share of borrowers remain relatively vulnerable.
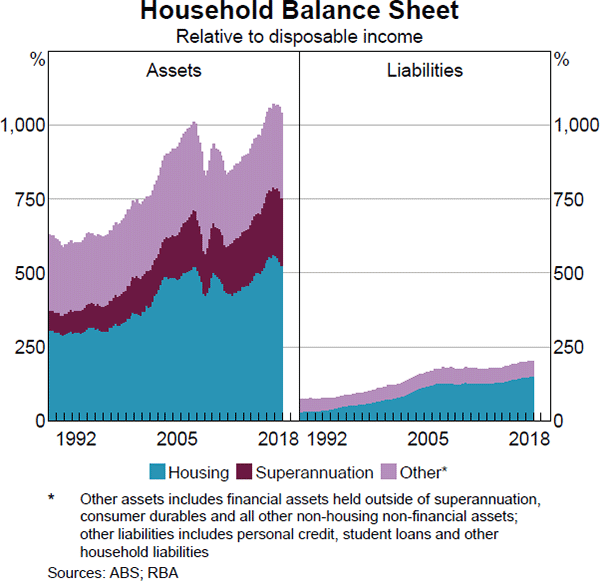
Despite housing price falls, household gearing levels are low in aggregate. Total assets are five times larger than the stock of liabilities (Graph 2.6). Around one-third of households own their own home outright, which contributes to the low aggregate gearing ratio. Estimates suggest that fewer than 5 per cent of households have gearing ratios greater than 80 per cent. This small share of households are most exposed to the recent decline in housing prices because they require smaller price falls to tip them into negative equity than less leveraged borrowers. However, estimates and liaison with banks suggest that the share of households currently in negative equity is low (see ‘Box B: Housing Price Falls and Negative Equity’).
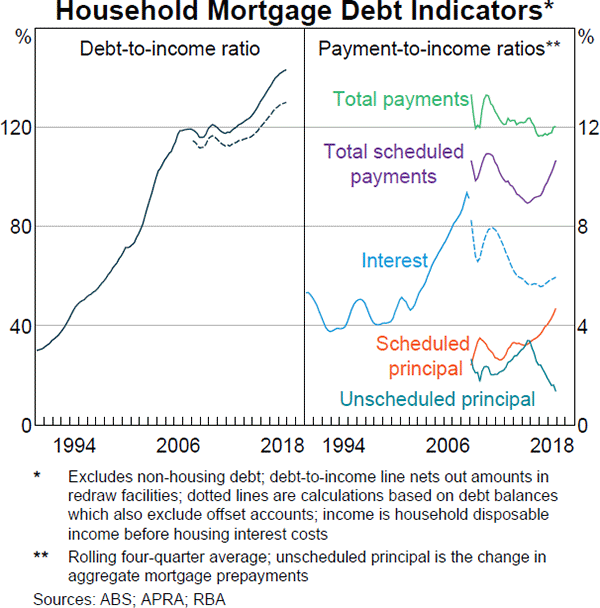
Households' total repayments on housing debt have been broadly stable as a share of household income over recent years. However, a greater share of these repayments are required rather than voluntary. Interest payments as a share of income have picked up a little given recent modest increases in mortgage interest rates. More notable, though, is that payments of scheduled principal are accounting for an increasing share of household income (Graph 2.7). The increase in scheduled principal repayments reflects a combination of factors including rising debt, an increase in the share of loans repaying principal (as the stock of IO loans has declined) and a modest ageing of the loan pool (older loans pay proportionally more principal). Rising scheduled principal payments have recently occurred at the same time that unscheduled principal, or ‘voluntary’ prepayments, have declined. Households are still making additional principal payments of around 1¼ per cent of income, although this is down from 3½ per cent in 2015.
The aggregate stock of mortgage prepayments remains large. The stock of prepayments (the sum of balances in offset accounts and redraw facilities) accounts for 16½ per cent of the gross stock of housing credit or a bit over 2½ years of repayments at current interest rates (Graph 2.8).[2]
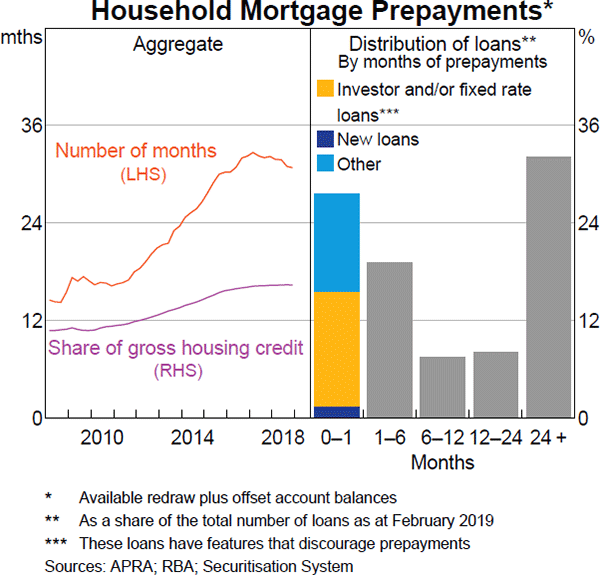
But nearly 30 per cent of loans have no or little buffer, and so appear more vulnerable. Many of these have disincentives to prepay (fixed rate and investor loans) and so borrowers may be accumulating savings outside of their mortgage products. Another, smaller, share of loans with no buffers are new loans that have had little time to accumulate prepayments. Most of this latter group of loans may be expected to build prepayments over time, though they remain relatively vulnerable in the near term. With slower credit growth, the share of new loans with no buffer is likely to decline further.
Survey measures suggest household financial stress remains low …
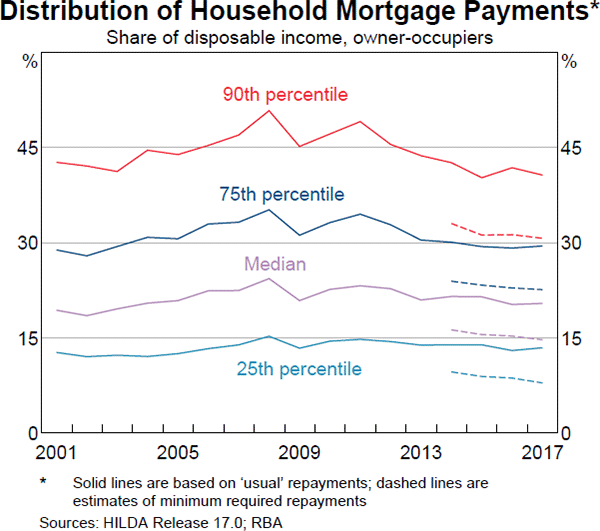
Some households are experiencing financial stress, but this is not widespread. Broad, albeit lagging, measures tend to show flat or declining rates of financial stress. Data from the 2017 Household Income and Labour Dynamics in Australia (HILDA) survey show that the ratio of mortgage servicing costs to income has been flat or declining for owner-occupier borrowers, based on measures of both required and actual repayments (Graph 2.9). The prevalence of households reporting that they had experienced financial stress had also been steady. The rate of household bankruptcies continued to drift down in 2018 in most states and remains near its lowest level in nearly two decades. The main exception continues to be Western Australia, where the rate of bankruptcies remains high though it has declined a little of late.
The ongoing process of loans switching from IO to principal and interest (P&I) payments remains a potential source of financial stress. These borrowers face a substantial increase in required repayments, often up to 40 per cent. Estimates suggest that around $120 billion of IO loans (7 per cent of the outstanding stock of credit) are scheduled to convert to P&I repayments in 2019. Most of these were originated before 2015 when lending standards were weaker, suggesting that some borrowers might face difficulties in meeting the step-up in repayments. Many borrowers with IO loans who could afford to switch to P&I loans before their IO periods expired to obtain a lower interest rate have already done so. So there may be a larger share of lower credit quality IO borrowers among those who have not yet switched. However, instances of repayment difficulties are likely to be fairly isolated, because interest rates have fallen since 2014 and most borrowers did not borrow the maximum amount that was available to them. RBA estimates suggest that the volume of ‘forced’ switches from IO to P&I in 2019 will not be significantly larger than in 2018. If the experience from 2018 continues, most IO borrowers should cope with the required switch to P&I in 2019. While there is some evidence of a small increase in the arrears rate for the cohort of loans that contractually converted from IO to P&I repayments in 2018, most borrowers appear to have managed the transition to higher repayments without falling behind on their repayments.
… and housing loan arrears rates, while low, are edging higher
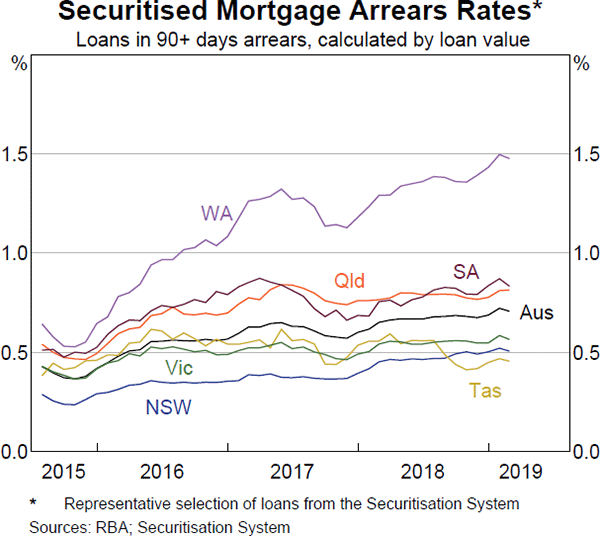
Indicators of aggregate household financial stress currently remain low overall but there are regional differences. In Western Australia, the share of housing loans in arrears has increased, reflecting weak economic conditions (Graph 2.10). In New South Wales, the share of housing loans in arrears has also drifted up a little in recent years, but from a very low level.
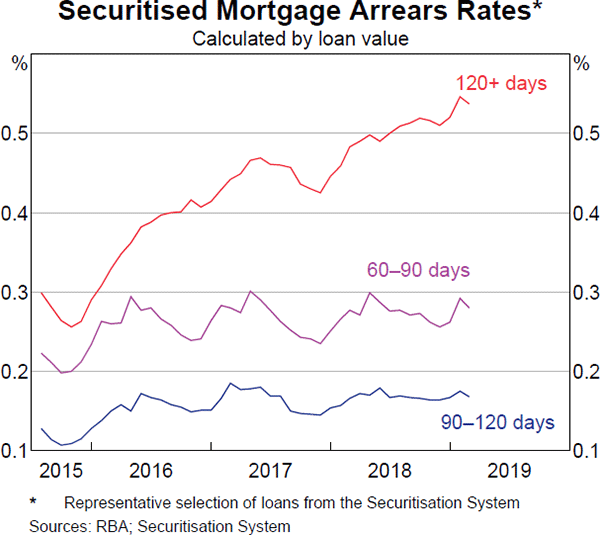
Arrears rates have risen to a large extent because housing loans are, on average, staying in arrears for longer (120 days or more; Graph 2.11). Meanwhile, the share of loans that have been in arrears for shorter periods is little changed. Borrowers are finding it more difficult to resolve repayment difficulties, by either catching up on overdue payments or, in some cases, voluntarily selling their property. This latter option may be taking longer in a softer housing market. Changes in lenders' forbearance and foreclosure policies could also be contributing to higher longer-term arrears rates. Liaison with banks indicates that this has occurred to an extent. However, banks also report that they are now tightening their management of non-performing loans in recognition that longer processes could ultimately make the borrower and the lender worse off, especially when housing prices are declining.
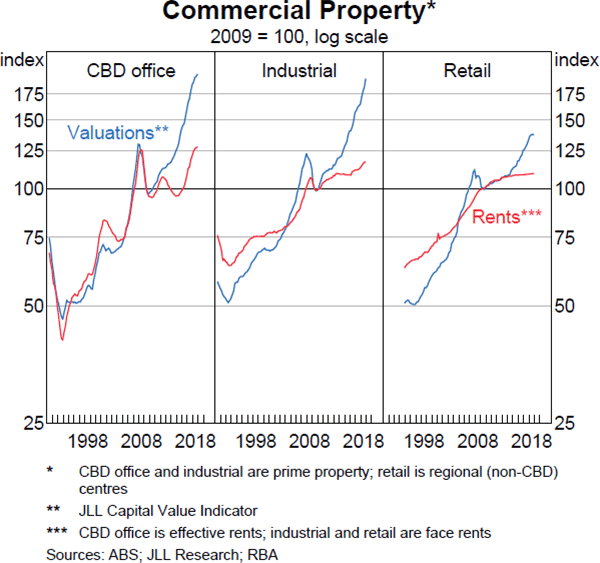
Commercial property valuations continue to rise faster than rents
Commercial property valuations increased further over 2018. Valuations have increased by significantly more than rents, pushing rental yields lower (Graph 2.12). The strong growth in valuations globally has been underpinned by low interest rates in combination with a fall in the compensation for risk demanded by investors (Graph 2.13). Valuations are, therefore, susceptible to a pick-up in risk-free yields or a decline in risk appetite, both of which could trigger a portfolio allocation away from commercial property. Highly leveraged investors could then be vulnerable to breaching their LVR covenants on bank debt. This could trigger property fire sales and further price falls.
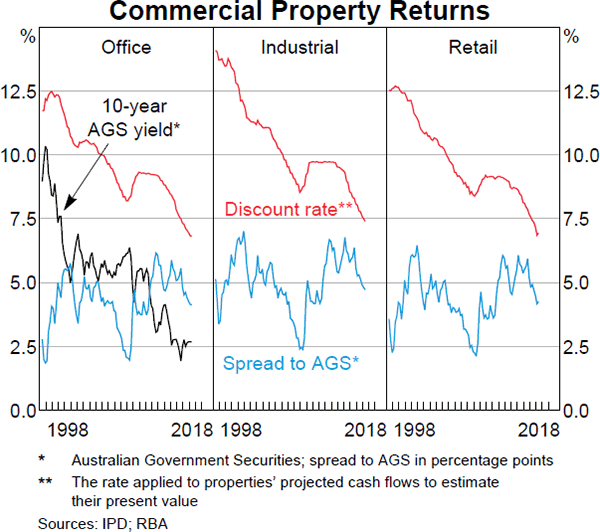
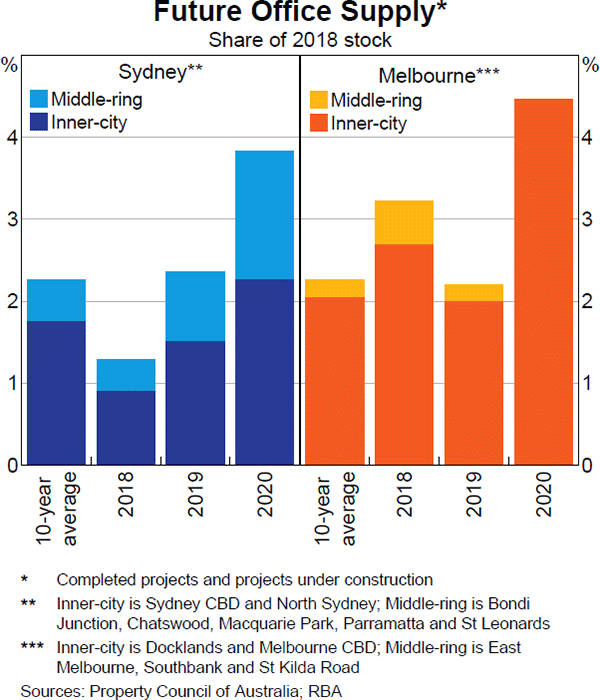
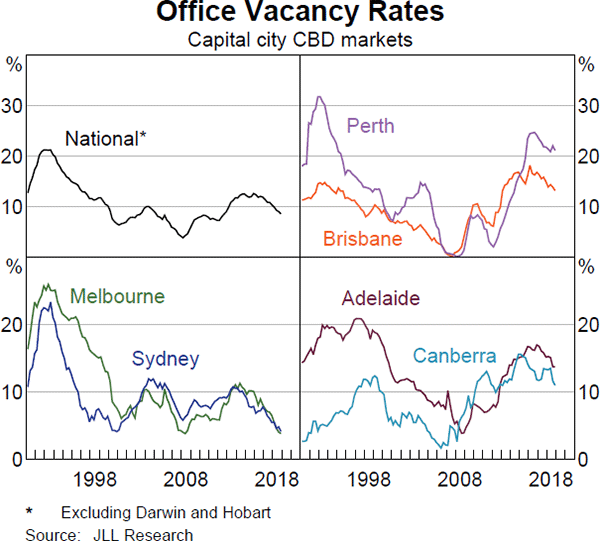
Conditions in office property markets continue to vary across cities. In Sydney and Melbourne, ongoing strength in local economic conditions and tenant demand has seen vacancy rates fall further. A number of withdrawals from the office stock in the Sydney CBD have also contributed to low office vacancy rates. However, tight market conditions for offices in Sydney and Melbourne have elicited a supply response after several years of limited additions, with most new supply to be completed around 2020 (Graph 2.14). While economic conditions remain supportive in Sydney and Melbourne, a deterioration in macroeconomic conditions could result in higher vacancy rates and lower-than-expected rents. This in turn would put downward pressure on valuations.
In contrast to Sydney and Melbourne, office vacancy rates remain elevated in Brisbane and Perth (Graph 2.15). Vacancy rates in these cities declined over 2018, but the improvement was not broad based. Second-grade and non-CBD office properties have higher vacancy rates because tenants have continued to relocate into better quality space in these cities' CBDs.
For retail commercial property, growing competition from online retailers and changing consumer preferences are making trading conditions more challenging for bricks-and-mortar retailers of discretionary goods and, in turn, their landlords. Retail rents have been flat overall, although the outlook varies by the type of retail property. The most challenging adjustment is for retail properties in shopping centres with large discount department stores as the anchor tenants and for local high street shopping strips.
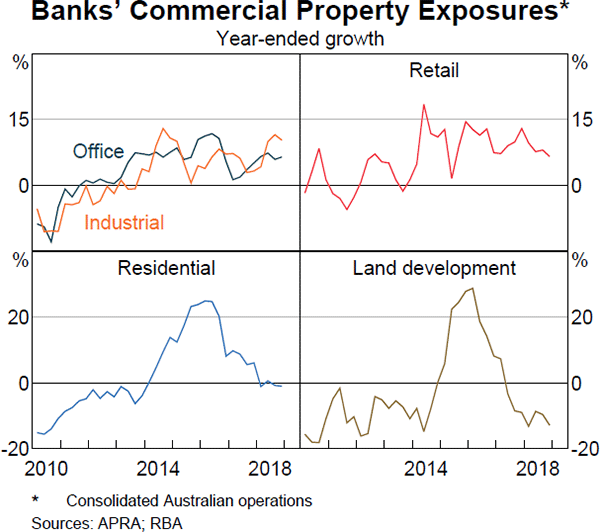
Growth in banks' lending to different segments of the commercial property sector diverged over 2018 (Graph 2.16). Growth in lending for office and industrial properties has been fairly steady over the past six months, driven by foreign-owned banks and the major Australian banks. This comes after a period of slower growth following APRA's 2016 review of commercial property lending. By contrast, lending growth for retail property slowed over 2018. Liaison with banks indicates lending conditions have tightened in response to the challenging environment for retailers and their landlords. Given the downturn in the housing market, banks have not grown their lending for residential development, and are contracting their lending for land development.
The financial health of businesses remains generally sound …
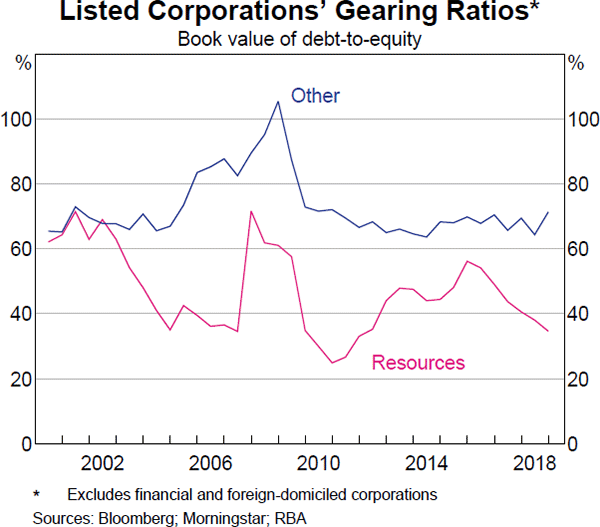
Overall, businesses' finances remain in good shape, supported by positive economic conditions and low interest rates. Aggregate earnings of listed companies are mostly high and gearing ratios remain low (Graph 2.17). Further, the business sector is well placed to service its debt with businesses' debt-servicing ratios remaining broadly unchanged over 2018.
Nevertheless, some businesses are experiencing challenging conditions. Liaison with banks suggests that the financial position of businesses in regions affected by drought or by the north Queensland floods has worsened as farmers have reduced their spending. Meanwhile, the retail sector continues to face challenges associated with weak sales growth and ongoing competitive pressures. However, there is no evidence of a significant pick-up in failure rates among retailers. Looking ahead, businesses in the residential construction sector are likely to face more difficult conditions as completed projects are not replaced with new ones.
… but small businesses are facing tighter credit conditions
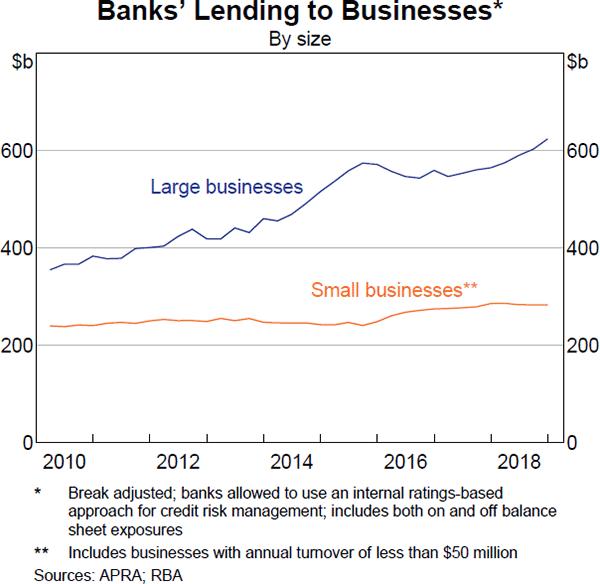
Credit conditions for small businesses have tightened over the past year. Credit extended to businesses with turnover less than $50 million is growing more slowly than credit for large businesses (Graph 2.18). The tighter availability of credit for small businesses reflects a number of factors. One is that banks appear to be applying responsible lending rules for consumer credit to some small business lending given the blurred distinction between the personal and business finances for some entrepreneurs. Responsible lending obligations for consumer credit are stricter than requirements for lending to small businesses. Another is that the recent decline in housing prices may have reduced the supply of credit to some small businesses, given that small business lending is often secured by housing. A source of uncertainty in the period ahead stems from the Royal Commission, which recommended expanding the definition of a small business under the Australian Bankers' Association Banking Code of Practice from a business with total debt of up to $3 million to a business making a loan application of up to $5 million. Liaison with banks has noted the proposed definition would mean that a larger number of businesses would be covered by the protections for small business under the Banking Code of Practice, although it is not clear how many.
This tightening in credit conditions could be a challenge for businesses needing to refinance existing debt. It could also have flow-on effects to the broader macroeconomy; small businesses account for nearly half of employment in the non-financial business sector. If this led to an increase in the unemployment rate, this would affect the financial health of households.
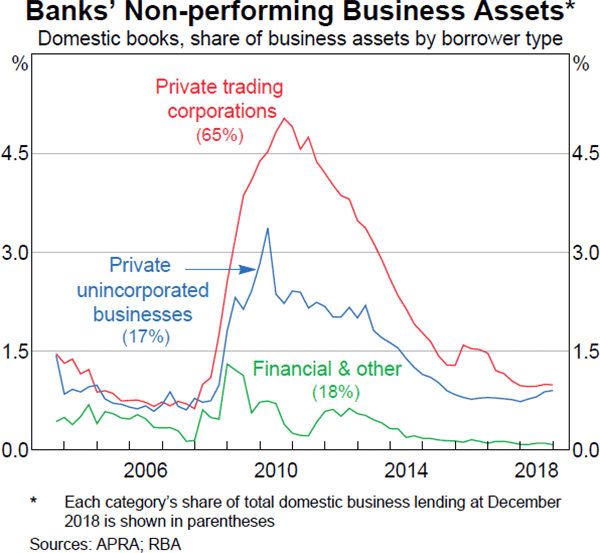
There are early signs that small businesses' loan performance worsened over 2018. This is evident in a pick-up in the non-performing loans rate for unincorporated businesses, although it remains at low levels and some of this is related to drought conditions in many regional areas (Graph 2.19).
Footnotes
For further details, see RBA (2018), ‘Assessing the Effects of Housing Lending Policy Measures’, Financial Stability Review, October, pp 75–88. [1]
The gross stock of housing credit is the value of housing credit outstanding before taking into account balances in offset accounts and redraw facilities. Published housing credit data nets off balances in redraw facilities but not offset accounts. [2]