
Bulletin – May 2026 Payments Consumer Payment Behaviour in Australia
Transcript
Results from the RBA’s 2025 Consumer Payments Survey show that cards have continued to be the most widely used consumer payment method in Australia. Debit cards were particularly popular, with one in every two consumer payments made using a debit card.
We also found that lower income households rely more on debit cards and cash, while high income households use credit cards more often.
In addition, younger consumers continued to use cards most intensively. Our respondents, aged 18 to 29, made around 80 per cent of their payments using cards, compared with around 60 per cent of those aged 65 and over.
Interestingly, Australian consumers continue to predominantly use cards for transactions of all sizes in 2025, even for small transactions under $10 that historically were made using cash.
Not surprisingly, the adoption of mobile wallets continued to increase across all age groups. 43 per cent of consumers used a mobile device to make a contactless payment during the diary week, and that was up from 35 per cent in our 2022 survey.
Discover all these findings and more in the May 2026 Bulletin article – Consumer payment Behaviour in Australia.
Abstract
Results from the RBA’s 2025 Consumer Payments Survey show that cards have continued to be the most widely used consumer payment method in Australia. In 2025, cards were used for most in-person payments, including for small transactions that historically were made mostly with cash. Cash use for everyday transactions was stable relative to the 2022 survey. Mobile wallet use increased across all age groups, as well as consumer adoption of account-to-account payment methods, particularly PayID.
Introduction
The RBA conducted its seventh Consumer Payments Survey (CPS) from October to early December 2025. This article considers the results of the survey, with a particular focus on electronic payment methods. MacGibbon, Royters and Wang (2026) summarise the results on cash usage, including trends in cash payments since the 2022 survey, the demographics of cash use, reasons for using cash and the accessibility of cash services for Australians.
Survey methodology
Participants in the 2025 CPS recorded every transaction they made for seven days in a payments diary and provided extra information on their payment preferences and attitudes in a post-survey questionnaire. The CPS provides unique insights into Australian consumers’ payments behaviour and their changing preferences via both qualitative questions and quantitative analysis of the payments diaries. For the 2025 CPS, around 1,200 people completed the survey and recorded around 14,000 transactions.
The payments diary captured detailed information on every transaction that a consumer made in a week. The information included:
- the payment method – for example, debit card, credit card, cash or bank transfer
- the payment location – whether in-person or online
- the execution of the payment method – for example, by inserting a card into the terminal, or tapping a physical card or mobile device
- the payment purpose – for example, supermarket, household bills, leisure or transport.
The sample was collected to ensure it was representative of the Australian population across a range of demographics, including respondent age, sex, geographical location and household income.
Results overview
The results suggest that the way Australians make payments has broadly stabilised following a period of heightened adoption of electronic payment methods, which coincided with the COVID-19 pandemic. While longer run trends of increased adoption of electronic payments remained evident, changes in payment shares across methods were small.
Cash use stabilised to around 15 per cent of payments, compared with 13 per cent in the 2022 survey (Table 1). The share of payments made using cards declined, while the use of internet banking to make account-to-account payments increased. Other payment methods, including BPAY, PayPal and ‘buy now, pay later’ (BNPL) services, remained broadly stable as a share of total payments. Cheque use continued to decline and was negligible, accounting for 0.02 per cent of all payments.
| 2007 | 2010 | 2013 | 2016 | 2019 | 2022 | 2025 | |
|---|---|---|---|---|---|---|---|
| Cash | 69 | 62 | 47 | 37 | 27 | 13 | 15 |
| Card | 26 | 31 | 43 | 52 | 63 | 76 | 73 |
| – Debit cards | 15 | 22 | 24 | 30 | 44 | 51 | 49 |
| – Credit and charge cards | 11 | 9 | 19 | 22 | 19 | 26 | 23 |
| BPAY | 2 | 3 | 3 | 2 | 2 | 2 | 2 |
| Internet/phone banking(b) | – | 2 | 2 | 1 | 3 | 3 | 4 |
| PayPal | – | 1 | 3 | 3 | 2 | 2 | 2 |
| Cheque | 1 | 1 | 0.4 | 0.2 | 0.2 | 0.1 | 0.02 |
| Other(c) | 1 | 1 | 2 | 1 | 1 | 2 | 2 |
|
(a) Excludes payments over $9,999, transfers (payments to family and friends),
transport cards and automatic payments. Total may not sum to 100 due to
rounding. Sources: RBA calculations, based on data from Colmar Brunton, Ray Morgan Research and Ipsos. |
|||||||
Card payments
The 2025 CPS shows that electronic payments, particularly cards, continue to be the most common payment method for Australian consumers. This reflects the longer run shift towards more convenient payment technologies, which was accelerated by changes in consumer payment behaviour during the COVID-19 pandemic. Card payments offer fast and convenient contactless functionality, reduce the need for consumers to hold cash, benefit from widespread merchant acceptance, and have adapted to innovations in the payments ecosystem, including the ability to store cards in mobile wallets.
The share of payments made using cards declined from 76 per cent in 2022 to around 73 per cent in 2025 (Graph 1). This reflected a stabilisation in cash use over the period, following increased use of electronic payment methods over the COVID-19 pandemic.
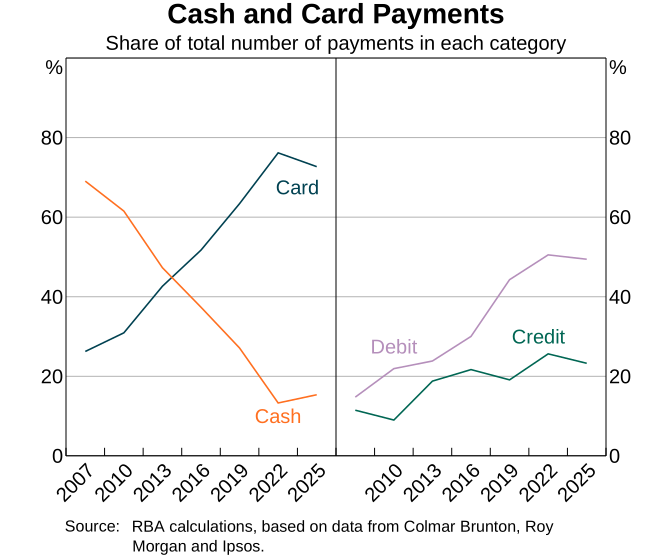
The decline in card usage mostly reflected a decrease in credit card use, along with a slight reduction in debit card use. Since the CPS was first conducted in 2007, consumers have steadily increased their use of debit cards. Debit cards now account for around half of all payments, more than three times their share in 2007. This increase has been supported by the expansion of debit card functionality, including contactless payments, online payments and compatibility with mobile wallets. Growth in credit card usage since 2007 has been more moderate, with credit cards accounting for around one-quarter of payments in recent surveys. The stronger uptake of debit cards partly reflects consumers’ preferences to use their own funds rather than borrowed funds, as well as a decline in the perceived attractiveness of credit card reward schemes in recent years.
Cards remained the dominant payment method across all age and income groups, despite card use having stabilised relative to 2022 (Graph 2). Younger consumers continued to use cards most intensively, with those aged 18–29 years making around 80 per cent of their payments using cards, compared with around 60 per cent for consumers aged 65 years and over. In the 2022 CPS, there was a pronounced increase in card use among consumers aged over 40 years. While these consumers have historically been the most intensive users of cash, the increase in 2022 largely reflected their greater use of cards for low-value transactions. Although card use declined slightly across all age groups in 2025, card usage among older consumers remained well above pre-pandemic levels, suggesting a more persistent shift in payment preferences for this cohort.
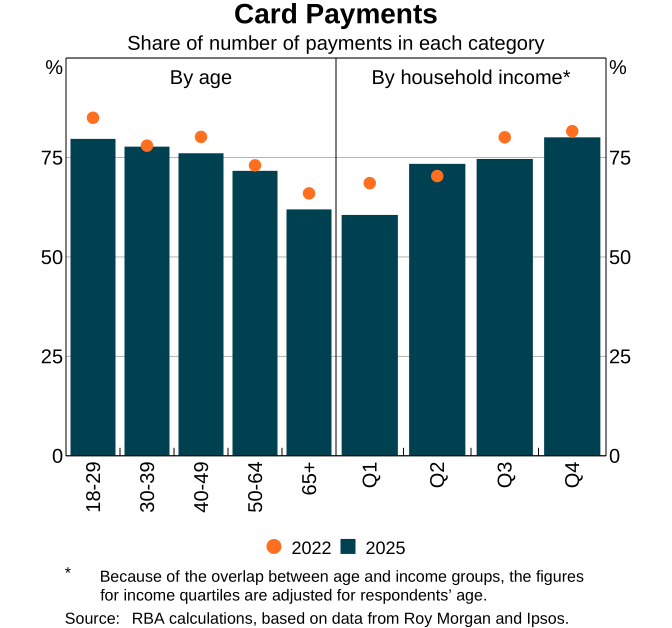
Consumers with higher household incomes were more likely to use cards to make payments (Graph 2). Card use among consumers in the lowest household income quartile declined to around 60 per cent, returning to around its pre-pandemic level in 2019 (Nguyen and Watson 2022). Card use among consumers in the highest household income quartile remained high at around 80 per cent of their payments.
Consumers from lower income households used debit cards and cash for a larger share of their payments than those from higher income households (Graph 3). Consumers in the lowest income quartile used debit cards for around 53 per cent of their transactions, compared with around 44 per cent among those in the highest income quartile.
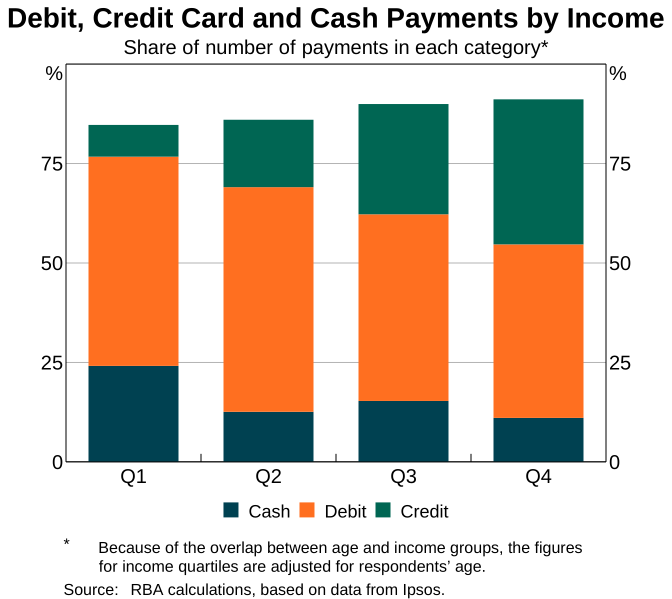
Higher income households made greater use of credit cards. Consumers in the highest income quartile used credit cards for over one-third of their transactions, more than four times the share for consumers in the lowest income quartile (around 8 per cent). These differences are consistent with higher income households being more likely to be eligible for credit card products. In addition, higher income households may be more strongly incentivised to use credit cards through product features such as rewards programs. Among respondents who held a credit card, around 80 per cent of those in the highest income quartile reported having a rewards credit card, compared with around 43 per cent of respondents in the lowest income quartile.
Cards were the predominant payment method used when making payments at most types of businesses in 2025 (Graph 4, top panel). Cards accounted for more than three-quarters of payments at supermarkets, food retailers, transport and holiday-related businesses, and petrol service stations. Card usage was lowest for household bills, where consumers tended to rely on lower cost electronic payment methods such as bank transfers and BPAY.
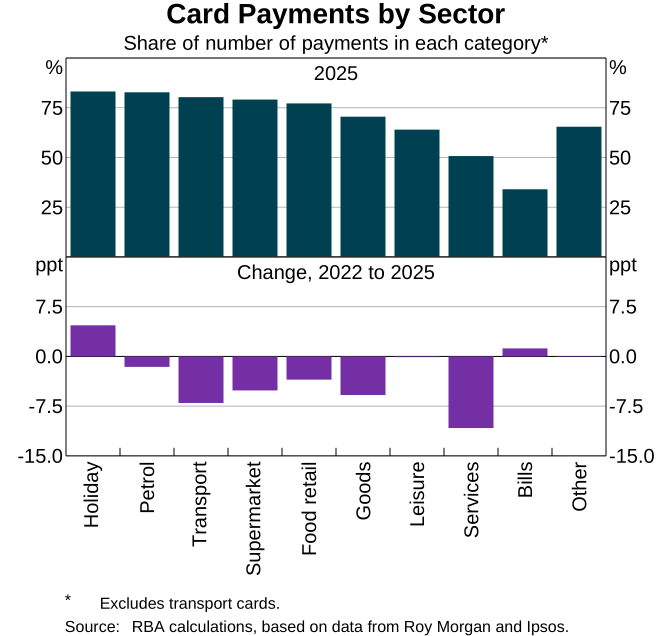
Since 2022, the share of payments made using cards has declined across most types of businesses (Graph 4, bottom panel). This decline was evident across a broad range of sectors, with the main exceptions being holiday-related spending and household bills, where card usage was little changed or increased modestly. The reduction in card use at some businesses may partly reflect greater use of alternative payment methods, such as account-to-account payments like PayID, as well as increased surcharging on card payments over this period. Despite this recent moderation, card use remained high across all sectors in 2025 and well above pre-pandemic levels observed in 2019 (Nguyen and Watson 2023). Cards continued to account for a large share of payments at supermarkets and food retailers, including cafés, pubs and takeaway food outlets, consistent with the longer run shift away from cash for frequent, low-value transactions.
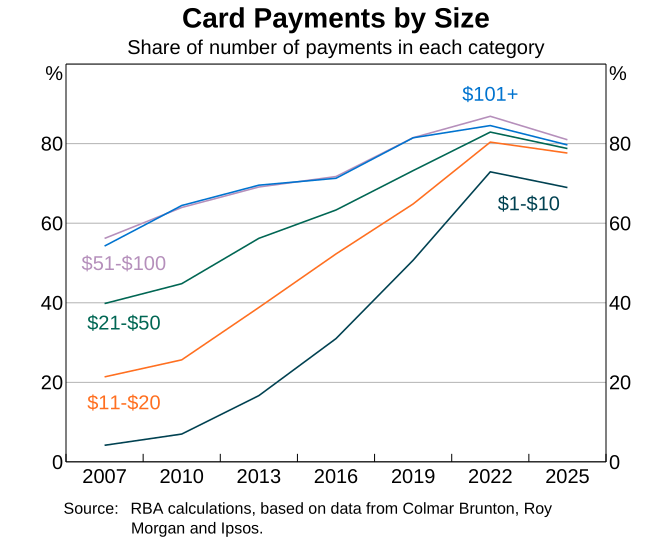
Australian consumers continued to predominantly use cards for transactions of all sizes in 2025 (Graph 5). The decline in card use relative to 2022 occurred broadly across transaction value ranges. Card use for low-value transactions under $10 – historically the transactions least likely to be made using cards – remained high, with cards used for around 70 per cent of these payments. For transactions above $10, card usage had largely converged across value buckets, with cards accounting for around 80 per cent of payments irrespective of transaction size. These patterns are consistent with the continued high use of cards at food retailers, such as cafés and takeaway outlets, which comprise a large share of low-value payments.
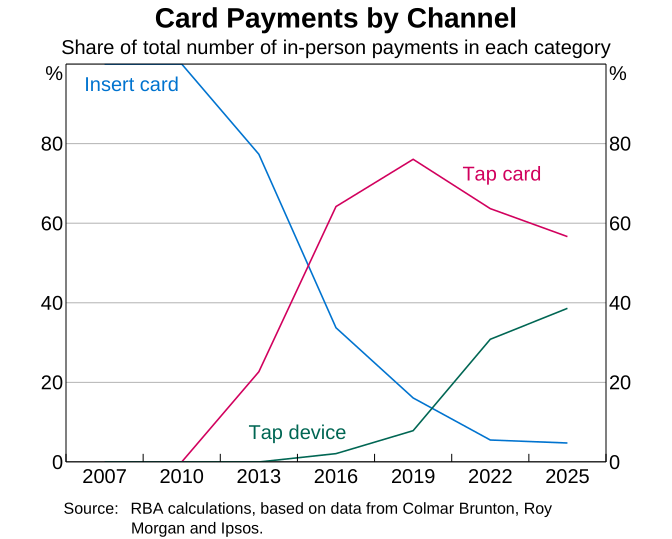
The use of device-based payment methods, such as mobile wallets, increased further in 2025 (Graph 6). Device-based payments accounted for around 40 per cent of card payments, up from 31 per cent in 2022. This increase largely reflected a decline in the share of payments made by tapping cards, which declined by 7 percentage points over the same period. The share of payments made by inserting cards was little changed at around 5 per cent.
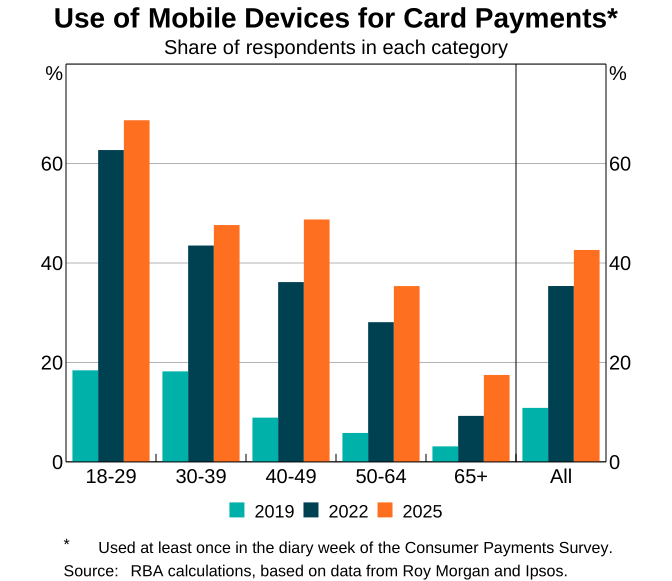
In the 2025 CPS, the adoption of mobile wallets (such as Apple Wallet, Google Wallet and Samsung Wallet) continued to increase across all age groups with 43 per cent of consumers using a mobile device to make a contactless payment during the diary week, relative to 35 per cent in 2022 (Graph 7). This increase occurred following a sharp increase in mobile wallet adoption between 2019 and 2022.
Mobile wallet use remained more prevalent among younger consumers. Over half of respondents aged under 50 years used a mobile device to make a payment during the diary week. Nonetheless, respondents aged 65 years and over recorded the largest relative increase in mobile wallet use, doubling to around 19 per cent relative to 2022.
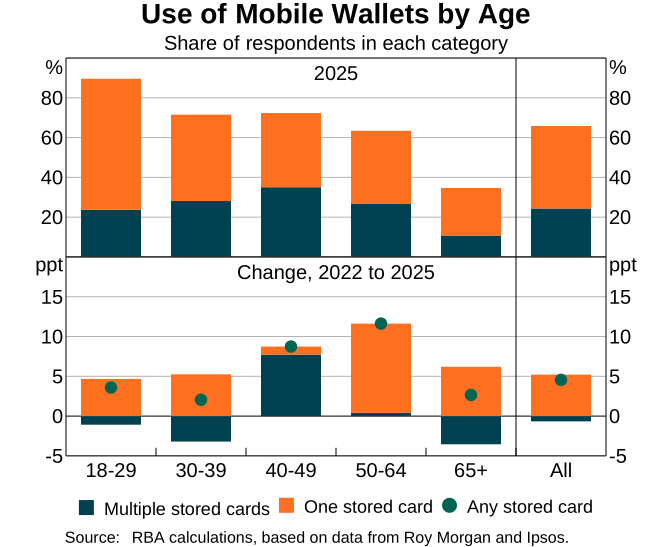
As in 2022, consumers were more likely to have a single card stored in a mobile wallet than multiple cards (Graph 8, top panel). The increase in mobile wallet adoption since 2022 was driven by growth in single-card wallets (Graph 8, bottom panel).
The likelihood of holding multiple cards in a mobile wallet varied across age groups. Respondents aged 40–49 years were the most likely to have multiple cards stored in a mobile wallet. This pattern is consistent with the age cohort holding a larger number of cards, with respondents in this age group holding two cards each on average.
Online payments
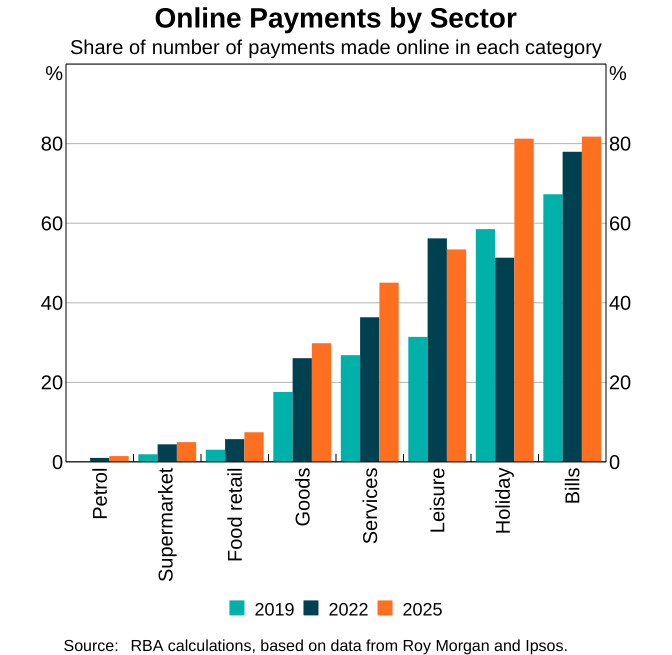
Online payments accounted for a larger share of retail payments in 2025 than in 2022, comprising around 20 per cent of all consumer payments (Table 2), relative to 18 per cent in 2022 and only 4 per cent in 2007. This increase reflects a continued adoption of e-commerce, with online purchasing remaining prevalent following the removal of pandemic-era restrictions and associated stabilisation in payment behaviour. Except for leisure-related spending, the share of payments made online increased across all categories between 2022 and 2025 (Graph 9).
| 2007 | 2010 | 2013 | 2016 | 2019 | 2022 | 2025 | |
|---|---|---|---|---|---|---|---|
| BPAY/internet banking | 2 | 4 | 5 | 4 | 4 | 5 | 5 |
| Credit cards | 1 | 1 | 3 | 3 | 2 | 4 | 4 |
| Debit cards | 0 | 1 | 2 | 3 | 4 | 6 | 7 |
| Other(a) | 0 | 1 | 3 | 4 | 2 | 3 | 4 |
| Total | 4 | 7 | 13 | 14 | 12 | 18 | 20 |
| Mobile/app as a share of online payments(b) | – | – | 6 | 20 | 40 | 37 | 46 |
|
(a) ‘Other’ methods include PayPal, prepaid, gift and welfare cards, and
BNPL services. Sources: RBA calculations, based on data from Colmar Brunton, Roy Morgan and Ipsos. |
|||||||
The increase in online payments reflected small increases in the use of debit cards and other payment methods, including PayPal and BNPL services. Payments made through mobile apps accounted for a larger share of online payments in 2025, rising to almost half of all online payments, consistent with broader changes in consumer preferences and the increased use of mobile devices for making payments.
Consistent with an increased adoption of online commerce, 68 per cent of respondents made at least one online payment during the diary week in 2025, up from 64 per cent in 2022. The use of online payments also varied substantially across types of goods and services. Purchases such as petrol, supermarket items and food retail – which are often less convenient or more costly to obtain online – continued to account for a relatively small share of online payments. By contrast, more than 80 per cent of holiday-related purchases, such as accommodation, were made online in 2025, well above the shares recorded in 2019 and 2022.
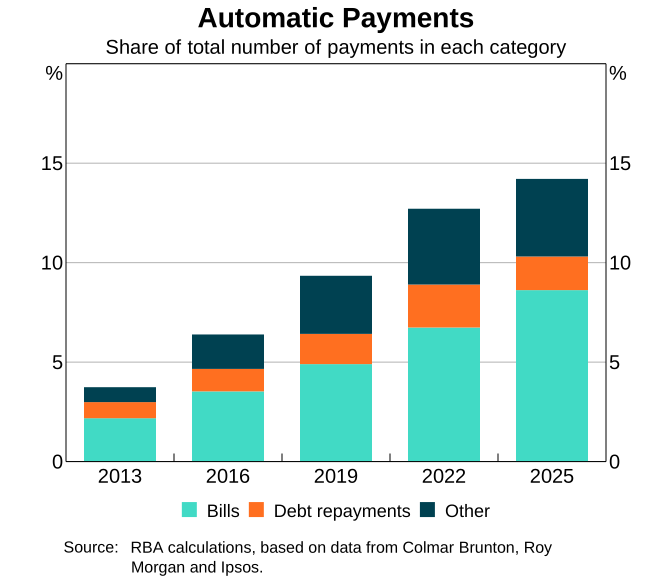
The figures in Table 2 refer to online payments that participants initiated and completed during the diary week. The CPS also collects information on automatic payment arrangements, such as household bills paid by direct debit (e.g. rent or electricity), recurring debt repayments like mortgage and credit card bills, and other recurring payments charged to cards such as subscription services. These arrangements are set up ahead of the payment occurring and are recorded separately through a post-diary questionnaire, with participants referring to their bank statements when reporting this information.
The share of payments made automatically during the diary week has increased steadily over recent years to around 14 per cent of all transactions in 2025 (Graph 10). This reflects changes in how consumers pay for regular expenses, including a greater use of automatic bill payments and subscription services. In 2025, around 70 per cent of household bill payments were made automatically, a 6-percentage-point increase from 2022 and more than three times the share in 2013. This shift towards automatic payments for certain types of transactions is consistent with a stronger consumer preference for more convenient payment methods.
Other payment methods
In recent years, a range of alternative payment methods – beyond cash, cards and traditional bank transfers – have emerged and expanded in Australia. Many of these payment methods use the same or similar underlying payment infrastructure as existing methods but offer additional features, such as faster processing or increased convenience.
Knowledge and adoption of most alternative payment methods was little changed between the 2022 and 2025 surveys (Graph 11).1 PayID was the exception, recording strong growth in awareness and use. In 2025, around 80 per cent of respondents reported being aware of PayID, an increase from 57 per cent in 2022. Around 50 per cent of respondents reported having used PayID in the prior year, compared with 32 per cent in the 2022 survey.
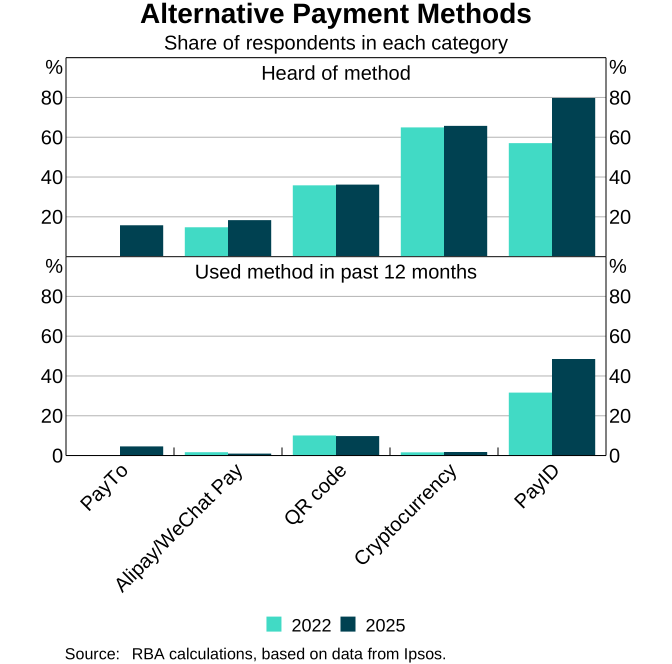
Awareness of cryptocurrency remained relatively high in 2025, with 66 per cent of respondents reporting familiarity with the technology as a payment method, although this may reflect more general awareness. Usage remained limited, with only around 2 per cent of respondents reporting having used cryptocurrency to make a payment in the past year. Cryptocurrency was one of the least commonly used alternative payment methods in the survey.
QR code payments, which have seen widespread adoption in some southeast Asian countries, such as Indonesia,2 also recorded little change in adoption in Australia in 2025. While awareness was modestly higher relative to previous surveys, uptake remained low with 10 per cent of respondents having used QR codes to make payments in the prior year. This is consistent with feedback from payments industry stakeholders indicating that Australian consumers place a high value on convenience when making payments, with QR-based payments often perceived as less convenient than contactless ‘tap-and-go’ card payments.
Awareness of Alipay and WeChat Pay, Beem and PayTo (a New Payments Platform (NPP) service that enables pre-authorised, account-to-account payments initiated by the merchant) remained low in 2025 at below 20 per cent. Usage of these payment methods was also low, with fewer than 5 per cent of respondents reporting having used each of these methods in the past year.
PayID
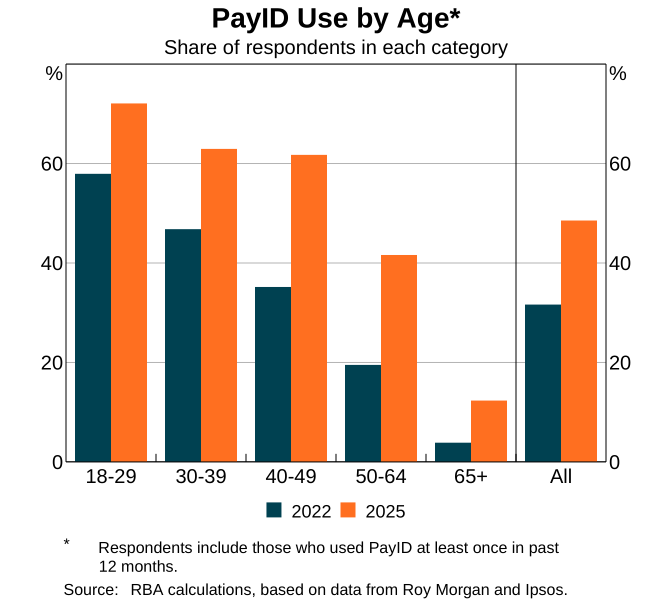
PayID is a payments service that allows consumers to make payments using a mobile phone number, email address or Australian Business Number (ABN), rather than entering bank account details. PayID also provides the recipient’s name prior to payment, which can help reduce the risk of misdirected payments and fraud. PayID was introduced in 2018 as part of the NPP. Use of PayID increased by 18 percentage points in 2025, with around 50 per cent of respondents reporting having used PayID at least once in the past year.
PayID use increased among all age groups (Graph 12). Younger consumers aged 18–29 years remained the most likely to use PayID, with 72 per cent reporting use in the past year. However, much of the increase in adoption since 2022 reflected greater uptake among older consumers. In particular, the share of respondents aged 65 years and over who reported using PayID more than tripled over this period.
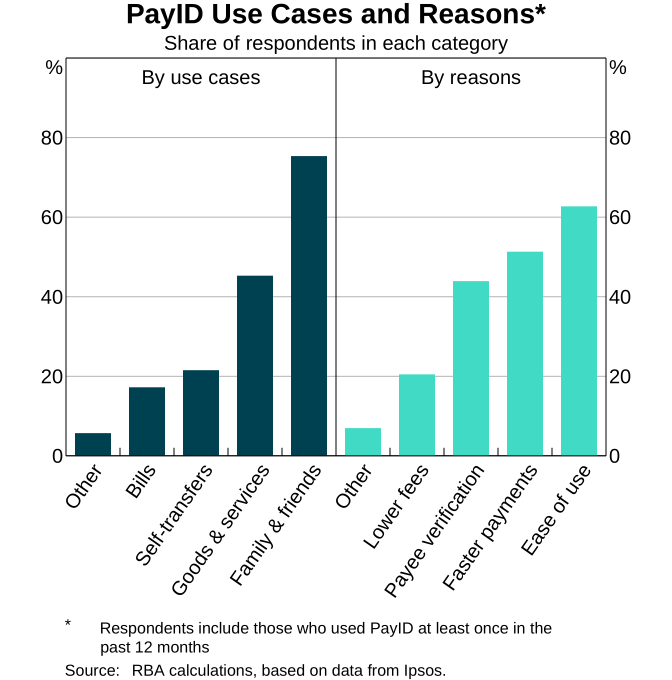
Most respondents reported using PayID for transfers to family and friends (Graph 13, left panel). Around 45 per cent of respondents who had used PayID in the prior 12 months used the service to make payments for goods and services, consistent with increased adoption of this payment method as a substitute for other consumer-to-business payment methods.
Most consumers used PayID for its simplicity and faster transfer speed (Graph 13, right panel). Payee verification was also a common reason for use. The ability to confirm the name of the recipient prior to payment can reduce the risk of misdirected payments and fraud. A similar name-checking function has also begun rolling out to participating banks from July 2025 through Confirmation of Payee for account-to-account transfers. Around 20 per cent of respondents also cited lower fees as a reason for using PayID, which may reflect the presence of surcharges on some other payment methods, particularly card payments.
PayTo
The 2025 CPS asked consumers about their use of PayTo, a service available through the NPP that allows consumers to pre-authorise merchants to draw payments from their bank accounts. PayTo provides consumers with greater control over their payment arrangements relative to direct debits, including greater visibility over payment details and the ability to pause or cancel authorisations. The service can be used for both one-off payments and for ongoing payments, such as subscriptions.
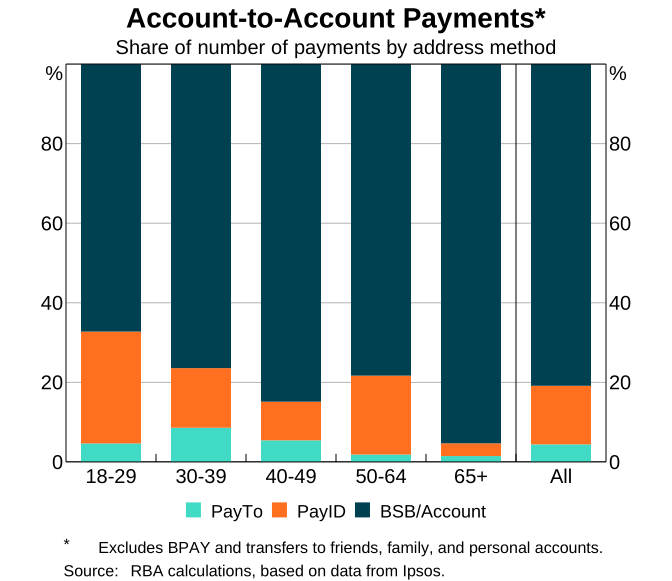
PayTo was not widely used by consumers in the 2025 CPS, accounting for 4 percentage points of account-to-account payments (Graph 14). This was substantially lower than the use of PayID, which accounted for around 15 per cent of account-to-account payments. As with other emerging payment methods, PayTo was more commonly used by younger consumers.
Among respondents who reported not using PayTo, the most commonly cited reason was that existing payment methods were sufficient for their needs, reported by 66 per cent of respondents. A lack of familiarity with how to use PayTo, or not having access to the necessary tools, was also cited by a sizeable share of respondents (36 per cent). Security and privacy concerns were reported by around 22 per cent of respondents, while around 15 per cent indicated that PayTo was not accepted by the merchants they transact with.
Conclusion
The results of the 2025 CPS indicate that consumer payment behaviour has broadly stabilised. Cards have remained the predominant payment method for in-person and online transactions across all transaction sizes. Consumers have continued to shift towards digital forms of payment and consumption, as illustrated by a continued increase in mobile wallet and online payments. Alternative payment methods beyond cash and cards have gained traction, particularly PayID. However, these methods accounted for a small share of total consumer payments.
Endnotes
* The authors are from Payments Policy Department. The authors are grateful for the assistance provided by others in Payments Policy Department and Note Issue Department, in particular Faye Wang, Kieran MacGibbon, and Michelle Royters.
1 PayPal and BNPL were omitted from the 2025 CPS and PayTo was added.
2 See, for example, Juniper Research (2025).
References
Juniper Research (2025), ‘QR Code Payments: Asia Continues to Lead Global Surge in Usage, with Value Reaching $1.2tn by 2029’, available at <https://www.juniperresearch.com/press/qr-code-payments-asia-continues-to-lead-global-surge/>.
MacGibbon K, M Royters and F Wang (2026), ‘Cash Use in Australia: What the 2025 Consumer Payments Survey Tells Us’, RBA Bulletin, April.
Nguyen N and B Watson (2023), ‘Consumer Payment Behaviour in Australia’, RBA Bulletin, June.
Underlying data
This file contains all underlying data that are available for public release. Underlying data