Reserve Bank of Australia Annual Report – 1962 Economic Survey
Developments Abroad and the Australian Balance of Payments
There were important developments abroad in 1961/62—in world trade and payments and in the economic growth of leading industrial countries. In the closing stages of the year Britain's application to join the European Economic Community tended to assume greater importance than other oversea economic events for Australians.
International Developments
World trade continued to expand in 1961/62, and the rate of growth was comparable with the yearly average of the previous decade. Trade between industrial countries increased but their exports to primary producing countries fell slightly. Trade within the E.E.C. countries continued to expand.
The increase in world trade occurred against a background of generally stable prices but the prices of some raw materials and foodstuffs—such as rubber, lead, zinc and sugar—fell. The prices of rural products generally remain weak compared with those of manufactured goods. Negotiations through the General Agreement on Tariffs and Trade to stabilise future wheat prices and arrange for the disposal of agricultural surpluses have, so far, met with little success.
Stability in world markets and the continued growth of world trade went hand-in-hand with further liberalisation of trading conditions, mainly for industrial products. There was progress in the reduction of trade barriers within the E.E.C., and agreement was reached between the E.E.C., the United States of America and Britain on mutual reductions in tariffs on a range of industrial goods. By reason of our membership of G.A.T.T. these reductions will be extended to the very small volume of Australian exports of these goods. A proposal discussed by the United States and the E.E.C. for reductions in tariffs on agricultural products, which might have yielded greater potential benefits for Australian exports, was rejected by the E.E.C.
In the United States, the Trade Expansion Bill was introduced to replace the Reciprocal Trade Act of 1934 and allow the Administration much greater freedom in tariff negotiations. Formation of the Organisation for Economic Co-operation and Development (an enlargement of the former O.E.E.C.) between European nations, Canada and the United States in late 1961 was expected, among other things, to contribute to the liberalisation of trade.
The lowering of trade barriers between industrial countries when wages were generally rising, inspired attempts to become more competitive in world markets. At the same time, arrangements made during the year lent stability to exchange markets. To cope with large movements of short term funds imperilling the balance of payments of the key currency countries, the International Monetary Fund concluded an arrangement with the major industrial countries to make available additional amounts of their currencies to the Fund equivalent to U.S. $6,000 million. Other measures taken include the acquiring of sizeable quantities of foreign exchange by the United States Treasury and the Federal Reserve System for use in foreign exchange operations to reduce the strain on the United States' gold stock. Concerted efforts are also being made to keep prices on the London gold market stable as another defence of the international monetary system. In other ways also the practice of international consultation in monetary matters is being greatly extended.
Economic growth
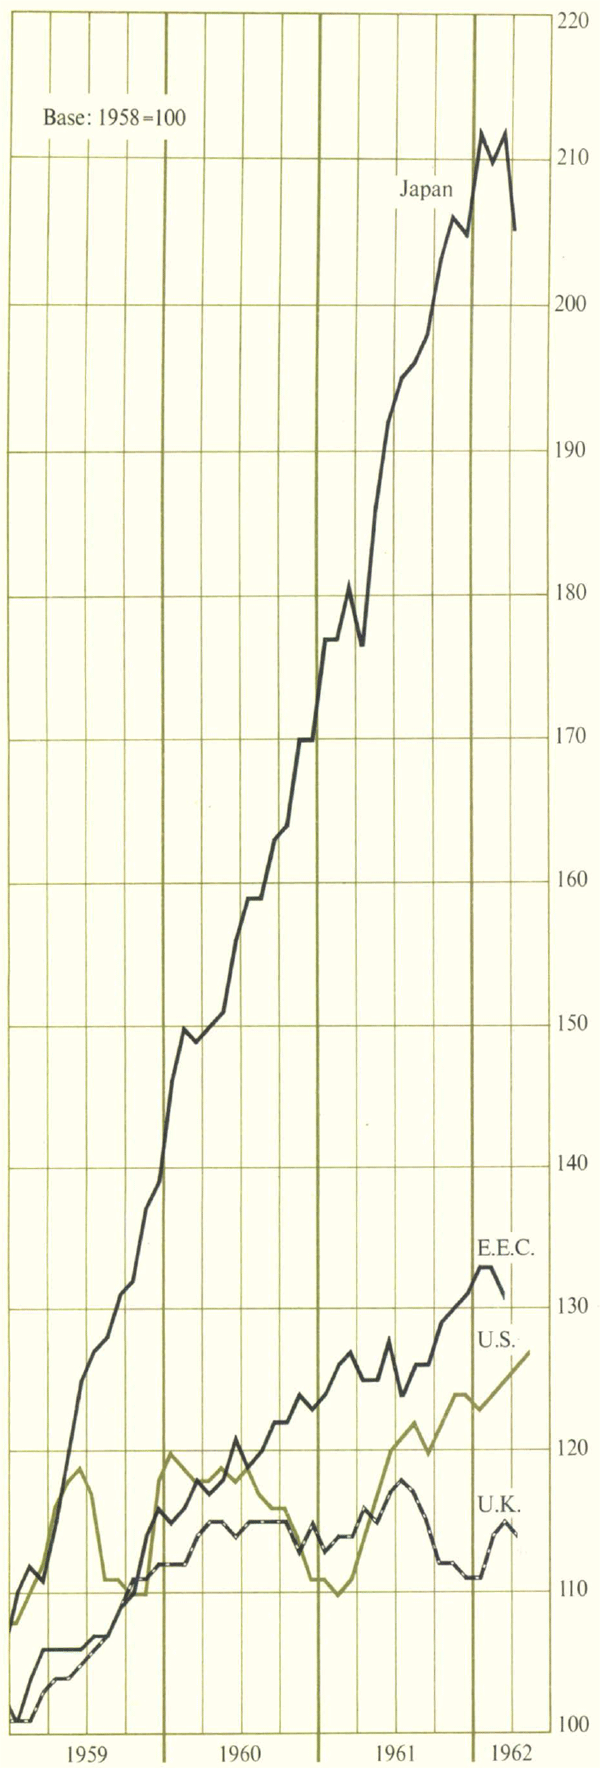
Despite the increase in world trade, there were signs in 1961/62 of a slowing down in the rate of growth of key industrial countries. The pace of expansion in Europe eased and labour shortages and substantial wage increases reduced the competitive power of industry in some countries.
Restrictive action to protect sterling in mid-1961 was followed by a slackening in domestic activity in the United Kingdom. Although there was a substantial improvement in British reserves, and policies were changed—among other measures, Bank Rate was reduced by stages from 7 per cent to 4½ per cent—domestic expansion was slow. The problem of establishing an adequate and continuing rate of growth will be studied by the recently formed National Economic Development Council.
In the United States, the recovery from the 1960 recession slowed down in the second half of 1961. In Japan, a policy of economic restraint has dampened the high rate of domestic expansion.
Indexes of Industrial Production (Seasonally adjusted)
The European Economic Community
The Council of Ministers of the E.E.C. decided in January, 1962, to move to the second stage of the economic integration of the six Common Market countries—France, Western Germany, the Netherlands, Belgium, Italy and Luxembourg. The first stage involved a movement towards inter-country mobility of productive factors, goods and services between members and a step towards a common external tariff. It also required agreement on a common agricultural policy designed to equalise agricultural prices throughout the Community by 1970 and to limit outside competition by means of levies on imports of agricultural products; but actual prices were not set at the time. During the second stage, customs duties between members are to be further reduced and another alignment of external tariffs is to take place. In addition, there is to be a progressive harmonisation of social, monetary and fiscal policies.
In negotiating to join the European Economic Community, the United Kingdom has raised three main issues: the position of British agriculture in the Community; the safeguarding of the interests of the Commonwealth; and the possibility of nil tariffs on a number of goods imported into an enlarged Community including the United Kingdom. Relations with her partners in the European Free Trade Area are being borne in mind. In April, 1962, the Australian Government was given the opportunity to explain to the Committee of Deputies of the E.E.C. the effect on Australian exports of British accession to the E.E.C.
Australia's Balance of Payments
There was the smallest deficit for five years in Australia's current balance of international payments for 1961/62. A high level of rural production helped exports to rise to a record figure and imports fell heavily from the high level of 1960/61. This resulted in a substantial trade surplus which was nearly sufficient to offset the balance of all other current payments.
Net private capital inflow (including the balancing item) was also much lower and, in fact, lower than it had been for seven years. The fall was due largely to short term movements associated with trade receipts and payments. However, with the capital inflow and a near balance on current account, gold and foreign exchange holdings rose throughout most of the year although in March, 1962, the I.M.F. drawing of £78 million was repaid. Gold and foreign exchange holdings rose by £10 million over the twelve months to June, 1962.
| Australian Balance of Payments (£A million) | 1959/60 | 1960/61 | 1961/62 |
|---|---|---|---|
| Exports | + 937 | + 936 | + 1,080 |
| Imports | − 946 | − 1,084 | − 893 |
| Trade balance | − 9 | − 148 | + 187 |
| Net invisibles | − 245 | − 259 | − 229 |
| Import valuation adjustment | + 30 | + 38 | + 34 |
| Current account balance | − 224 | − 369 | − 8 |
| Capital—I.M.F. drawings | + 78 | − 78 | |
| —Other official | + 29 | + 4 | + 4 |
| —Private (including balancing item) | + 191 | + 326 | + 92 |
| Change in reserves | − 4 | − 39 | + 10 |
Exports
The value of Australian exports reached a record level £102 million higher than the previous peak in 1956/57. A greater volume of exports was mainly responsible for the increase.
Average wool prices were about 4 per cent higher than in 1960/61 on a clip that, at a record 1,700 million lb, was 68 million lb higher. The pace in the wool market was again set by Japan which, despite domestic pressure to reduce imports in general, took about 30 per cent of total wool exports.
Wheat exports reached a record level due mainly to further heavy purchases by China and a strong demand from Spain, India and West Germany. Shipments to China were valued at £49 million compared with £25 million in 1960/61. Australian wheat sold to China in 1961/62 was on credit terms; 10 per cent to be paid on shipment, 40 per cent six months after shipment and the remainder twelve months after shipment. The impact in world markets of Chinese buying during the last two years has raised world wheat prices generally and surplus stocks of wheat have been reduced, particularly in Canada and Australia.
Sharp increases in production made it possible for greater quantities of beef and veal and butter to be shipped abroad.
Japanese buying was mainly responsible for a rise in shipments of coal and there was an increase in exports of iron and steel to various countries to a record level of £43 million. Exports of other manufactured products contributed very little to the increase in total exports and, in fact, exports of some items were lower than in 1960/61.
Important changes have taken place in the relative importance of various oversea markets for Australian exports. Japan in particular has been buying a larger share of our exports, mainly wool and minerals in recent years. Because of her wheat imports, China has also been an important market.
The relative importance of the United Kingdom market has been declining for some time. In the period 1950/51 to 1954/55 a little over 35 per cent of our exports was sold to the United Kingdom, but in the last two years the proportion was only 20 per cent. There has also been a fall, although not as great, in the last few years in the proportion of our exports sold to countries of the E.E.C.
With the better trading year and the generally higher oversea demand for Australian products, export prices were, on average, about 3 per cent higher than in the previous year. This increase was mainly the result of the improvement in wool prices. Wheat prices were also higher but prices of most other major export commodities fell. Import prices did not change much in 1961/62. For the year as a whole, therefore, the terms of trade moved a little in Australia's favour. However, they were still considerably less favourable than in most of the postwar years.
Imports
The sluggish recovery of domestic demand during the first half of the year, accompanied by a running down of stocks, reduced imports in 1961/62 by a substantial amount.
After reaching an annual rate of flow of £1,140 million in the third quarter of 1960/61, imports fell sharply. The downward trend continued so that the annual rate of flow had fallen to as low as £800 million in the quarter ended December, 1961. However, the trough appears to have been reached towards the end of 1961 and imports began to rise in the early months of 1962.
Because of the lags involved, the Government's measures to stimulate economic activity, taken in February, would not have caused the increase in the rate of importing. The rise to an annual rate of flow of £915 million in the March quarter can be attributed to normal usage and the replenishment of stocks. Towards the end of the year, however, the measures may have had some effect, and in the final quarter of 1961/62 imports were coming in at an annual rate of £975 million. The total of imports for the year was £893 million, £191 million less than in the year before.
The fall in imports was spread over the whole range of imported goods. However, the largest falls were in imports of producers' materials. In particular, imports of motor vehicle components, iron and steel, and other metals and metal manufactures fell very sharply. Imports of finished goods, particularly consumer goods, were affected much less by the reduction in local demand. The more recent rise in imports followed the same pattern and was mainly in producers' materials.
Net invisible payments were £30 million lower than in 1960/61 mainly as a result of the smaller amounts of freight paid on the lower import bill and higher earnings on international reserves.
Current and capital accounts
The net result of all current account transactions was a deficit of £8 million. There had been deficits of £369 million in 1960/61 and £224 million in 1959/60. The 1961/62 deficit was the best result since 1956/57 when there was a surplus of £115 million.
The improvement in the balance of payments made it possible to repay the 1961 drawing from the I.M.F. of U.S. $175 million; earlier, the standby credit of U.S. $100 million (£A45 million) arranged at the same time as the drawing, had been cancelled without being drawn. The repayment returned Australia's “second line reserves”, in the form of drawing rights on the I.M.F., to their full strength. Following the small increase in Australia's gold subscription to the I.M.F., referred to later in this report, these “second line reserves” now amount to U.S. $474 million (£A212 million).
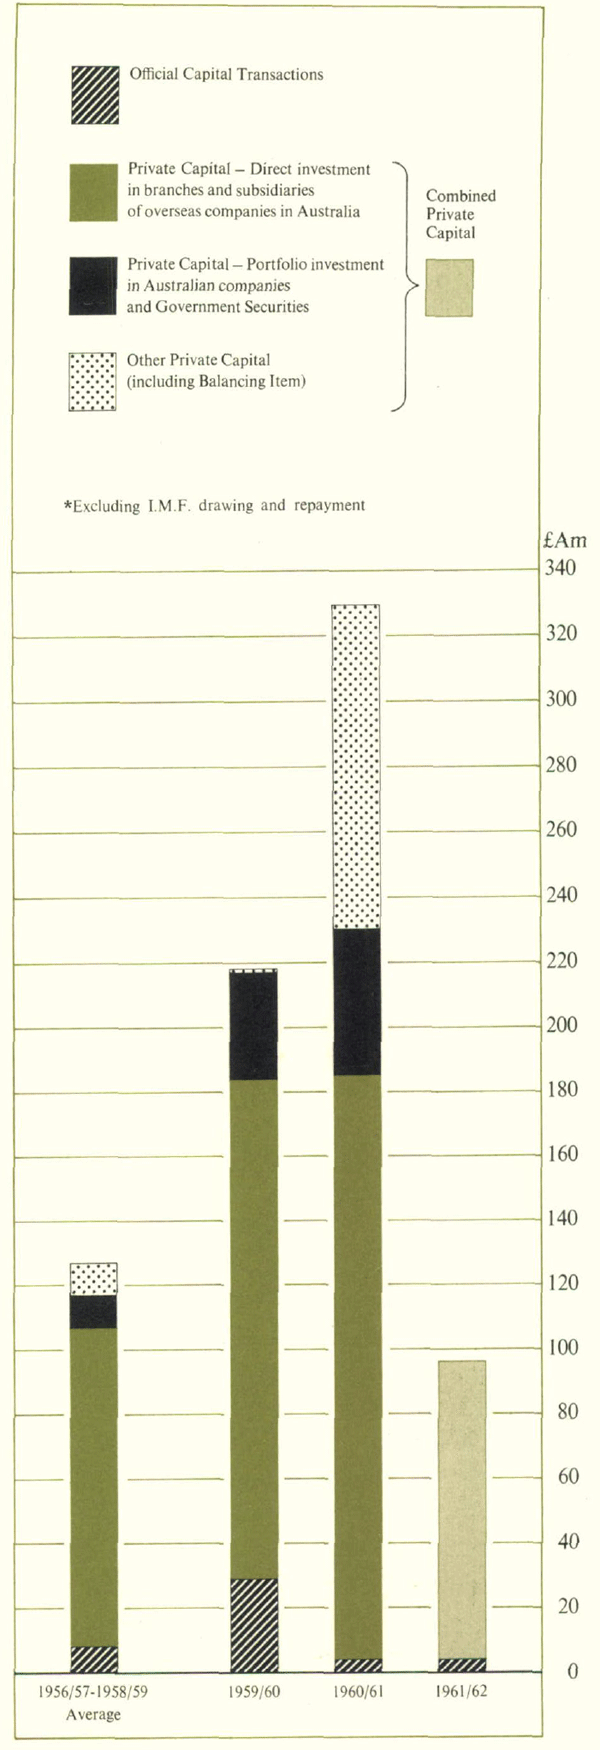
Net Capital Inflow (£ million)*
The Australian Government negotiated loans overseas in 1961/62, for a total of £A63 million. The loans were raised in the Netherlands and in New York and from the International Bank for Reconstruction and Development. The Netherlands loan, from which the proceeds of £A5 million were received in the first half of the year, was the first official borrowing by Australia among the countries of the European Economic Community. No drawings were made on the I.B.R.D. loan nor were the proceeds of the New York loan received before the end of the year. Proceeds from loans previously arranged, including a loan on behalf of Qantas Empire Airways Ltd., amounted to £A23 million. In addition, a maturing New York loan was refinanced in February except for the equivalent of about £A4 million. Repayments of I.B.R.D. and other loans amounted to £A17 million.
There were several other transactions with international organisations during the year. Because of the increase in our holdings of gold and convertible currencies during the I.M.F. year ending 30th April, Australia was required to increase her previous gold subscription to the I.M.F. by a further £0.7 million. Australia also made available a further £3 million of her national currency subscription to the I.B.R.D.'s capital for use in the Bank's lending programme. In addition, the Government subscribed U.S. $4 million (£A1.8 million) to a special issue of United Nations bonds.
Overall, there was an official capital outflow of £74 million; there had been an inflow of £82 million in 1960/61 and of £29 million in 1959/60.
In contrast to the record level of £326 million in 1960/61, net private capital inflow (including the balancing item) in 1961/62 amounted only to £92 million. After reaching abnormally high levels in the second half of 1960/61, the rate of inflow fell sharply and, during the December quarter, there was even a small net outflow. Capital inflow recovered slowly in the second half of 1961/62 and at the end of the year approached the levels of earlier years. The low level of net capital inflow largely reflected the repayment of the short term import credits and other private short and medium term borrowing abroad which inflated capital inflow in 1960/61. Another factor was the short-term capital outflow of over £30 million in credit extended to China for the financing of her wheat purchases from Australia. Although the slackness in the economy may have discouraged some investment by oversea interests, there was evidence to suggest that long term oversea investment in Australia continued at a high level.
Current outlook
The short term factors which reduced capital inflow during the last year are unlikely to be important in 1962/63 and, with continuing long term investment, a rise in the immediate future seems likely.
There is also likely to be a rise in imports which were already growing at the end of 1961/62. This was consistent with the recovery which had been taking place in domestic demand. Export prospects are good but there may be a reduction in the trade surplus in 1962/63. However, reserves seem adequate to meet any likely contingencies in the year to come.
In the long term, the prospects for non-wool exports from Australia will be affected by the outcome of Britain's negotiations for entry into the European Economic Community. Whatever the outcome of the negotiations, export expansion calls for a wider diversification of exports and the building up of new markets.
Gold and Foreign Exchange Holdings
Australia's net gold and foreign exchange holdings rose by £10 million over 1961/62, after providing for the £78 million repayment to the I.M.F. At the end of June, 1962, our holdings stood at £561 million; central reserves totalled £509 million and working balances £52 million.
|
End of June |
Gold |
Dollars |
Sterling securities |
Sterling and other foreign exchange |
Total |
|---|---|---|---|---|---|
| 1958 | 65.8 | 27.0 | 43.8 | 388.8 | 525.4 |
| 1959 | 60.2 | 32.0 | 34.7 | 389.5 | 516.4 |
| 1960 | 66.5 | 42.6 | 44.1 | 358.8 | 512.0 |
| 1961 | 69.2 | 31.0 | 33.0 | 417.6 | 550.8 |
| 1962 | 79.2 | 34.5 | 32.9 | 414.6 | 561.2 |
ECONOMIC CONDITIONS IN AUSTRALIA
Australian demand for goods and services regained some strength in 1961/62. A falling trend in expenditure had become apparent towards the end of 1960/61 but this was checked in the first half of 1961/62 by a sharp increase in the demand of public authorities. The Loan Council programme for the year had been increased and the Commonwealth Government's budget provided for higher expenditure. The budget provided also for some reductions in sales tax and a cash deficit, but private demand responded to the stimulus only with a substantial time-lag. Indeed, it was not until the March quarter of 1962 that domestic expenditure (excluding stocks) again reached the level of the same quarter of 1961.
In January, 1962, unemployment reached a seasonal peak and the highest level for many years and additional measures were taken by the Commonwealth Government in February to expedite the recovery which, by then, had begun in some sectors but had yet to appear in others. Provision was made for further increases in public expenditure; reductions in both sales tax and income tax were announced; and some longer term measures introduced. By this time, also, stocks had been reduced and in the following months expenditure and employment strengthened. There were successive reductions in unemployment but a large number of unemployed applicants for positions were still registered with the Commonwealth Employment Service at the end of the year.
Gross domestic expenditure
Personal consumption expenditure rose at a very moderate rate in the first six months of the year. The slow rate was partly due to falling prices for some consumer goods. Retail sales had been weak in the first half of the year but in the second half began to move upwards. Outlay on other consumption items also rose so that personal consumption expenditure increased more in the second half.
Expenditure on private fixed investment had been falling towards the end of 1960/61, and the fall continued into 1961/62. After December, with returning confidence reinforced by expansionary fiscal measures, the renewed growth of some forms of investment became apparent.
Changes in Non-Farm Stocks (£ million)
Private expenditure on new dwellings, after falling steadily for the nine months to September, increased slowly over the second half of the year. Total expenditure on new dwellings followed the same course. Special measures were taken to assist home building; the Commonwealth Government gave substantial assistance under the Commonwealth and State Housing Agreement, through both State housing authorities and building societies, and the banks endeavoured to maintain the flow of housing finance. Expenditure was slow to respond to these measures and in February the Loan Council approved an increase in the borrowing programme for housing. At the same time, several important lenders increased their maximum loans for housing. As the second half of the year progressed, the demand for housing showed more signs of recovery.
| Finance for new housing | 1959/60 | 1960/61 | 1961/62* |
|---|---|---|---|
| Number of loans/contracts ('000) | 60.4 | 57.0 | (57.0) |
| Amount of finance (£ million) | 162.2 | 155.5 | (159.0) |
| Includes building contracts let by Government housing authorities and loans
approved by trading banks, savings banks, major life offices, the Commonwealth
War Service Homes Division and certain building/housing societies (including
some of those financed under the Commonwealth and State Housing Agreement) *Estimate |
|||
Non-residential building which slackened at the beginning of the year, was picking up in the second half. Commercial building afforded the main support.
Sales of new motor vehicles rose strongly after December and were further stimulated by reductions in sales tax in February; for the year as a whole, however, registrations of new motor vehicles were lower by 5 per cent than in the previous year. Investment in other capital equipment was inclined to be hesitant. Rural investment was maintained over the year at much the same level as in 1960/61.
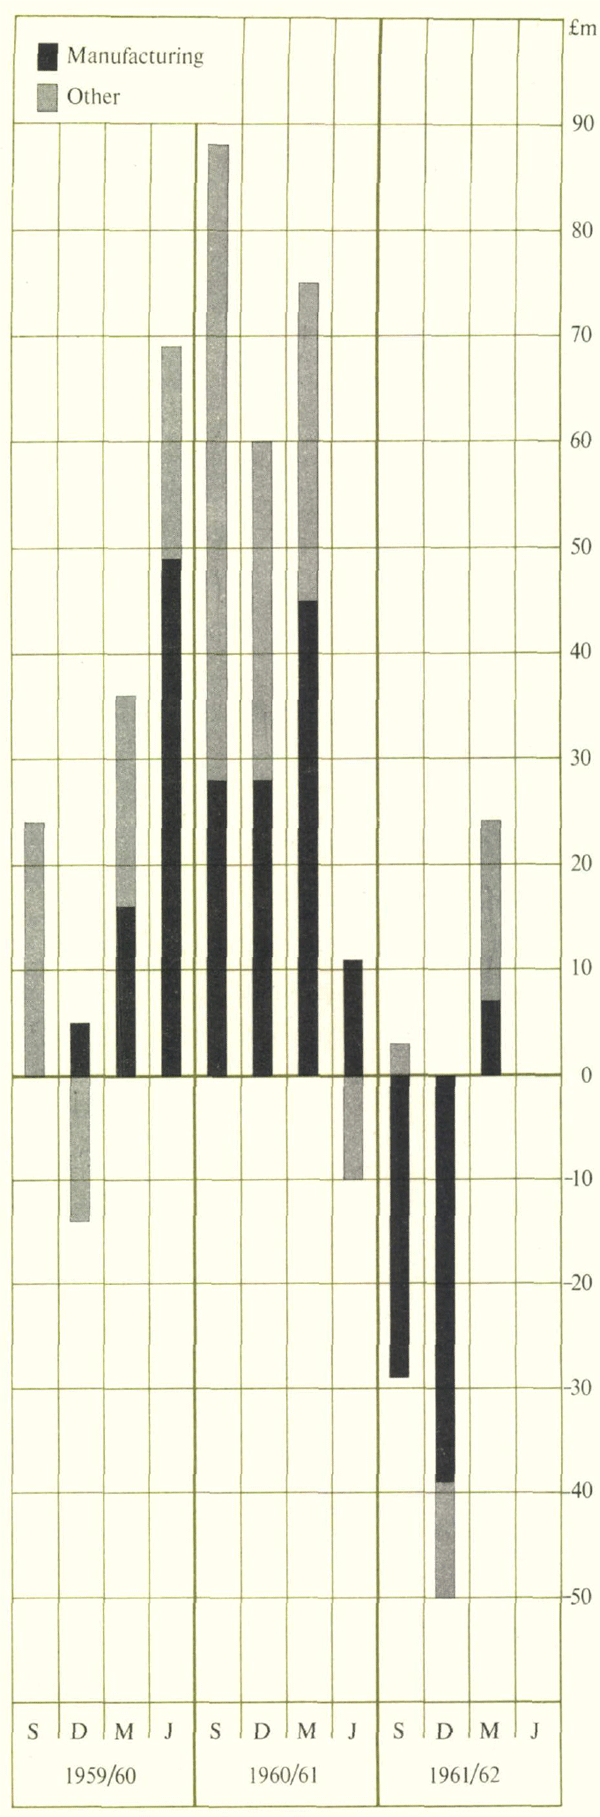
After the very large accumulation of non-farm stocks which occurred in the previous year, the first half of 1961/62 saw a period of de-stocking; the rundown occurred mainly in manufacturers' stocks. Stocks held by the engineering and metals industries and the motor vehicles industry were reduced most. However, there was some investment in stocks in the March quarter.
Farm stocks fell over the year, due largely to sales of wheat.
Public authority expenditure on goods and services was substantially higher than in 1960/61.
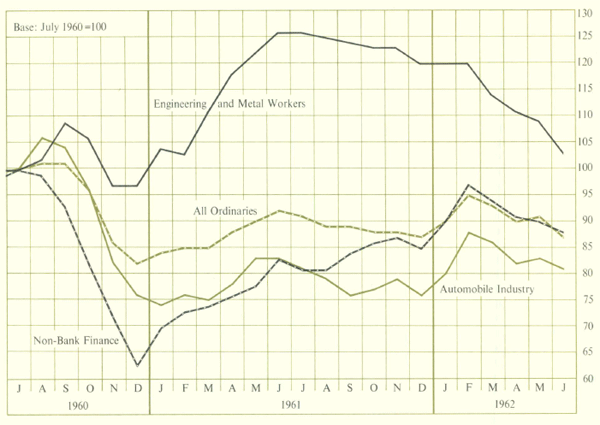
Employment – Percentage Increases (Eleven Months to May)
Sources of supply
Supplies in 1961/62 contained a smaller proportion of imports than in 1960/61. Nevertheless, the year opened badly for much of manufacturing activity. Imports continued to fall away in the early months but the burden of the excessive stocks built up in the previous year, both from heavy importing and from buoyant domestic production, bore heavily on local manufacturing activity. Output was well below capacity levels in a number of industries.
The variation in total imports showed more in imported materials than in finished goods. It is doubtful if the fall in imports of materials was more than partly caused by the previous build-up of stocks, so that it would in some measure have been related to the check to domestic production. Imports of finished consumer goods also fell but at a slower rate than other imports.
Australian industries, such as iron and steel, which were successful in finding export outlets for some of their products, were able to weather the difficult conditions of the first six months better than less efficient industries which were unable to compete in export markets.
By the end of December, industrial production generally was recovering and during the second half of 1961/62 there was a general expansion of manufacturing activity. The basic industries continued to increase their production and the output of consumer durables also rose well above 1961 levels. Textiles regained some of their earlier buoyancy and building materials and fittings shared in the recovery during the closing months of the year. But industry was not operating at levels which fully employed its physical capital.
Rural production was high. Seasonal conditions generally improved in 1961/62, particularly in the northern half of the continent; Queensland had its best wet season for several years. The volume of rural production reached a record level, due mainly to a 4 per cent rise in wool production which reached 1,700 million lb (greasy basis), increased cattle slaughterings and record dairy output. Cereal harvests were lower, but the wheat harvest was still the second largest on record.
The income from domestic production was little higher for the year than in 1960/61; but the annual rate of the last quarter provided evidence of rising levels of activity.
Employment and unemployment
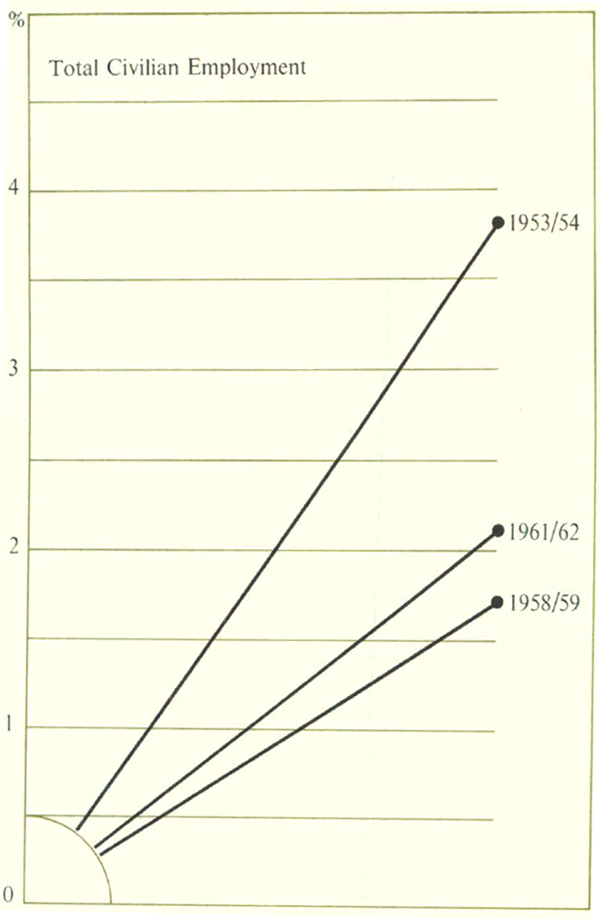
As a result of a smaller influx of migrants, the rate of population increase in 1961/62 fell below the 2 per cent achieved in earlier years. The lower migrant intake, together with a fall in the worker component, resulted in a smaller addition to the labour force from this source than has been the recent experience; but there was some offset in the increased number of young people joining the work force compared with earlier years.
At the beginning of the year, however, employment was falling and there were more people unemployed than at any time in Australia since the last world war. It was not long before employment rose once more, but the growth of demand was not sufficient to absorb all the available labour before the end of the year.
The total number of people in civilian employment (excluding rural workers and female private domestics) fell from 3,084,600 in December, 1960, to 3,003,900 in September, 1961. From this point, employment increased and at the end of May stood at 3,084,800. The rate of increase in civilian employment in the second half of the year was high but the rise over the year as a whole was not rapid by post-war standards.
Registered Unemployed Applicants Percentage Falls (June to June)
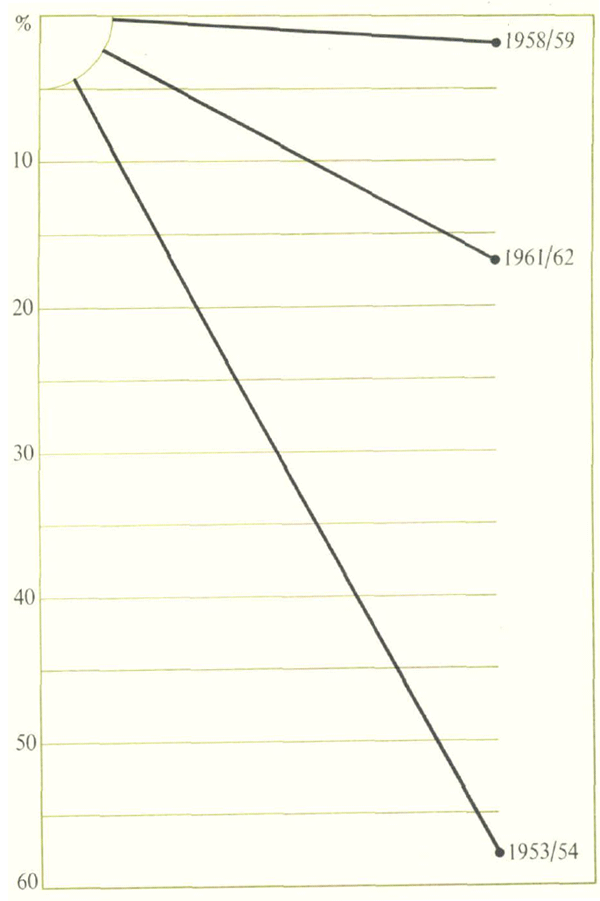
The number of unfilled vacancies registered with the Commonwealth Employment Service rose only slowly from the low level of June, 1961; at the end of June, 1962, 18,100 vacancies were registered.
The number of registered unemployed applicants reached a seasonal peak in January, 1962. There had been a fall in the early months of the financial year but this was reversed in the period November to January, when seasonal unemployment increases, and at the end of January, 131,500 applicants were registered. Numbers fell more quickly from this point and, at the end of June, unemployed applicants totalled 93,100. Changes in the number of people receiving unemployment benefit followed a generally similar pattern and at the end of June numbered 46,300 compared with 57,200 in June of the previous year.
Prices and wages
Consumer prices, which had risen more slowly in 1960/61 than in the previous year, were stable in 1961/62. Wholesale prices fell. Wage rates increased, but much less than before.
Consumer prices remained on average at about the same level as in 1960/61 and, in the June quarter of 1962, they were slightly lower than a year earlier. Food prices fell over the year, offsetting increased rent charges. The Wholesale Price Index showed a fall from April to November, 1961, amounting in all to 8 per cent, but later levelled out and by June was 4 per cent below its level at the end of 1960/61.
There were no significant movements in minimum wage rates after the basic wage increases of July, 1961. Average weekly earnings, however, increased over the year from the second quarter but the rise in the yearly average was a good deal less than in the two previous years.
The price stability attained in 1961/62 should, if maintained, help Australian industry meet competition from oversea producers both in home markets and abroad.
Australian Monetary Conditions
The desire for liquidity dominated private monetary decisions in Australia in 1961/62. Liquid assets had regained their function as a store of value through the events of the previous year and the cessation of price inflation, so that, at the beginning of the year, there was no longer any pressure to move out of liquids. There was, at the same time, also considerable doubt and uncertainty about the future and the move away from liquids was not only checked, but reversed. Individuals and firms therefore persisted in the trend to shortening the structure of their assets and reducing their indebtedness. Official policies met their needs for greater liquidity.
Monetary conditions were made easier in two ways by official policies. Government expenditure was increased over and above the return from revenue. There was also a loosening of credit—the scope for borrowing from banks increased and the new lending commitments of the banks rose.
Easier monetary conditions do not, of themselves, ensure a recovery from recession. Recovery depends upon the growth of demand for goods and services, to which Government action contributed directly in 1961/62. But monetary policy can ensure that a desire for liquidity and a lack of finance generally do not stand in the way of recovery, so that businesses have no need to realise on their assets in forced sales, nor any need to forego profitable capital expenditure. Monetary policy did, in fact, ensure that these contingencies did not arise.
Liquidity in the private sector
Private saving rose slightly in 1961/62; but gross capital formation in the private sector fell—partly as a result of the running down of stocks—so that surplus funds were available for the redemption of debt and to increase liquid claims.
The non-finance groups, i.e. the private sector apart from the financial institutions, took the opportunity to reduce short term debts owing overseas; reduced hire purchase debt to finance companies and borrowed only moderately from banks and other financial institutions at home; and greatly increased their holdings of liquid assets.
The additions to the liquid assets of the non-finance part of the private sector were placed mainly with the banks in the first half of 1961/62—in the pursuit of higher liquidity—and approximately £250 million was added to cash and deposits with trading and savings banks. Contributions to life assurance and pension funds were well maintained. Although total subscriptions (net of repayment) to issues by listed companies of equity and fixed interest capital rose from the very low level of the second half of 1960/61, they were the lowest for the July-December period since 1957/58. The increased subscriptions were mainly to issues by finance and property companies; total new capital raisings by other companies rose only slightly in the first half of 1961/62.
In the third quarter, funds surplus to those required for capital formation were much less; the reduction was largely seasonal but stocks were no longer being run down and, indeed, were increased. The bank deposits of the non-finance groups continued to increase; bank advances declined seasonally. New lending by hire purchase companies remained low and outstanding balances fell. Capital raisings of companies other than finance and property companies were lower than in the same quarter of 1960/61.
The surplus funds of the private sector were associated with and, in part, dependent upon the deficit of public authorities and the improvement in the balance of payments. However, the non-finance groups made only a relatively small contribution directly to the borrowing of the Commonwealth Government. Rather, the Government's needs were met indirectly through the acquisition of Government securities by financial institutions with which the non-finance groups of the private sector placed their funds. The trading banks acquired £116 million of Government securities (including Treasury bills) over the year and savings banks, life offices and pension funds also increased their holdings.
Changes in selected assets and liabilities of the non-finance groups of the private sector are shown below. These estimates arise from the work carried out in the Bank on flows of funds to which reference has been made in earlier reports. The figures are only tentative, but serve to show the changes taking place. Both our understanding of and our capacity to influence the effects of changing attitudes towards liquidity are limited and uncertain and it is increasingly important that they be improved. However, the recent move to greater liquidity may be complete and it is not likely to be more than partially reversed while liquid assets remain an acceptable store of value.
Financial institutions
Although the trading banks were well supplied with liquid funds in the first half of 1961/62 and new lending commitments were rising, advances outstanding fell more than seasonally. On the other hand, savings bank loans outstanding rose. Life offices lent less. Again, new hire purchase loans by finance businesses rose only slowly from the low levels established in the second half of 1960/61 and the continuing relatively high rate of repayment of earlier borrowing resulted in a reduction in outstanding indebtedness to these lenders. This fall appears to have been offset by an increase in other lending by finance businesses. Generally, however, non-bank financial institutions were less active than in recent years.
| 1959/60 | 1960/61 | 1961/62 | |||
|---|---|---|---|---|---|
| 1st half | 2nd half | 1st half | 2nd half | 1st half | |
| Assets: | |||||
| Cash and trading bank deposits | 174 | − 44 | 57 | − 77 | 180 |
| Savings bank deposits | 69 | 62 | 44 | 10 | 73 |
| Saving through assurance funds | 35 | 36 | 36 | 37 | 36 |
| Commonwealth Government securities (excluding seasonal notes and Treasury bills) | − 12 | − 20 | − 20 | − 25 | − 13 |
| Subscriptions to new capital raisings of listed companies* | |||||
| —share capital | 23 | 21 | 48 | 40 | 40 |
| —debentures, deposits and notes | 95 | 83 | 86 | 4 | 45 |
| Liabilities: | |||||
| Indebtedness to— | |||||
| trading banks (including Commonwealth Development Bank) | 6 | 80 | 18 | − 7 | − 56 |
| savings banks† | 18 | 22 | 22 | 16 | 17 |
| Rural Credits Department of Reserve Bank | − 40 | 44 | − 32 | 40 | − 36 |
| finance companies on hire purchase | 46 | 21 | 29 | − 43 | − 19 |
| pastoral finance companies | 5 | 6 | 15 | − 10 | 0 |
| New capital raisings by listed companies)‡ | |||||
| —share capital | 21 | 17 | 41 | 38 | 41 |
| —debentures, deposits and notes | 30 | 28 | 38 | 20 | 19 |
| *Total new money raisings less subscriptions by banks, life insurance companies
and superannuation funds. †Including borrowing by building societies. ‡New money raisings excluding raisings by finance and property companies. |
|||||
Share Prices – Sydney Stock Exchange Indexes
Non-bank financial institutions as well as banks were generally very liquid. But new capital raisings by finance and property companies, which had fallen from a peak level of £80 million in the first half of 1960/61 to a net repayment of £1 million in the second half of that year, rose to a total of £36 million in the six months to December, 1961. However, they were only £3 million in the March quarter of 1962.
New capital raisings
New capital raisings by all listed companies rose substantially in the first half of 1961/62 from the level of the previous six months. They were, however, still well below raisings in the first half of 1960/61. The increase was mainly in raisings by finance and property companies. Total raisings by other listed companies were well maintained at £59 million. In particular, manufacturing companies raised £34 million, about the same as in the first half of 1960/61. However, new capital raisings by companies engaged in commerce and by other industries as a whole were only a little more than half as high as the peak raisings of July-December, 1960. Capital raisings of companies other than finance and property companies were £23 million in the March quarter; finance and property companies raised £3 million.
Although new capital raisings through issues of fixed interest obligations rose in the first half of 1961/62, they were only about half as great as in the first half of 1960/61 and accounted for most of the variation in total capital raisings in these periods; new fixed interest raisings then fell in the March quarter of 1962.
The Sydney Stock Exchange share price index for all ordinary shares, which had fallen by 19 per cent in the December quarter of 1960/61 and subsequently risen by 12 per cent in the second half of 1960/61, did not retain this buoyancy in the face of unfavourable company profit reports and the absence of any rapid economic recovery, and the index fell throughout most of the first half of 1961/62 by a total of 5 per cent. The index rose in January and February but did not sustain the rally and by the end of the year was slightly below the level of December, 1961. In the last two months of the year, share prices in Australia appeared to move in some sympathy with the decline in the United States and the United Kingdom.
Generally, there were signs that investors were inclined to exercise more careful and discriminating judgment in assessing the prospects of various types of shares and appraising corporate fixed interest obligations.
Interest rates
With the reduction in the demand for borrowed funds in the private sector, the general level of interest rates fell in the first half of the year. In the second half, there was some further reduction of yields on Government securities, although small, and little change in other market rates. Borrowing was generally less costly in 1961/62 than in 1960/61.
For the greater part of 1961, interest rates on debenture and note issues of finance companies were generally maintained at what was their highest level in recent years. However, in the December quarter of 1961, a downward movement took place in the rates offered by a number of bank-affiliated and other first class finance companies. By the close of the financial year, these interest rates had almost returned to the level of some two years earlier.
Market rates at the end of the year generally stood in much the same relation to bank deposit rates as they had in June, 1961. Overall, the new pattern of interest rates established in Australia in 1960/61 remained.
The greater flexibility in interest rates which has been achieved made it possible for interest rates in 1961/62 to move with the needs of the situation rather than against them. It has been argued that a bigger reduction in 1961/62 could have been useful in establishing a lower base from which later rises could take place and might have helped increase expenditure. If it becomes necessary to counter a strong movement away from liquid assets, sharp increases in interest rates may become desirable.
The volume of money
A major factor making possible the increase over the year in the private sector's holdings of financial assets was the deficit of public authorities. In the table on page 18, the influence of this deficit upon the volume of money is measured by the Commonwealth Government's cash position and the Commonwealth Government's debt position, coupled with the change in the holdings of Commonwealth Government securities by the public (including non-bank financial institutions). The table also demonstrates the part played by the balance of payments.
The volume of money in Australia rose about 7 per cent over the year compared with an increase of less than 2 per cent in 1960/61. Notes and coin in the hands of the public rose slightly, the bulk of the rise in the volume of money being in the deposits of the public with cheque-paying and savings banks. Deposits with cheque-paying banks, which had also been virtually unchanged in 1960/61 rose strongly by £116 million, £81 million of which was in fixed deposits. Savings bank deposits rose by £145 million; they had risen £57 million the year before.
At June, 1962, the volume of money was about 53 per cent of the gross national product for 1961/62 compared with 51 per cent in 1960/61 and 52 per cent in 1959/60.
Debits to the accounts of trading bank customers rose at a growing rate as the year progressed. During the first quarter, debits were 4 per cent lower than a year earlier but, by the last quarter of 1961/62, they had risen to a level 10 per cent higher than twelve months earlier. For the year as a whole, debits to accounts of trading bank customers were 2.5 per cent higher than in 1960/61.
| Volume of Money—Average for June (£ million) | 1960 | 1961 | 1962 |
|---|---|---|---|
| Notes and coin in hands of public | 400 | 399 | 405 |
| Deposits of public with all cheque-paying banks | 1,684 | 1,683 | 1,799 |
| Deposits with all savings banks | 1,512 | 1,569 | 1,714 |
| Volume of money | 3,596 | 3,651 | 3,918 |
| Volume of Money—Analysis of formation factors (Movement—£ million) | 1959/60 | 1960/61 | 1961/62 |
|---|---|---|---|
| International reserves | − 4 | + 39‡ | + 10‡ |
| Government cash position | + 29 | − 16 | + 27 |
| Government debt position* | + 53 | + 14 | + 147† |
| Loans and advances | |||
| All cheque-paying banks | + 102 | + 13 | + 21 |
| Savings banks | + 40 | + 38 | + 36 |
| Rural Credits Department | − 1 | + 17 | − 26 |
| Miscellaneous factors | + 67 | − 76‡ | + 104‡ |
| + 286 | + 29 | + 319† | |
| Less movement in public's holdings of Commonwealth Government securities | + 28 | − 26 | + 52† |
| Volume of money | + 258 | + 55 | + 267 |
| Of which: | |||
| Notes and coin in hands of public | + 18 | − 1 | + 6 |
| Deposits of public with all cheque-paying banks | + 107 | − 1 | + 116 |
| Deposits with all savings banks | + 133 | + 57 | + 145 |
| *Commonwealth Government securities other than Treasury bills; excludes
holdings by governments. ‡International reserves include drawing from (1960/61) and repayment to (1961/62) I.M.F. of £78 million. Corresponding offsetting changes in Reserve Bank liabilities are in “Miscellaneous factors”. †Preliminary. |
|||
| Commonwealth Cash Position (£ million) | 1959/60 | 1960/61 | 1961/62 |
|---|---|---|---|
| Change in Treasury bills on issue (increase−decrease+) | − 30 | + 15 | − 22 |
| Increase in cash balances | 1 | 1 | − 5 |
| Cash surplus (+)/deficit (−) | − 29 | + 16 | − 27 |
| Treasury bills on issue at end of year | 201 | 186 | 208 |
| Net holdings of Commonwealth Government securities redeemable in Australia (including Treasury bills) | |||
|---|---|---|---|
| (Movement—£ million | 1959/60 | 1960/61 | 1961/62† |
| Reserve Bank | + 38 | + 16 | − 24 |
| All cheque-paying banks | − 37 | + 14 | + 116 |
| Savings banks | + 54 | − 5 | + 24 |
| Other non-Government holdings | + 28 | − 26 | + 53 |
| Total | + 83 | − 1 | + 169 |
| †Preliminary. | |||