
Speech The Road to Ample – Towards a Demand-driven Liquidity Regime
Introduction – destination ample
Thank you for joining me at the Reserve Bank. I would like to acknowledge the Gadigal People of the Eora Nation, the traditional owners of the land we meet on. I pay my respects to their Elders past and present and extend that respect to all First Nations peoples present.
Today I’m focusing on the RBA’s transition to a new regime for implementing monetary policy. To keep the cash rate near the Monetary Policy Board’s target, the RBA sets terms on which banks can access Exchange Settlement (ES) balances. These are a form of money that banks use to settle payments with each other and are also known as reserves. Different regimes can achieve the cash rate target, but each approach has different implications for the liquidity available to the banking system.
The regime we’re leaving is that of high, supply-driven reserves that arose from our policy responses to the pandemic. The RBA’s bond purchases and term funding operations injected nearly $500 billion of reserves into the banking system (Graph 1). Banks had less need to borrow from one another or make use of our regular liquidity operations. The rate paid on reserves – the ES rate, tied to the Board’s cash rate target – became the anchor for short-term interest rates. However, reserves have since fallen by more than half as the assets the RBA acquired under pandemic-era policies have matured, and that will continue.
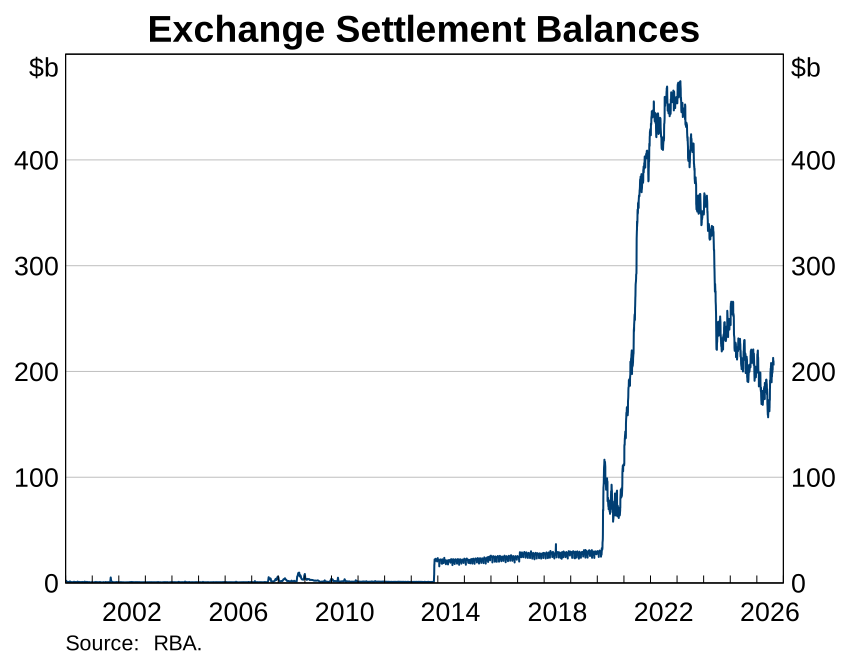
The regime we’re moving to is one of ample reserves – which in the Australian context means a demand-driven framework. This is not about reaching a particular level of reserves. Rather, it is a system that meets and adapts to banks’ demand for reserves, and in that way steers short-term interest rates.
The Board chose this approach in 2024, rather than returning to the pre-pandemic framework of scarce reserves. Experience had highlighted the benefits of readily available reserves for monetary policy transmission, banking system resilience and payments efficiency.1
Under the new framework, we supply as much reserves as are demanded through our regular full-allotment open market operations (OMOs) which offer reserves at a modest spread over the ES rate. But we don’t attempt to push more reserves into the system beyond that which is demanded at that prevailing price.2 In 2025, we announced the detailed design, including the spread of the OMO rate over the ES rate.3
As we move from a system in which the RBA determines the quantity of reserves to one in which the banking system does, a key question is how that can occur smoothly and adapt as market conditions evolve. That will be key to maintaining effective control of the cash rate, transmission of monetary policy and well-functioning markets. In that context, I’ll address three issues today:
- How close are we to a demand-driven environment for reserves, and what are we learning as we get closer?
- How will our operational framework help with a smooth transition? I’ll outline the different roles of OMOs, other liquidity operations, and why we’re announcing today that one facility – open repo – is no longer needed.
- How should market participants prepare for a world in which liquidity management once again becomes more active for everyone?
I want to stress that none of these issues bears on the stance of monetary policy itself. The cash rate target continues to be set in the normal way by the Monetary Policy Board, and as I said we can achieve that target under either regime.
We are not yet at ample reserves
It is important to know if we’re already in a demand-driven environment or if we’re still transitioning towards that.
As reserves decline, two key things will signal we are close to ample:
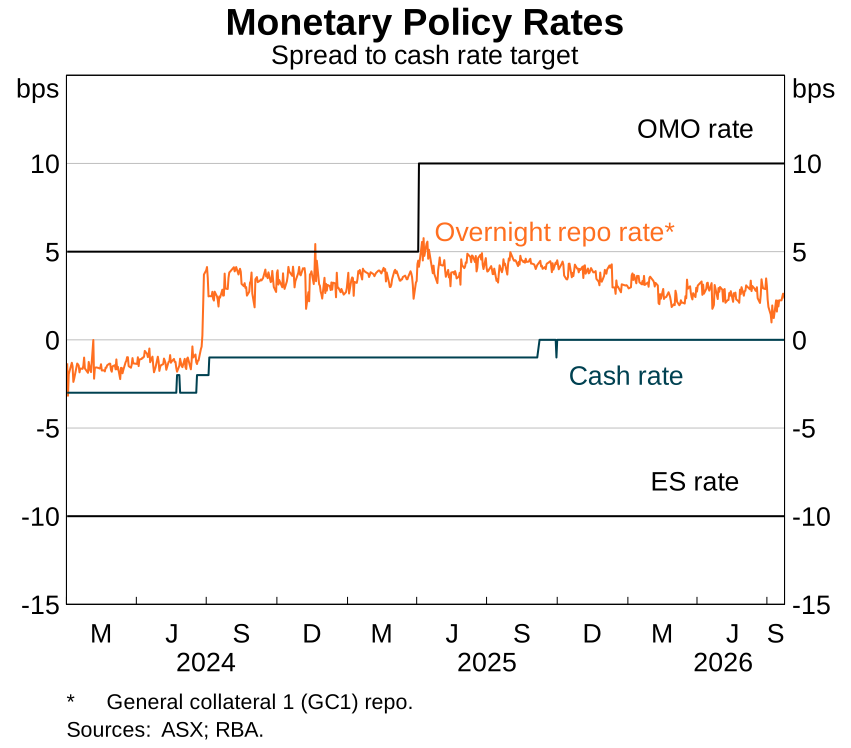
- Short-term rates will rise and increasingly be guided by the cost of obtaining reserves (the OMO lending rate) rather than the return on holding them (the ES deposit rate). Rates will nonetheless remain consistent with the cash rate target because both those rates are set at a small spread to the target.4
- The banking system will determine the quantity of reserves via OMOs. As market rates rise, it will become more attractive to use OMOs, and they will become the key way in which the system overall gets the reserves it needs.
Currently, these signals suggest that reserves are still above underlying demand.
First, reserves can still be sourced somewhat more cheaply in short-term repo markets than from the RBA (Graph 2). Money market rates across instruments and maturities have moved well above the ES rate, but we still hear in liaison that liquidity is abundant and placing downward pressure on market rates.5
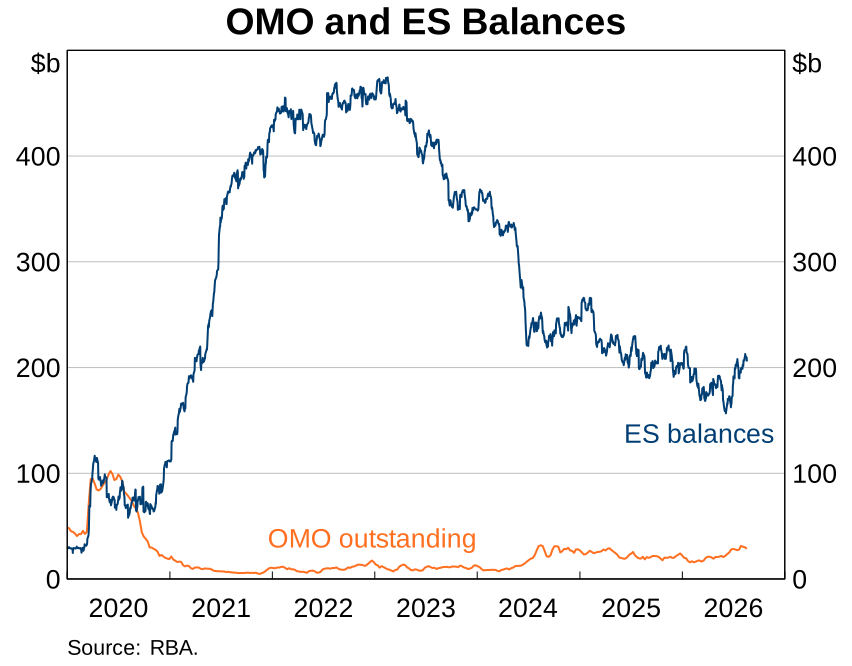
And second, use of our full-allotment OMOs is still modest. We do see a wide range of counterparties participating regularly, and total usage has increased recently. But the banking system has essentially allowed reserves to decline rather than trying to offset this (Graph 3).
Taken together, those indicators suggest that we’re not yet in an environment where the level of reserves is driven by demand.
Demand for reserves is evolving and uncertain
While we haven’t reached ample reserves, we’re learning more about underlying demand as we get closer.
Banks’ expectations for the reserves they will hold at ample have fallen quite a bit over time. To gauge how demand is evolving, we regularly survey banks to get a sense of their preferred reserve holdings in the ample regime. In 2024, banks’ responses implied that ample reserves would be around $100–200 billion (Graph 4). But that has since declined to around $70–100 billion – well below the current level of reserves. This helps explain why the fall in reserves has so far seen only limited reaction in either market prices or OMO usage.6
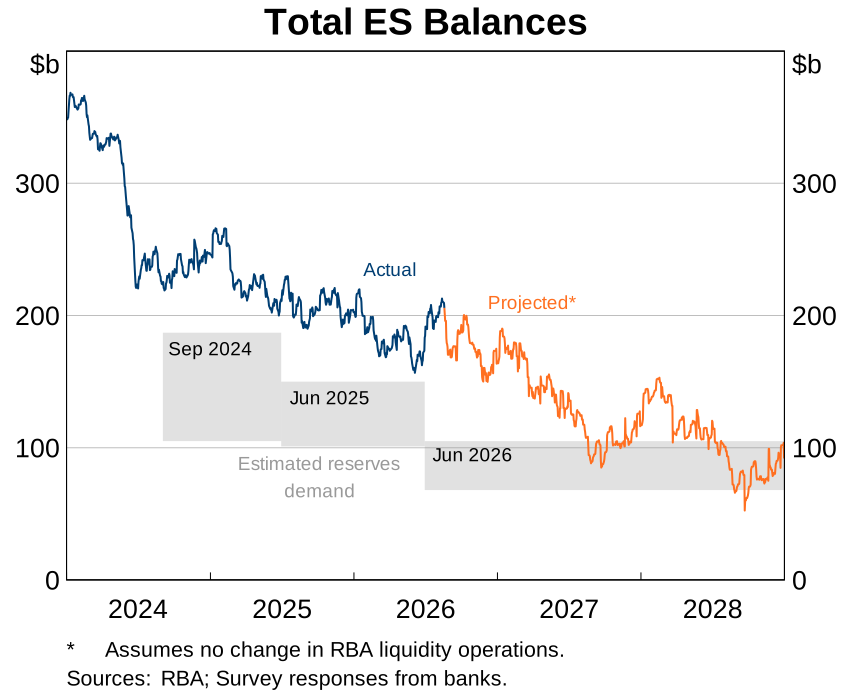
The decline in banks’ expected reserve holdings is, if anything, a welcome development, given that one factor is likely to be comfort with the RBA’s liquidity framework. As I’ve said, ample is not about targeting a particular quantity of reserves; it’s about making them available in whatever size the system needs.
What we’ve seen is that, as the supply of reserves has fallen, banks have been comfortable holding high-quality liquid securities instead (Graph 5). Banks primarily hold reserves to meet payments, manage liquidity risks and satisfy regulatory requirements, given they’re the most liquid asset available. But banks have been willing to hold more securities because they are confident they can readily turn them into cash, either in private markets or at the RBA’s liquidity facilities. It helps that OMO use has remained routine through the period of excess reserves. And we’ve emphasised that our facilities are available to be used and banks should be ready to access them when needed.7
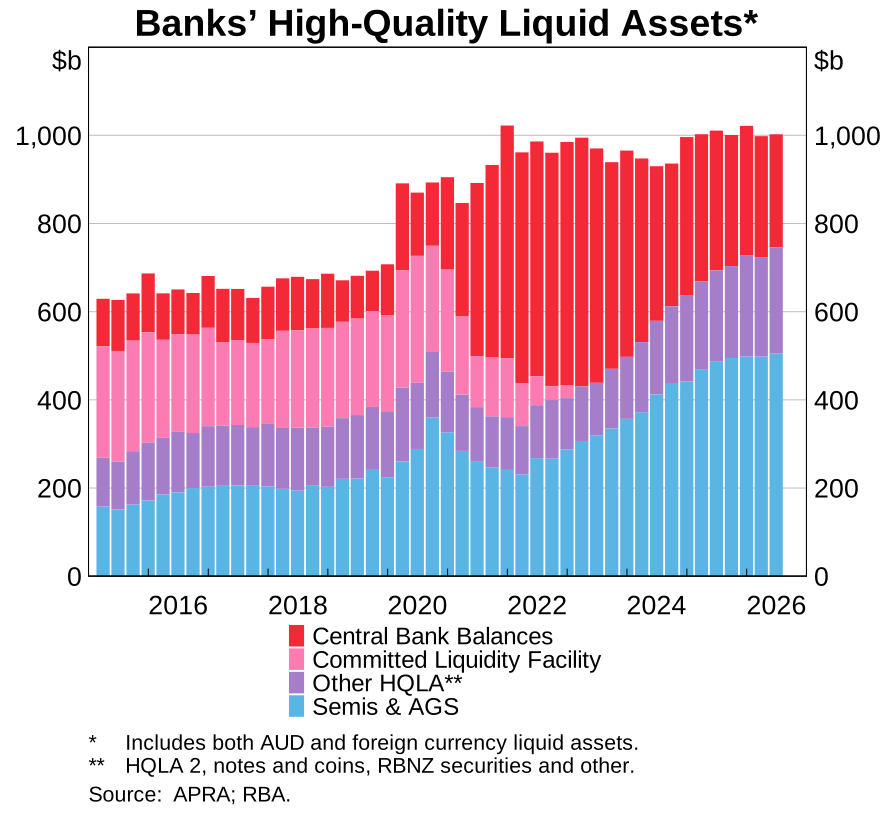
Some of the decline may also reflect changes in incentives. Last year, we increased the cost of obtaining reserves through OMOs to encourage greater activity in private markets under the ample framework. Though the survey suggests this has been a less important driver of demand.
More generally, these developments underscore that we need to be ready for a range of scenarios for reserves demand.
International experience also illustrates that point – underlying demand for reserves has been difficult to predict and very different across jurisdictions (Graph 6). Australia is towards the lower end of the range for where reserves appear to be settling. There are various reasons for such differences, including the inherent liquidity risks in the financial system and central banks’ operational frameworks.8 And our shorter experience with excess reserves may also have helped to avoid some of the reliance on large reserve buffers seen elsewhere.9
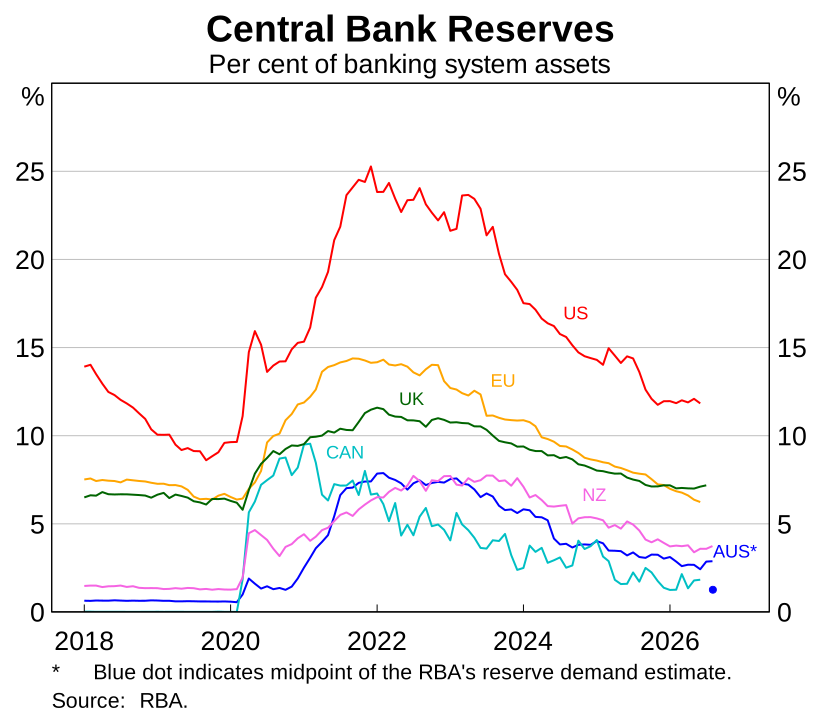
And looking ahead, reserves demand will continue to evolve. Demand is influenced by various factors – payments innovation, liquidity regulation and the shape of the yield curve – all of which could shift in coming years and possibly in different directions.10
So, when we might reach ample reserves ultimately remains highly uncertain. It could be some years away, particularly if banks continue adjusting to a lower-reserves environment. But it could also be earlier if banks increase their demand or there are market frictions.
In any event, our framework is designed for uncertainty, so that reserves adjust to whatever level of demand or timing eventually emerges.
A flexible liquidity framework
How is our framework designed to smoothly meet the system’s demand for reserves as we get closer?
Let’s step through what will happen.
As our bond holdings continue to mature, that by itself will keep reducing system reserves at a rate of about $20–40 billion a year.11 But as reserves reach underlying demand, banks will replace those drained reserves with reserves obtained from OMOs. That’ll keep overall reserves steady in the face of further bond maturities.
This graph illustrates that simple transition (Graph 7). For now, I’m just showing reserves supplied through bond holdings and OMOs; I’ll come to other liquidity operations that could also contribute in a moment.
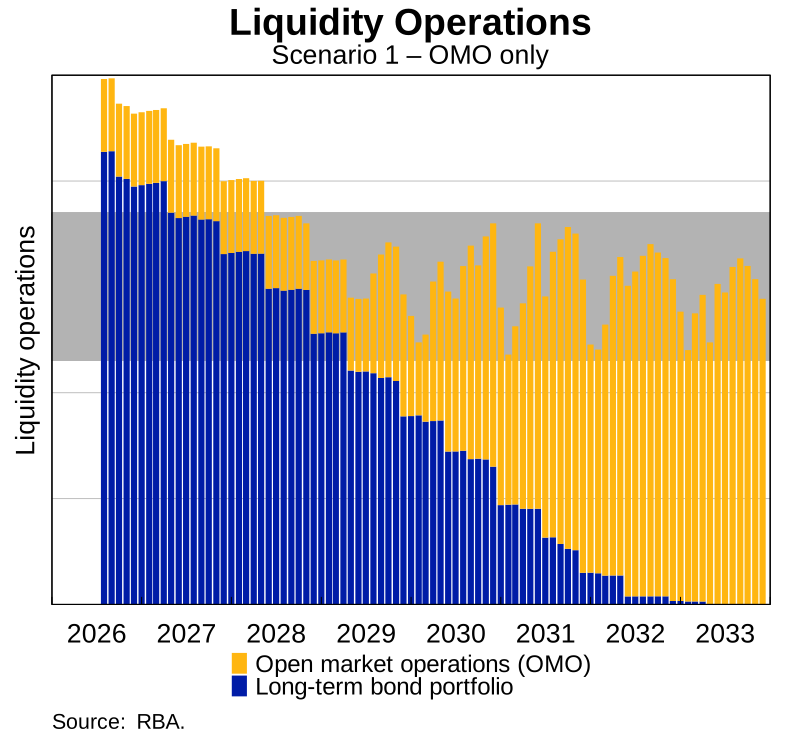
In essence, the level of reserves will become determined by demand from the banking system. Rather than earlier decisions about our asset holdings – in the form of bonds – driving reserves, it’ll be the other way around. Demand for reserves will drive the size of OMO repos, which are a short-term asset for the RBA.
That has two important implications.
First, we don’t need to accurately predict the exact level of underlying demand, at any point, for an effective transition. If system reserves dropped below the level of underlying demand, there would be upward pressure on money market rates, incentivising banks to come to OMOs for more liquidity. In that way, demand for reserves automatically generates, in a timely way, the supply needed to keep the cash rate close to target.
Second, our pandemic-era bond portfolio can continue to run off uninterrupted. The level of our balance sheet will become responsive to demand, but its asset composition will shift from long-term bonds to short-term repo.
In short, we don’t need to know the unknowable or make active choices to ensure a smooth transition.
Other operations as a complement to OMOs
While OMOs will be our key liquidity tool, we wouldn’t want them to reach a size that inhibits the healthy functioning of the repo market.
That may not become an issue. OMOs can safely scale up significantly and automatically from their size today without impairing market functioning. Our repo book is much smaller than it was before the pandemic. Meanwhile eligible collateral in the system has roughly doubled and been accompanied by a strengthening and deepening of the private repo market (Graph 8). Indeed, as our bond holdings mature that makes more bonds available for the market to use as collateral at OMOs.12 The price and other terms of OMO have also been set with the market’s health in mind.13
So, it’s quite possible that system-wide reserves demand can be fully met by OMOs, particularly given the lower demand estimate.
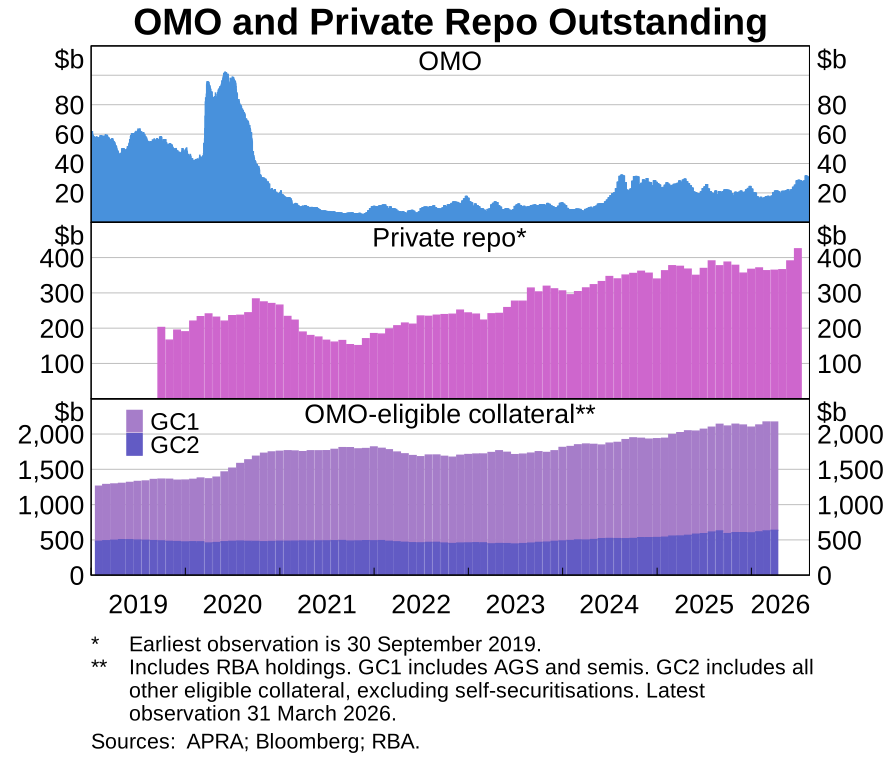
But it’s also possible that at some point the size of the OMO inhibits market function by encumbering a large amount of collateral, or involves operational risks. For those reasons, other central banks with a similar framework to us are preparing to use a wider range of operations, if required, including the European Central Bank (ECB), Bank of England (BoE) and Reserve Bank of New Zealand (RBNZ).14
In that situation, we have other liquidity tools in place to complement OMOs. Those include foreign exchange (FX) swaps, cross-currency basis swaps, and purchases of short-term Australian Government Securities (AGS). These would allow us to inject reserves through other deep, liquid markets where the associated risks to the RBA remain low.
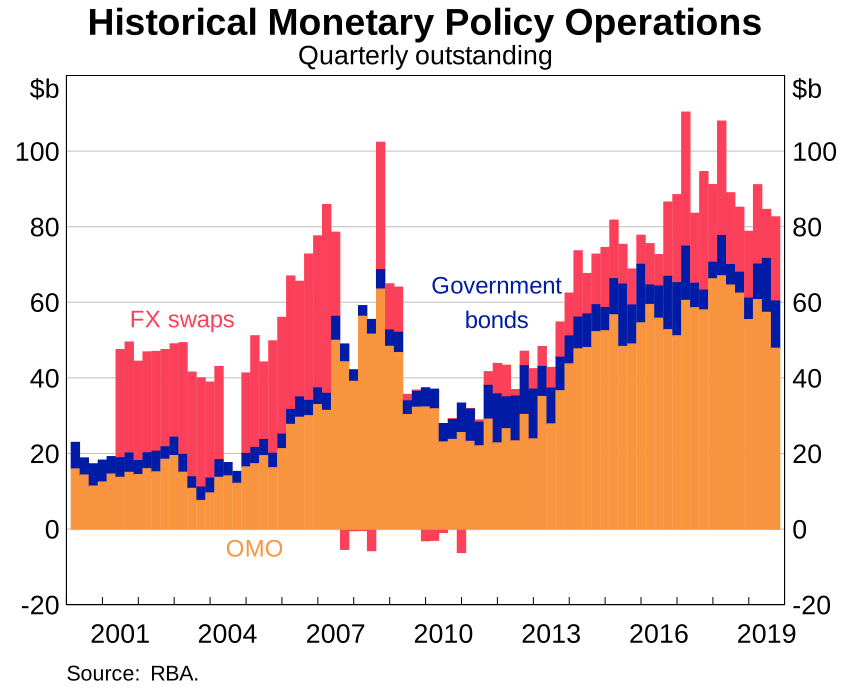
These types of operations are not new. Most were a routine part of our liquidity operations before the pandemic (Graph 9).15 Indeed, FX swaps were larger than our OMO book at times in the early 2000s, when government deposits were draining reserves and the repo market wasn’t large enough for us to fully offset that through repos alone.
It’s important to be clear what the objective of these other operations would be. They would aim to supply a relatively stable quantity of reserves to the system, so that OMOs do not inhibit the functioning of private repo markets and to support operational resilience (Graph 10).
In contrast to OMOs, they would not aim to influence an interest rate in FX swap, cross-currency swap or AGS markets.
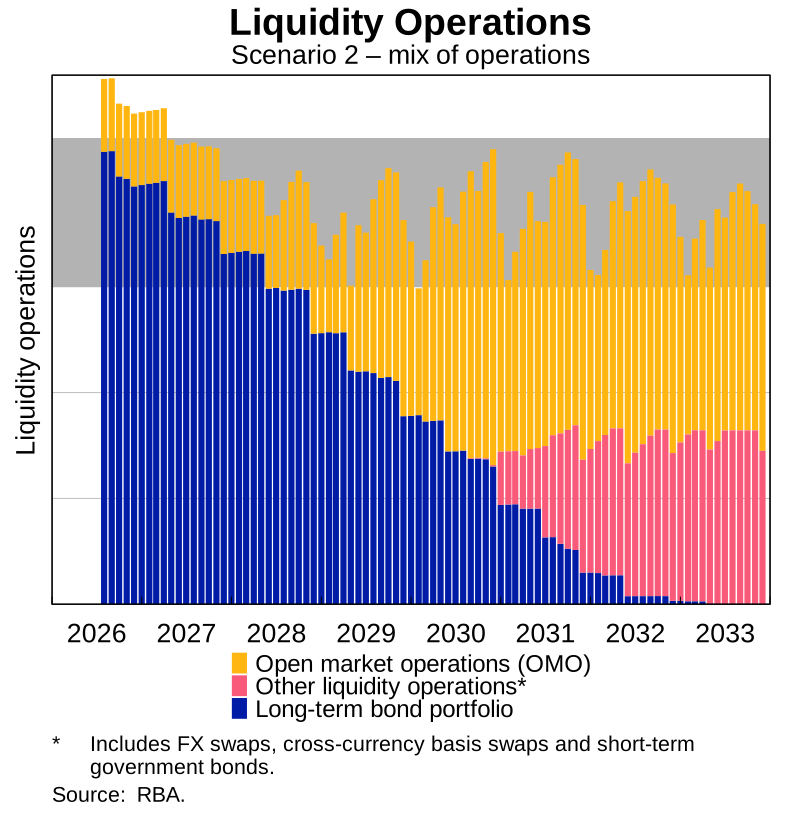
To meet their objective, these operations would follow three key principles:
- Keep OMOs as the key source of liquidity. Other operations may provide substantial reserves, but they should be no larger than needed. OMOs would continue to play their key role as the marginal source of supply to meet the demands of banks and control short-term rates.
- Transact as a price-taker. We would transact at prevailing market rates in these other operations. Though we’d avoid transacting at prices that might be inconsistent with our monetary policy implementation objectives.
- Take a gradual and steady approach. If OMOs require any support – and they might not – we would probably start with FX or cross-currency swaps. Our long-term bond portfolio is still large and will still be rolling down when we reach ample. The size and composition of these operations would be adjusted as conditions evolve.16
So these other operations would help us to accommodate a wide range of scenarios for reserves demand and market function. Should such operations begin, we would provide an appropriate level of transparency around their nature and goals.
Why open repo is no longer needed
The final element of our operational toolkit is standing facilities. These play an important role in supplying reserves for short terms between weekly OMOs. They are available bilaterally, on-demand.
But one of our standing facilities – open repo – is no longer needed because banks can now readily obtain as many reserves as they need from full-allotment OMOs.17
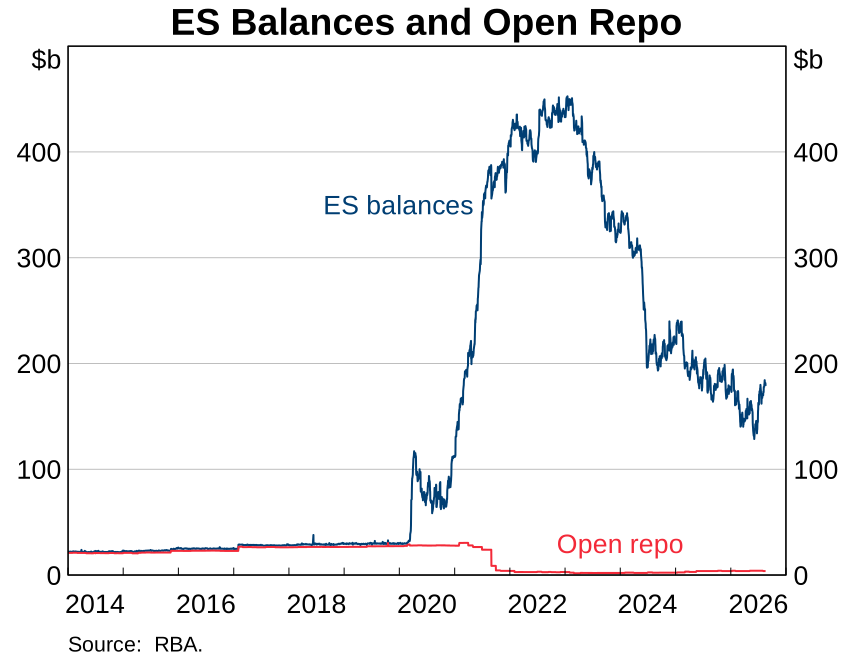
Open repo was introduced in 2013 to overcome the constraints of the scarce reserves system. Its aim was to provide an extra source of liquidity so that banks had the minimum reserves they needed to ensure smooth after-hours payments, at zero-cost. At the time, we estimated the banks would need around $20–30 billion to achieve this, well above reserves supply of around $1 billion.18
Use of open repo has declined significantly in recent years, to below $5 billion (Graph 11). Much of the current use is by banks that do not participate in after-hours settlements, who were also given access.
In the new liquidity framework, banks will still be expected to hold minimum ES balances to support after-hours payments. But open repos are no longer needed to meet those.
The RBA has decided that the facility will cease from early next year. We’ll communicate more with market participants about this change in coming months. And we would retain the ability to reintroduce the facility if future developments created a clear need for it again.
Preparing for a more active liquidity environment
How can market participants be well prepared as we get closer to ample?
Money market rates are likely to become more variable, which is a normal feature of an active market. They should become more responsive to fluctuations in the level and distribution of reserves, particularly between weekly OMOs. That sort of variation provides useful signals and has been the recent experience in the United Kingdom, New Zealand and Canada when transitioning to similar systems.19
As we get closer to ample, and these price signals again begin to play more of a role, market participants should be prepared to again manage their liquidity positions more actively. While we will supply the reserves needed at a system level, that doesn’t displace the need for individual firms to prudently manage their liquidity. Being prepared means:
- monitoring and forecasting their liquidity needs
- being ready to actively source liquidity through money markets and provide liquidity to others across markets
- and having the operational arrangements in place to do that (such as appropriately calibrated counterparty limits).
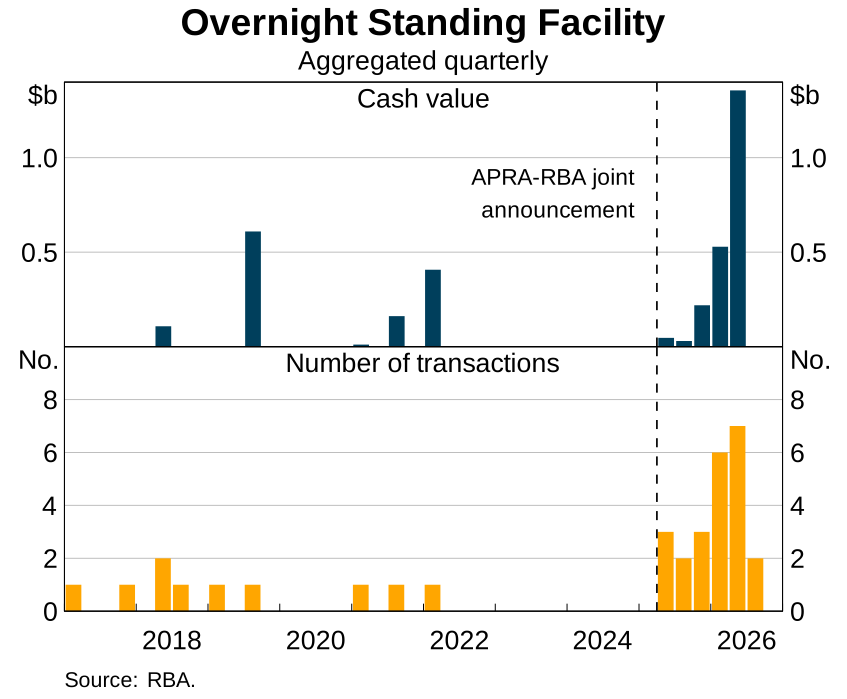
Counterparties should also be ready to use the full range of RBA facilities, drawing on those when they need and recycling liquidity to others through markets, as well as regularly testing these facilities. I want to emphasise that our overnight and intraday standing facilities remain very much open for business, and we expect their use to rise as reserves decline. Last year we made a joint statement with the Australian Prudential Regulation Authority to underscore that use of the overnight facility is seen as routine liquidity management, and we have since seen an encouraging lift in its use (Graph 12).20
Conclusion
Let me conclude.
The road to ample is a transition from a system in which the RBA determines the quantity of reserves to one in which the banking system does.
We are not there yet, and when we will arrive is uncertain. Market behaviour will signal when we are getting close, and today suggests that reserves still reflect our pandemic-era assets more than the underlying demand of the banking system. Most importantly, reserve demand can and will evolve over time, in both directions.
Our framework is designed so that a smooth transition does not depend on knowing when we will reach ample reserves. Ample is not about reaching a particular quantity of reserves. It’s about a system that can flexibly supply whatever quantity the banking system demands, while keeping the cash rate close to the Board’s target. Our full-allotment OMOs provide that flexibility. And other liquidity tools will be available to provide a quantity of reserves, if OMOs were to reach a size that inhibited repo market functioning.
Under that framework, open repo is no longer needed. It was introduced to overcome the constraints of a scarce-reserves system. But our other standing facilities remain very much open for business.
Finally, market participants have an important role to play. As reserves become more demand-driven, active liquidity management will become more important for financial institutions. Participants should be prepared to deal with the full range of RBA operations, monitor their needs, and obtain and provide liquidity through private money markets.
A flexible framework, supported by well-prepared market participants, will help ensure that transition is a smooth one.
Thank you for your time, and I look forward to your questions.
Endnotes
* I thank Ahmet Aziz, Alexandra Baker, Joel Bank, Matthew Carter, Anna-Sophia Cetin, Nakshi Chowdhury, Sean Dowling, Jacob Harris, Aidan Penman, Ewa Pluciennik, Dmitry Titkov, Michael Thornley, Nicholas Twaddle and Benjamin Ung for the work underlying this speech. I would also like to thank numerous RBA staff for their helpful comments and suggestions. The views here are my own.
1 See Kent C (2024), ‘The Future System for Monetary Policy Implementation’, Bloomberg Australia Briefing, Sydney, 2 April. This is essentially the ‘Friedman rule’ at work – making the supply of money relatively unconstrained is socially optimal.
2 The opportunity cost of reserves is the spread between the OMO rate and ES rate. Similar systems have been adopted by the BoE, ECB and RBNZ (as well as Riksbank albeit from a structural surplus). See Hauser A (2019), ‘Waiting For the Exit: QT and the Bank of England’s Long-term Balance Sheet’, Speech at the European Bank for Reconstruction and Development, London, 17 July; BoE (201), ‘The Bank of England’s Future Balance Sheet and Framework for Controlling Interest Rates’, Discussion Paper; Schnabel I (2023), ‘Back to Normal? Balance Sheet Size and Interest Rate Control’, Speech at an Event Organised by Columbia University and SGH Macro Advisors, New York, 27 March; Schnabel I (2024), ‘The Eurosystem’s Operational Framework’, Speech at the Money Market Contact Group, Frankfurt am Main, 14 March; and Silk K (2024), ‘Liquidity Management: Principles for Liquidity Provision and the End of an Abundant Era’, Speech at CBA Global Markets Conference Sydney, 22 October.
3 Their design aims to provide sufficient control of short-term interest rates, while still encouraging activity in private markets and not exposing the RBA balance sheet to more risk than necessary. See Kent C (2025), ‘The RBA’s Monetary Policy Implementation System – Some Important Updates’, Speech at KangaNews Debt Capital Markets Summit, Sydney, 2 April.
4 The ES rate is set 10 basis points below the cash rate target and the OMO rate 10 basis points above the cash rate target.
5 The cash rate has also risen back to target, but this is so far off quite narrow activity. Rates on some repos have moved closer to the OMO rate, including for broader (GC2) collateral and terms of a few weeks.
6 To some extent, the decline is likely to also reflect a shift in survey wording. Previously, banks were asked about the reserves they ‘expect’ to hold as system reserves reach ample levels. The most recent survey asks banks their ‘minimum’ and ‘target’ holdings (which inform the lower and upper estimates of demand presented here, respectively). Even so, the survey results are consistent with a decline in demand, while market prices, OMO usage, and liaison discussions with banks also point to the same conclusion.
7 For a discussion of the drivers of reserves demand, see Bristow L (2024), ‘Modelling Reserve Demand with Deposits and the Cost of Collateral’, RBA Research Discussion Paper No 2024-08.
8 Many central banks have been looking to make sure their frameworks are robust to a world of higher, but uncertain and variable reserves demand. It is worth noting that the US Federal Reserve is currently reviewing its own ‘ample’ reserves framework. While similar in name, the Fed operates quite differently to the system in Australia and several other central banks – with a system where reserves are determined by the actions of the central bank. See Warsh K (2026), ‘Semiannual Monetary Policy Report to the Congress’, Testimony to US Committee on Financial Services, 14 July; Anderson AG, A Barbarino, AM Diercks and S Miran (2026), ‘A User’s Guide to Reducing the Federal Reserve’s Balance Sheet’, FEDS Paper, March; and for a comparison with full-allotment systems: Williams JC (2025), ‘Theory and Practice of Monetary Policy Implementation’, Remarks at the ECB Conference on Money Markets, Frankfurt, 7 November; and Beckworth D (2025), ‘A New Plumbing System for Central Banks?’, 9 April.
9 There is evidence that extended periods of excess reserves can lead to market atrophy, facility stigma, rise in banks’ liquidity risk exposures, resulting in reliance on high levels of reserves. See Acharya VV, RS Chauhan, R Raja and S Steffen (2024), ‘Liquidity Dependence and the Waxing and Waning of Central Bank Balance Sheets’, NBER Working Paper No 31050; and Borio C (2023), ‘Getting Up From the Floor’, BIS Working Paper No 1100.
10 Or demand might prove quite rigid – in which case there might be little signal that we’re approaching it and conditions could change quickly.
11 When an AGS bond held by the RBA matures there is no direct effect on reserves (RBA bond holdings and Australian Office of Financial Management (AOFM) deposits with the RBA both decline). But there is an indirect drain of reserves when a replacement bond is issued in the market by the AOFM. When a semi-government bond matures, there is a direct withdrawal of liquidity as the borrowing authority pays from a commercial bank account to the RBA.
12 When an AGS bond held by the RBA matures, the AOFM will raise the funds to repay the RBA by issuing new AGS bonds to private market investors. This increases the supply of AGS bonds available to the private market.
13 See Kent, n 3.
14 For example, see Schnabel I (2025), ‘Towards a New Eurosystem Balance Sheet’, Speech at the ECB Conference on Money Markets, Frankfurt am Main, 6 November; Saporta V (2024), ‘Let’s Get Ready to Repo!’, Speech at Association for Financial markets in Europe, London, 22 July; and Silk, n 2.
15 Other than cross-currency basis swaps (CCBS), which we have used in more recent years to obtain foreign currency reserves.
16 While these operations present a low risk to the RBA, we would consider different exposures when deciding the mix of operations. For example, short-term AGS involve a small amount of interest rate risk. But shorter-term operations such as repo or FX swap involve more turnover and so some more operational risk.
17 Open repos are contracted on an ‘open basis’ – that is, without an agreed maturity date. The interest rate on these open repos is set at the ES rate, meaning there is no opportunity cost to banks from obtaining reserves under open repo. The facility is drawn in advance, unlike other standing facilities.
18 See Debelle G (2013), ‘The Impact of Payments System and Prudential Reforms on the RBA’s Provision of Liquidity’, Address to the AFMA and RBA Briefing, Sydney, 16 August.
19 See, for example, Dolan S and M Roberts-Sklar (2025), ‘Learning to Navigate Bumps in the Road’, BoE Insights, 8 December; Fontaine JS, N Maru and S Tchamova (2026), ‘A Buoy on Funding Tides: How Client Repo Demand and Dealer Constraints Lifted CORRA’, Bank of Canada Staff Analytical Paper No 2026-15; and Thedéen E (2025), ‘The Banks Need to Have More Active Liquidity Management’, Speech at Sveriges Riksbank, Stockholm, 11 September.
20 The intraday facility has also continued to be used throughout the period of excess reserves, and is used on a daily basis by counterparties.
Underlying data
You can download the underlying data file for all data that are available for public release.
Some graphs in this article were generated using Mathematica.