
Speech A Wage-price Spiral: What are the Chances?
Iain Ross AO*
Monetary Policy Board member
University of Melbourne Centre for Employment and Labour Relations Law
– Melbourne
Introduction
I am joining you this evening in my role as a member of the Monetary Policy Board of the Reserve Bank of Australia (RBA).
Let me provide a little context before I turn to my topic.
The 2023 Review of the RBA recommended that external members of the Monetary Policy Board give at least one speech or public engagement a year. That recommendation was adopted in the 2025 Statement on the Conduct of Monetary Policy. The Statement records the common understanding of the Board and the Government on key aspects of Australia’s monetary and central banking policy framework.
So, my speech fulfils that commitment. Of course, while I am speaking in my capacity as a Board member – one of nine members – I am expressing my own views. I am not purporting to speak on behalf of the Monetary Policy Board or the RBA. I am sure you appreciate and understand that distinction. Finally, I should mention that as required by the Reserve Bank Act 1959, I made a declaration of secrecy before I started to perform my duties as a Board member. That declaration requires me to maintain confidentiality in relation to the affairs of the Board and the RBA.
Well, enough context, let’s get on with the show.
I want to talk about wage-price spirals. The ‘threat’ of rising wages has been a persistent theme in the financial press since inflation began rising sharply from mid-2021. A number of media commentators have raised the risk of a wage-price spiral – pointing to the 1970s when the oil price shock collided with large pay rises flowing through the economy.
I take a different view.
I want to begin by looking at the historical evidence of wage-price spirals. In particular, the episode in Australia in the 1970s and 1980s and the structural factors that contributed to that episode.
My central point is that the labour market framework of today is very different to that of the 1970s and 1980s.
The overall thesis is that there is no evidence of the emergence of a wage-price spiral in the present circumstances and recent data suggest such an outcome is unlikely.
What is a wage-price spiral?
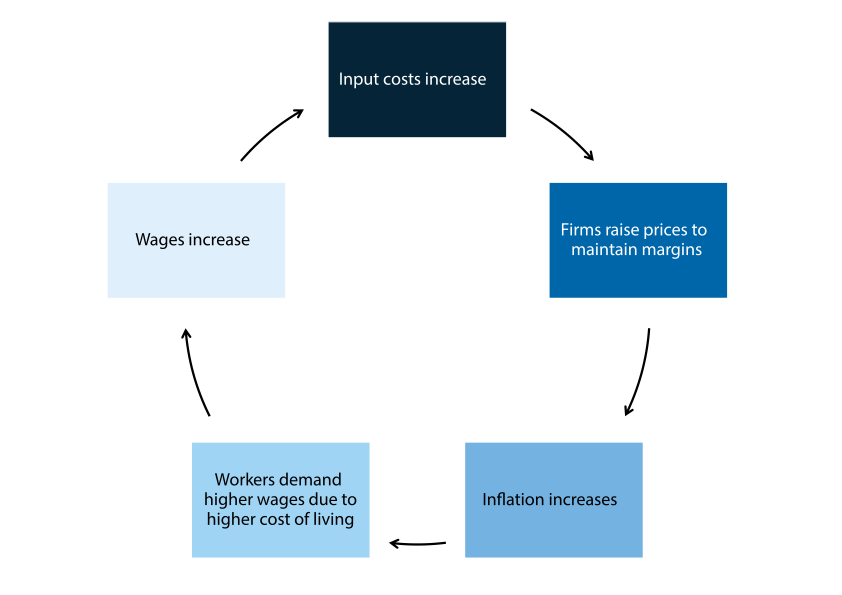
So, what is a wage-price spiral?
The wage-price spiral story goes that, following an increase in aggregate demand or an external cost shock, firms raise their prices, pushing up inflation (Figure 1). Workers will also want higher wages to maintain their real wages. If they think that inflation will continue to be high, they may push for particularly large wage increases. This will in turn feed into higher costs, and prices, and so on, amplifying the inflationary effects of the initial shock. So, expectations play an important role here. Inflation dynamics might also become more drawn out if prices and wages are sticky, and so the adjustment processes take time to occur.
Historical evidence on wage-price spirals
Historical experience can help us understand how often wage-price spirals occur and the conditions that allow them to develop.
In an IMF paper, Alvarez and his co-authors define a wage-price spiral as an episode in which year-ended consumer price inflation and nominal wages growth increased successively for three out of four consecutive quarters.2
Across 31 advanced economies, they identify 79 wage-price spiral episodes between the 1960s and 2022. They find that these episodes have become less prevalent since the 1980s, with their prevalence remaining fairly stable since the 2000s.
Only a small minority of these episodes were followed by a sustained acceleration in both wages and prices. More commonly, inflation and nominal wages growth stabilised, leaving real wage growth broadly unchanged.
The historical evidence therefore suggests that an acceleration in nominal wages does not, by itself, indicate that a persistent wage-price spiral is taking hold. The more important question for present purposes is what might allow an initial shock to be propagated through wage and price-setting decisions, amplifying its effects and making them more persistent. Australia’s experience in the 1970s provides a useful case study.
Australia’s experience in the 1970s
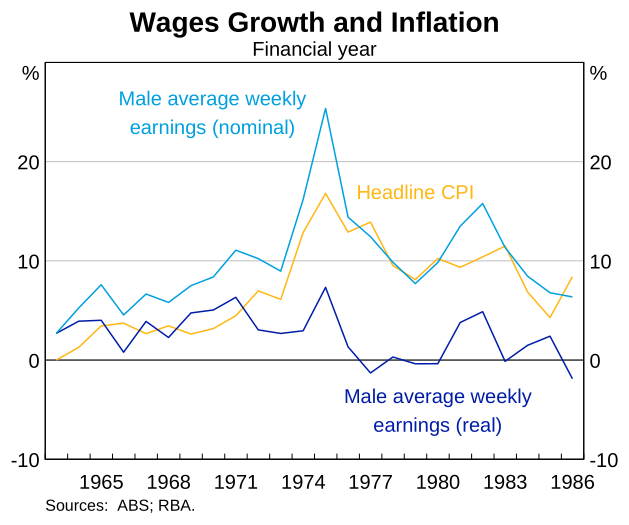
At the time it was referred to as the ‘1974 wage explosion’. As seen in Graph 1, inflation increased significantly from 1969 to 1974, from 3 per cent to over 16 per cent. In 1973, year-ended growth in male average weekly earnings picked up sharply, reaching 25 per cent in 1974.3
This episode unfolded in three main phases:
- From 1969 to 1974, inflation rose sharply, while unemployment increased slightly.
- From 1974 to 1981, inflation remained high, averaging almost 11 per cent, while unemployment rose from 2½ per cent to 6 per cent.
- From 1981 to 1983, inflation remained around 10 per cent, while unemployment increased further to 10 per cent.
While strong nominal wages growth was not the only source of inflation during this period, it was an important contributing factor. As Jeff Borland has pointed out, the wage explosion reflected a combination of economic and institutional conditions.4
One was strong labour demand. The increase in inflation occurred during a period of economic expansion. Employment increased, while overtime and vacancies reached high levels.5 A second was an increase in inflation expectations. The third was the operation of Australia’s wage-setting institutions. Two features of the wage-setting institutions in this era were particularly important: comparative wage justice and wage indexation.
Comparative wage justice
I want to emphasise the importance of comparative wage justice in this context. The concept of comparative wage justice was pervasive in the 1970s and 1980s. The doctrine of comparative wage justice was defined by the Commission to mean: ‘employees doing the same work for different employers or in different industries should by and large receive the same amount of pay irrespective of the capacity of their employers or industry’.6
To unions, comparative wage justice conveyed something more, it was ‘an iron law or wage relativity rigidity which causes wage movements in one group to be transmitted to others’.7
The metals unions’ campaigns in the 1970s and 1980s are a clear example of how changes in one industry transmitted more broadly.
The metal trades unions embarked on a campaign of collective bargaining at the enterprise level in pursuit of their claim for significant flat dollar wage increases and the 38-hour working week. Agreements were reached at the enterprise level – these agreements were usually of short duration and were not required to be approved by the Commission. Importantly, entering into an agreement did not prevent the union from engaging in industrial action or seeking to reopen the agreement in pursuit of a higher wage outcome. Once the number of enterprise level agreements had reached a ‘critical mass’ the metal trades unions and the relevant employer organisation, then the Metal Trades Industry Association (MTIA), would reach an agreement which then applied to all of MTIA’s members. The parties would then seek to vary the Metal Trades Award, by consent. The Commission had limited capacity to refuse the approval of such a consent arrangement. Once the parties’ collective bargain was reflected in the award, it became, in practical terms, an industry-wide arrangement. Given the centrality of the metals trades award at that time and the operation of comparative wage justice, the increases then spread throughout the award system.
In December 1982 the Commission endorsed a new Metal Trades Award reflecting a consent arrangement between the metal unions and the MTIA that involved a $20 per week wage increase, acceptance of a 38-hour working week, a $14 mid-year adjustment (a projection of likely inflation over the first half of the one-year agreement) and a 12-month ‘no extra claims’ clause. At that time, the Metals Trades Award was generally accepted as a ‘pattern setter’.8
Similar consent arrangements were endorsed in other sectors, notably those pursued by the Meat Industry Employees Union, the Federated Storeman and Packers Union and the Transport Workers Union.
Wage indexation
The indexation of wages to the Consumer Price Index (CPI) provided a separate channel through which wage pressures could persist. Quarterly wage indexation was introduced from early 1975. This later shifted to partial indexation and then six-monthly indexation, before being formally abandoned in July 1981.
Wage indexation was intended to limit further declines in real wages by linking later wage adjustments to past inflation. In doing so, it also provided a channel through which past inflation could feed into subsequent wage decisions.
Other factors also contributed to aggregate wages growth during this period, including the equal pay decisions of 1969 and 1972.9
The experience of the 1970s therefore reflected a particular combination of economic and institutional conditions. Strong labour demand and rising inflation expectations added to wage pressures. Comparative wage justice helped transmit wage increases across workers and industries, while wage indexation carried the effects of past inflation into later wage decisions. The relatively short duration of enterprise agreements, and the scope to reopen them or pursue further claims, also allowed wage outcomes to be revisited more readily. Together, these conditions allowed wage and price pressures to become more persistent.
Current institutional arrangements
The situation today is very different. Comparative wage justice no longer plays the pervasive role it once did, and quarterly indexation is not a feature of the current system. Importantly, the current system also limits how frequently wage claims can be revisited and how readily outcomes can spread across the economy:
- Modern awards operate as a minimum safety net and the circumstances in which modern award minimum wages may be adjusted are limited. There is effectively no scope to adjust minimum award rates to reflect the outcome of collective bargaining at the enterprise level.
- The Fair Work Act 2009 limits the general adjustment of all modern award minimum wage rates to one annual wage review.
- Enterprise agreements acquire legal force upon approval by the Commission. The average nominal term of agreements lodged over the year to March 2026 was three years. During this term the employees covered by the agreement cannot lawfully engage in industrial action in pursuit of further claims.
- The sanctions for engaging in such industrial action are readily enforceable and effective.
These changes in Australia’s wage-setting mechanisms have made the wage-price dynamics of the 1970s much less likely to recur. The current enterprise bargaining arrangements, in particular, effectively operate as a shock absorber by constraining the bargaining capacity of those who are the subject of enterprise agreements. Such employees are unable to pursue claims for increased wages until the enterprise agreement to which they are subject has passed its nominal expiry date.
In addition, because enterprise agreements have different nominal expiry dates, opportunities to renegotiate wages are staggered across the workforce rather than arising simultaneously. The next graph illustrates the extent of this staggering.
Enterprise agreements and wage adjustment
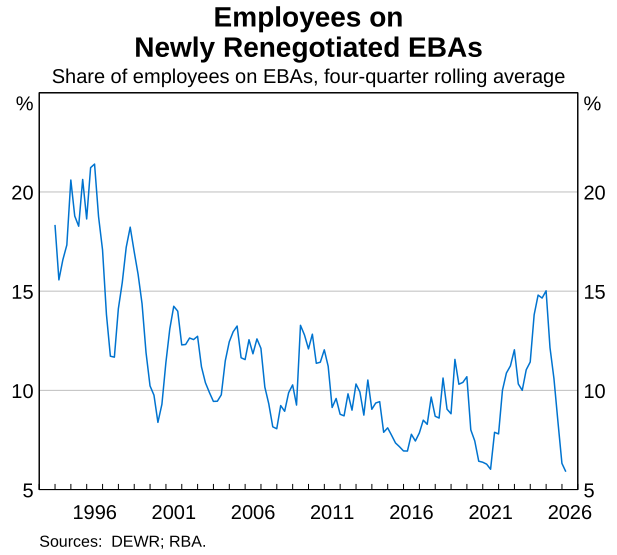
Graph 2 shows the share of employees covered by enterprise agreements who are on a newly renegotiated agreement in a given quarter. Since 2000, that share has generally been around 10 per cent, although it has varied over time.
This means that only a relatively small share of employees covered by enterprise agreements moves onto a newly negotiated agreement at any one time. An increase in inflation therefore cannot flow immediately into new wage outcomes for all employees covered by enterprise agreements. Instead, adjustment occurs progressively as agreements expire and new agreements are negotiated.
Changes in the bargaining environment
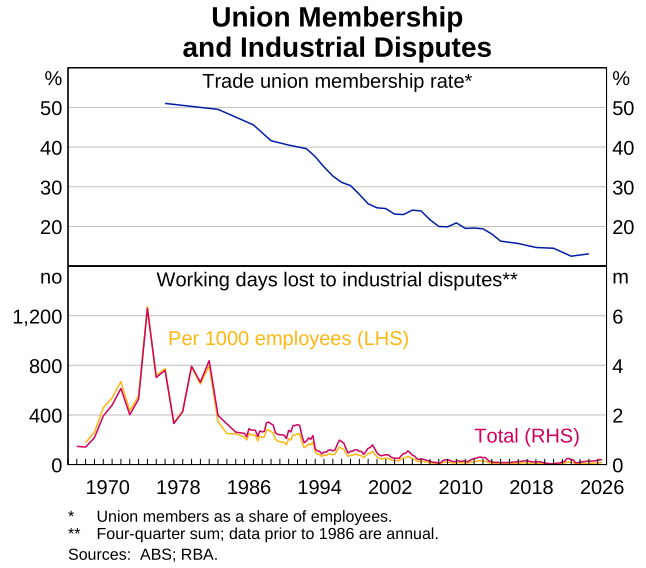
The bargaining environment is another important difference from the 1970s. One relevant structural change since the 1970s has been the decline in union membership.
As shown in the top panel of Graph 3, slightly more than half of employees were union members in the late 1970s. That share has declined substantially and is now 13 per cent. Union membership is lower in the private sector, at 7.9 per cent in 2024, and higher in the public sector, at 33.2 per cent. The lower panel shows that industrial disputation has also declined sharply. The number of working days lost to industrial disputes is much lower than it was in the 1970s and 1980s and has remained at very low levels since around 2012.
As a general proposition, lower union density may reduce workers’ bargaining power and, in turn, weigh on wages growth. But the relationship is not straightforward, and the extent to which declining union membership has contributed to lower wages growth is contested.10
Other structural changes, including declining firm entry and dynamism and the wage effects of employer concentration, may also have reduced workers’ bargaining power.11 Taken as a whole, these changes point to a substantially different bargaining environment from that of the 1970s, with less scope for wage outcomes secured by one group to be propagated across the economy.
Another key difference from the 1970s is that inflation expectations are better anchored, and less likely to change in response to a temporary inflationary shock. A key contributor to this was the introduction of inflation targeting and the RBA’s clear commitment to low and stable inflation. This matters because it reduces the likelihood that a temporary rise in inflation will become embedded in wage and price-setting decisions and develop into a self-sustaining process. Together with changes in the institutional and bargaining environment, these differences have significantly reduced the likelihood of a wage-price spiral in Australia.
The recent data provide further reassurance: there is little evidence that a self-sustaining wage-price spiral has emerged following the latest inflationary episode.
Wages growth and inflation
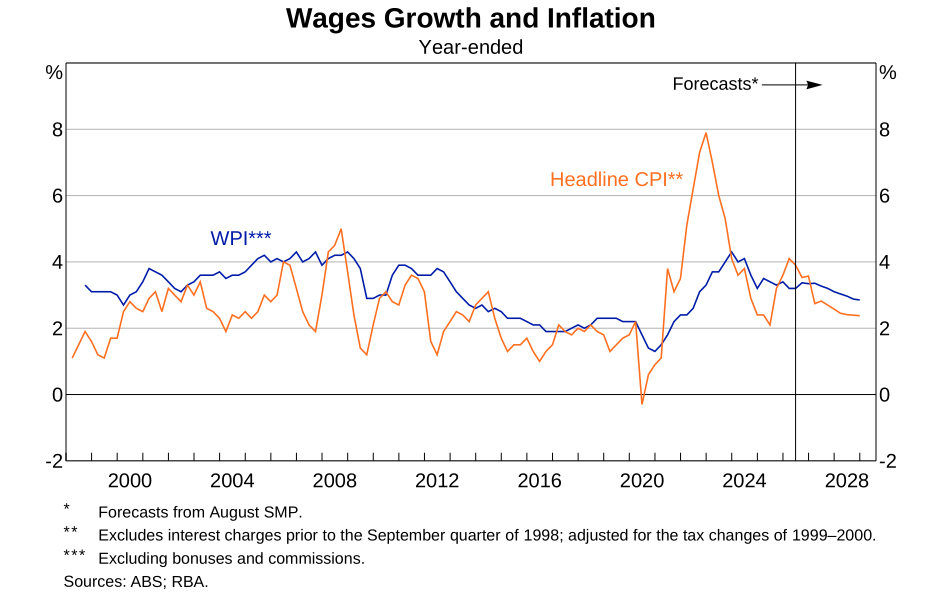
Inflation began to rise in 2021 as pandemic-related supply disruptions coincided with a strong recovery in demand. The sharp rise in energy prices following Russia’s invasion of Ukraine in February 2022 added a further inflationary shock. As shown in Graph 4, inflation rose much earlier and more sharply than growth in wages, as measured by WPI. WPI growth subsequently picked up, but more slowly and by less than inflation, resulting in a decline in real wages. Since then, inflation has declined substantially from its peak and, although wages growth has also eased, real wages have recovered somewhat.
Looking forward, the forecasts published in the August 2026 Statement on Monetary Policy point to a modest pick-up in WPI growth in the near term. Further out, wages and broader labour cost growth are expected to moderate, while inflation is expected to decline gradually to the midpoint of the target range in early 2028.
Measures of real labour income
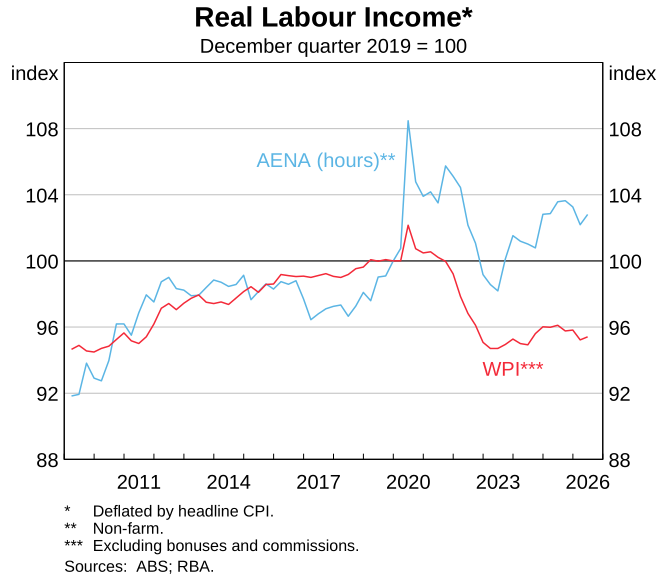
The WPI is not the only measure of wages in Australia, and the extent of the recent recovery in real wages depends on the measure used. Graph 5 compares real WPI with real average earnings from the national accounts, or real Average Earnings National Accounts (AENA). Both measures are adjusted for inflation, but they capture different concepts.
The WPI measures changes in wage rates for a fixed set of jobs. It abstracts from changes in the composition of employment and excludes bonuses and commissions. Real WPI declined steadily as inflation outpaced wages growth and remains below its pre-pandemic level.
AENA is a broader measure of labour income per hour. It includes bonuses and commissions and can also reflect changes in the composition of employment, including workers moving between jobs with different levels of pay. Real AENA initially declined as inflation rose, but has since recovered and remains above its pre-pandemic level. The recovery in real AENA points to a more substantial recovery in broader labour income than is evident from real WPI.
Looking ahead, the path of wages growth will also depend on broader economic conditions. Strong labour demand was an important feature of the 1970s episode, so I will turn next to the labour market.
Labour market conditions
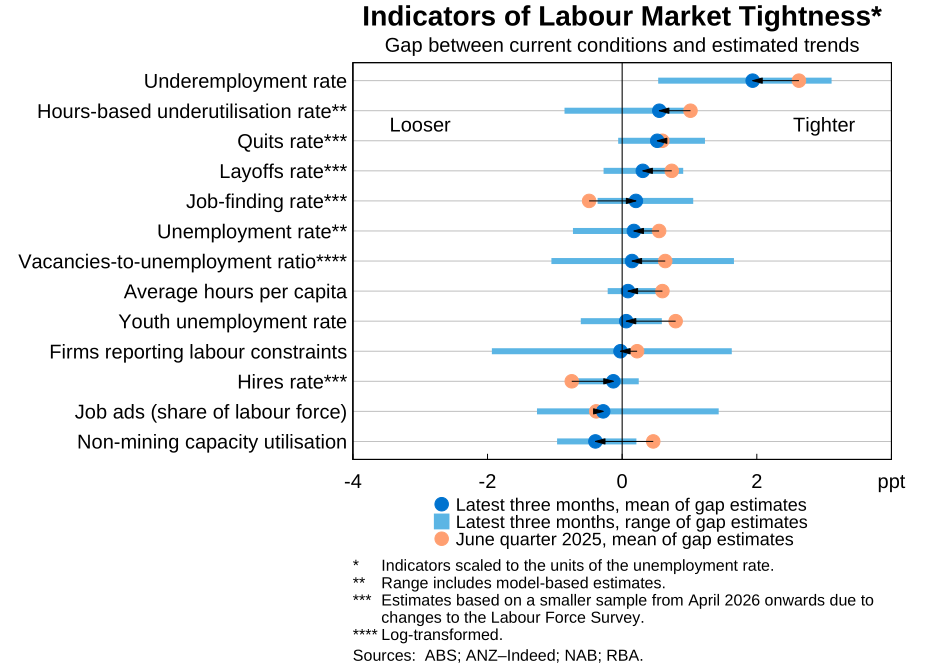
The labour market has eased over the past year. The unemployment rate increased to 4.5 per cent in the month of July, from 4.2 per cent a year earlier. As shown in Graph 6, the easing has also been evident across a broad range of indicators.
This is a simplified version of the graph published in the August 2026 Statement on Monetary Policy, and removes indicators that are currently on hold during the modernisation of the Labour Force Survey. Compared with the June quarter of 2025, most indicators have eased and moved closer to balance. This includes increases in underemployment and hours-based underutilisation. The RBA’s assessment in the August Statement was that conditions remained a little tighter than full employment.
The forecasts in the August Statement are for subdued growth in aggregate demand to help bring the economy into better balance. Labour market conditions are expected to ease gradually, with some spare capacity emerging by the end of the forecast period, while labour cost growth moderates from an elevated rate. As capacity and cost pressures subside, inflation is expected to decline gradually to the midpoint of the target range.
Real wages and productivity
Before concluding I want to touch on another factor that acts as a key determinant of real wage growth, namely productivity.
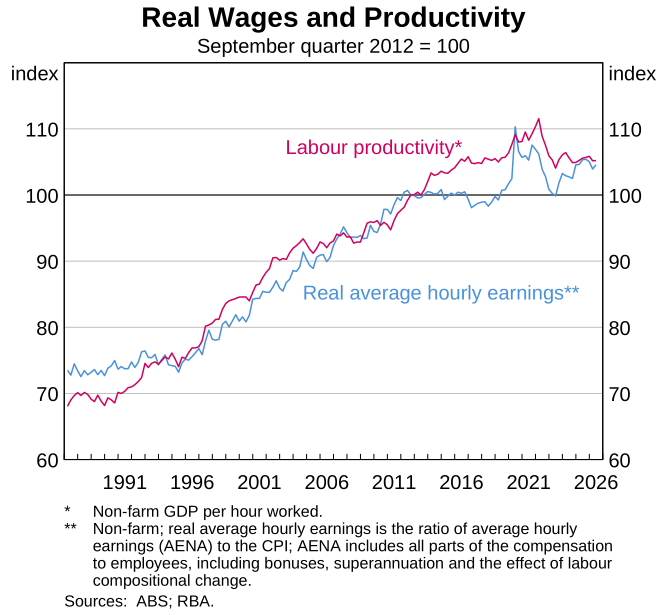
Productivity refers to how much output is produced relative to the inputs used in production. Labour productivity, which is the measure shown in Graph 7, is the amount of output produced for each hour worked. When labour productivity increases, the economy can produce more goods and services from the same amount of labour. This supports growth in incomes and purchasing power and, ultimately, higher living standards.
Productivity also matters for the relationship between wages and inflation. When wages rise alongside productivity, labour costs per unit of output do not increase by as much. This means that wages can rise without generating the same build-up in inflationary pressure, allowing real wages to increase sustainably over the medium term.
Graph 7 compares labour productivity with real average hourly earnings from the national accounts. I use average earnings here because it is a broad measure of labour income per hour and is more closely linked to productivity than the WPI.12
Over the longer run, real earnings and labour productivity tend to move together. Both have risen notably over the inflation-targeting period, at an average annual rate of around 1 per cent.
In the short run, real earnings and labour productivity can diverge. This was most notable in the mid-to-late 2010s when growth was subdued across a range of labour cost measures, including both WPI and AENA. This weakness partly reflected spare capacity in the labour market, lower inflation and the adjustment that followed the mining investment boom. But wage growth remained weaker than these factors alone could explain. Possible structural explanations include lower job mobility, greater job insecurity and reduced worker bargaining power, although the evidence is not conclusive.13
Looking ahead, the rate of productivity growth is a key driver of the pace at which real wages can sustainably rise. Productivity growth has slowed in Australia over recent decades, as it has in many other advanced economies.
Productivity growth is an enabler and a constraint on real wages growth. Real wages can grow faster or more slowly than productivity for a time. But over the longer run, productivity growth is needed to generate sustainable increases in real wages and to lift living standards. It is in our collective interest to improve Australia’s productivity performance.
Endnotes
* The views expressed in this speech are my own and not necessarily those of the RBA. I would like to thank Georgia Wiley for her assistance in preparing this speech, and Jonathan Hambur for his comments.
1 Figure 1 is adapted from Suthaharan N and J Bleakley (2022), ‘Wage-price Dynamics in a High-inflation Environment: The International Evidence’, RBA Bulletin, September.
2 Alvarez J, J Bluedorn, N-J Hansen, Y Huang, E Pugacheva and A Sollaci (2022), ‘Wage-Price Spirals: What is the Historical Evidence?’, IMF Working Paper No 22/221.
3 Male average weekly earnings are used because they provide a consistent historical wages series over this period. The Wage Price Index (WPI) is only available from 1997.
4 Borland J (2022), ‘Stagflation in Australia in the 1970s: What Happened and Implications for Today?’, Labour Market Snapshot No 89, June.
5 National Wage Case (1974) 157 CAR 293.
6 National Wage Case (1970) 134 CAR 165.
7 Plowman D (1980), ‘National Wage Determination in 1979’, Journal of Industrial Relations, 22(1), pp 79–89.
8 Wright M (1982), ‘Wage Policy and Wage Determination in 1981’, Journal of Industrial Relations, 24(1), pp 69–76.
9 The 1969 ‘equal pay for equal work’ decision and the 1972 ‘equal pay for work of equal value’ decision progressively raised the minimum wage for women from 75 per cent of the male minimum wage to 100 per cent. As Glenn Stevens observed, ‘The moral and social aspects of this issue aside, it seems clear that moves to increase females’ wages to be commensurate with males’ resulted in a substantial rise in aggregate labour costs’. See Stevens G (1992), ‘Inflation and Disinflation in Australia: 1950–91’, RBA Annual Conference, p 14.
10 Using data on federally registered enterprise agreements between 1991 and 2017, Bishop and Chan found no decline in the share of employees covered by agreements negotiated with union involvement, even as union membership fell. They also found that the union wage growth premium in the private sector had remained stable over time. See Bishop J and I Chan (2019), ‘Is Declining Union Membership Contributing to Low Wages Growth?’, RBA Research Discussion Paper No 2019-02.
11 Hambur J (2023), ‘Did Labour Market Concentration Lower Wages Growth Pre-COVID?’, RBA Research Discussion Paper No 2023-02.
12 WPI tracks wage growth for a fixed basket of jobs and therefore abstracts from some wage growth associated with productivity, including that arising when workers move into higher-paid, more productive jobs. RBA estimates suggest that, on average, WPI captures around half of trend productivity growth, although this relationship varies over time.
13 See the papers and discussion in RBA (2019), Low Wage Growth, Proceedings of the RBA Annual Conference, Reserve Bank of Australia, Sydney.
Underlying data
You can download the underlying data file for all data that are available for public release.