Speech Low Inflation

Guy Debelle[*]
Deputy Governor
Address at The Economic Society of Australia (QLD) Business Lunch
Brisbane –
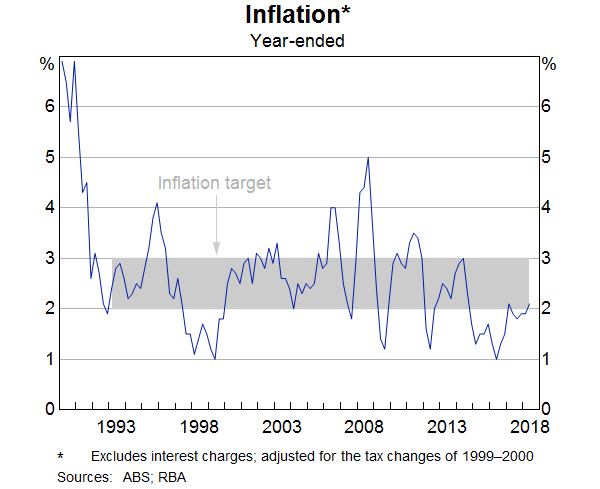
The inflation rate is currently just over 2 per cent (Graph 1). This is consistent with the inflation target for the Reserve Bank agreed between the Governor and the Treasurer. However, that follows a period where inflation has been a little below target for a number of quarters. While inflation has averaged 2½ per cent since the inflation target was introduced, over the past three years it has averaged 1.8 per cent (Table 1).
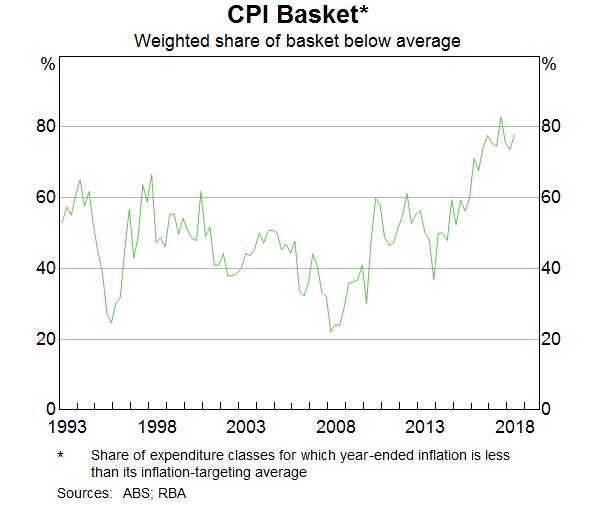
How broad based has the recent decline in inflation been? In 2016, only around one-quarter of the CPI basket had an inflation rate of above 2.5 per cent.[1] In the June quarter this had risen but only to 40 per cent. To look at it another way, in recent quarters around 80 per cent of the basket had an inflation rate below its inflation-targeting average (Graph 2).
There are a number of macroeconomic forces at work that have contributed to these outcomes, but today I am going to focus on some of the individual price developments that underpin the aggregate inflation outcome.[2] I will examine pricing dynamics at a more disaggregated level and how these dynamics have changed in recent years. An understanding of these changing dynamics and what might be behind them is useful in assessing the outlook for inflation. Important drivers of recent lower outcomes include competition in the retail sector, historically low increases in rents, low wages growth and slower growth in some administered prices.
| Effective weight | Average since 1993 | Average since 2015 | |
|---|---|---|---|
| Retail | 30 | 1.2 | −0.1 |
| Consumer durables(b) | 15 | 0.1 | −0.8 |
| Food(c) | 7 | 2.4 | −0.1 |
| Fruit and vegetables | 2 | 3.2 | 1.1 |
| Alcoholic drinks | 4 | 2.7 | 1.6 |
| Non-alcoholic drinks | 1 | 2.3 | −0.5 |
| AVC and telecommunications equipment | 4 | −2.8 | −4.7 |
| Housing(d) | 17 | 3.0 | 1.9 |
| New dwelling purchase | 8 | 3.5 | 2.8 |
| Rents | 7 | 2.9 | 0.7 |
| Dwelling maintenance and repair | 2 | 2.2 | 2.2 |
| Administered prices | 19 | 4.4 | 3.8 |
| Utilities | 4 | 4.5 | 4.2 |
| Education | 4 | 5.1 | 3.2 |
| Health | 5 | 4.3 | 4.0 |
| Other administered | 5 | 4.0 | 3.6 |
| Market services(e) | 18 | 2.9 | 2.0 |
| Tobacco | 3 | 8.4 | 13.9 |
| Automotive fuel | 3 | 3.3 | 6.7 |
| Holiday travel and accommodation | 6 | 2.2 | 0.8 |
| Headline CPI(f) | 100 | 2.5 | 1.8 |
| Trimmed mean(f) | 70 | 2.6 | 1.8 |
|
(a) Adjusted for the tax changes of 1999-2000 (b) Excludes audio, visual and computing equipment (c) Excludes fruit, vegetables, meals out and takeaway food (d) Excludes administered prices (e) Excludes domestic travel and telecommunications equipment and services (f) Excludes interest charges and indirect deposit and loan facilities Sources: ABS; RBA |
|||
Retail
One of the factors having a significant impact on inflation outcomes in recent years has been increased competition in the retail sector. Prices of many retail items have been steady or falling over recent years. Since 2015, retail prices have declined on average. The price of the typical food basket has not increased all that much over the past 10 years, while the prices of consumer durable items such as fridges and furniture (adjusted for improvements in the quality of the goods) have not changed noticeably over the past 25 years (Graph 3). Most notably, the prices of audiovisual equipment have declined by 90 per cent over the past 25 years (see below). In the case of consumer durables and audiovisual equipment, technological improvement has clearly been an important factor, but competition in the retail sector has also played a significant role.

One way of illustrating the effect of competition on retail prices is by examining the changing dynamics of exchange rate pass-through. That is, the way that changes in the exchange rate affect price changes for retail items.
Graph 4 illustrates that changes in the exchange rate typically pass through quickly to import prices for retail goods. That is, the prices of imported goods at the docks tend to move very much in line with movements in the exchange rate (first-stage pass-through). When the exchange rate depreciates, these at-the-dock prices increase. This relationship hasn't changed much over the past 25 years.
In the two decades up to 2010, these changes in import prices at the docks tended to be passed on to the retail prices faced by consumers. However, over the past decade or so there has been a shift in these pricing dynamics for retail goods.

While slower growth in consumer spending over this time frame compared with the earlier period has probably played a role in explaining retailers' reluctance to pass on higher import prices, it is the structural changes underway in the retail sector that are putting downward pressure on prices.
One aspect of this is that the internet, and technology more generally, have meant that foreign retailers can now compete with local retailers for online shopping, which is a small but rapidly growing part of the retail market. In June, online sales made up around 5 per cent of total retail trade according to the Australian Bureau of Statistics (ABS); however, the value of online sales has grown by 50 per cent over the past year. This competitive pressure is not confined to online market share, with a number of large foreign retailers also setting up ‘bricks and mortar’ retail operations in Australia. In addition to the direct competition from this source, there is also greater information about prices, which has allowed households to comparison-shop more easily and negotiate greater discounts off listed prices.
Competition is not directly observable, but we can look at some proxies for it to assess how it has changed. Two proxies for competition are mark-ups and margins. Mark-ups measure the ratio of a firm's sale price to its marginal cost (i.e. the cost of supplying one more unit of the good) (Graph 5). Net margins capture the ratio of prices to the average cost of production (Graph 6). When competition increases, this is likely to put downward pressure on mark-ups and margins.


Both of these proxies show some evidence of increased competition. Measures of retail mark-ups constructed using the firm-level Business Longitudinal Analysis Data Environment (BLADE) database peaked in 2011/12, and have generally declined since then.[3] While these data are only available until 2014/15, more timely data on retail net margins show a similar story, with net margins for food and other retailers declining over the past few years.
Companies have responded to the increased competition by reducing their costs and improving their productivity. This has been evident in the retailers themselves as well as their supply chains. This has put further downward pressure on prices. Labour productivity growth in the retail sector has averaged 3½ per cent since 2010, quite a lot faster than that in the economy as a whole (although growth hasn't obviously picked up in recent years as it grew at a similar fast pace in the five years prior to 2010).
How retail competition plays out over the period ahead is one of the uncertainties for the Bank's inflation forecast. There have already been foreign entrants into many parts of the retail sector in recent years, which have driven down margins in the sector. But there are other entrants who are only just establishing their foothold, which suggests that they, at least, regard the current level of margins as still quite attractive, notwithstanding the decline over recent years. Our expectation is that these forces still have some way to run.
In contrast, there is some prospect that the effect of margin compression on the rate of food price inflation could be near an end. Recent commentary by market analysts suggests that the transition by some supermarkets to ‘every day low price’ strategies may have run its course.
Furthermore, in coming quarters food prices are going to be affected by the severe drought in some parts of the country. Based on what happened in previous droughts, we expect meat prices to decline initially as slaughter rates increase, but then to rise beyond that. The impact on fruit and vegetables prices is less clear. It is worth noting that the ABS now uses scanner data and is better able to capture ‘low-level substitution bias’ in the CPI than in the past – i.e., if households shift away from more expensive drought-affected foods to other foods. This would mitigate the impact of the drought on inflation.
Technology
Beyond the effect of technology in contributing to greater price transparency and facilitating increased competition in the retail sector, it has obviously had a direct effect on the prices of a number of retail goods, most obviously audiovisual and communication goods such as TVs, computers and phones.
One thing that may not be apparent is that statistical measures of inflation are adjusted for changes in quality where possible. Advances in technology often improve the quality of products across a number of different dimensions and the ABS aim to capture this in their measure of inflation. Smartphones and tablets are a good example: changes to processing speed, data storage, camera quality, etc. have all contributed to measured declines in the prices of computers and phones (Graph 7). However, households may not necessarily see that prices of these goods have declined over time when purchasing these products, particularly if they do not value or use all the services that are bundled into their computer or phone.[4] The retail price may remain relatively constant, but the product you are getting for that price is much better quality. This shows up as a decline in the price in the CPI.

As I mentioned earlier, the prices of audio, visual and computing equipment (adjusted for quality change) have been falling steadily over the past 25 years. More recently, the prices of mobile phone handsets and plans have also fallen after the ABS updated its methodology for measuring the prices of these items. As a result, the rate of decline in this group of items has picked up to be closer to 5 per cent per annum, which by itself has taken around 0.2 percentage points off CPI inflation each year.
Price measurement when there is technological change is a long-standing challenge for statisticians. There is the challenge of appropriately capturing changes in quality and there is also the challenge of ensuring that the weights used to aggregate the prices of the various goods and services appropriately reflect households' expenditure patterns. For example, it may take some time for new goods and services to be included in the CPI basket. More generally, there is the issue of ensuring that the CPI appropriately takes account of changing expenditure patterns in response to movements in relative prices. The ABS has recently begun updating its CPI weights to reflect changing household expenditure patterns on a more frequent basis, which should reduce the size of this ‘substitution bias’ in the future.[5]
Housing
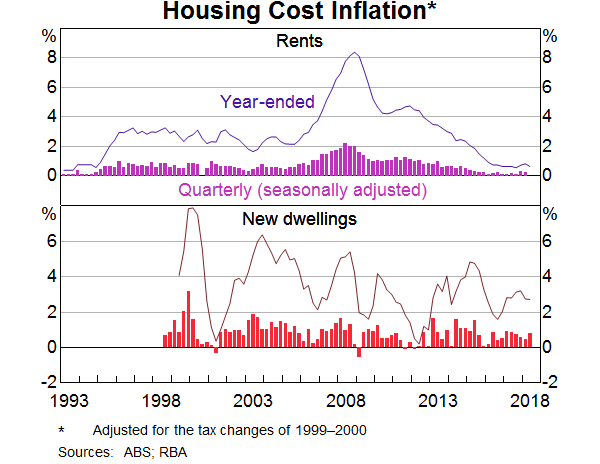
The cost of housing services has a large weight in the CPI, with the weight about equally split between the cost of building a new home and the cost of renting (Graph 8). There have been quite divergent dynamics in each of these two components in recent years.
New dwelling costs
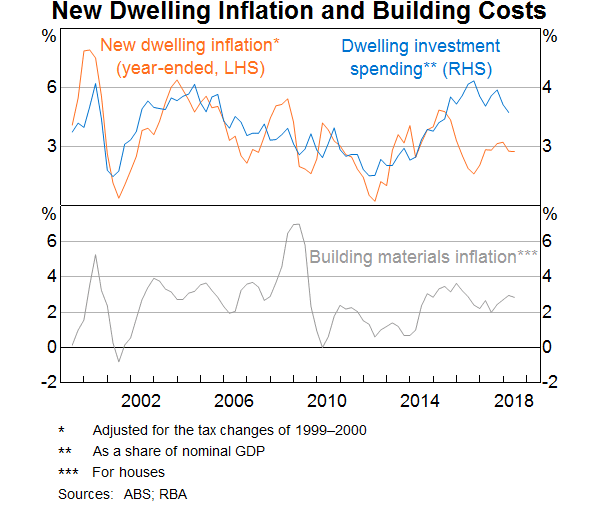
New dwelling cost inflation, which has an 8 per cent weight in the CPI basket, has tended to move closely with the residential building cycle over time (Graph 9).[6] However, despite the historically high level of activity in housing construction over recent years, new dwelling cost inflation has been running at a bit below its long-run average. During the late 2000s, new dwelling cost inflation was higher than it is currently because the residential construction sector was competing for materials and labour with the resources sector in the midst of its investment boom. This competition for inputs has clearly abated. Wages growth in housing construction has been generally contained except for some particular skills such as bricklayers, in part because workers have been moving from the resources sector as projects there finished and also reflecting the general slow pace of wages growth in the economy. Reports from liaison suggest that competition for inputs between public infrastructure projects and high-rise residential developments has put some upward pressure on new dwelling cost inflation in Sydney and Melbourne. This includes competition for labour such as engineers and project managers, as well as competition for materials such as concrete. Liaison contacts suggest that firms have also been able to limit cost inflation by switching to lower-cost building materials.
Rents
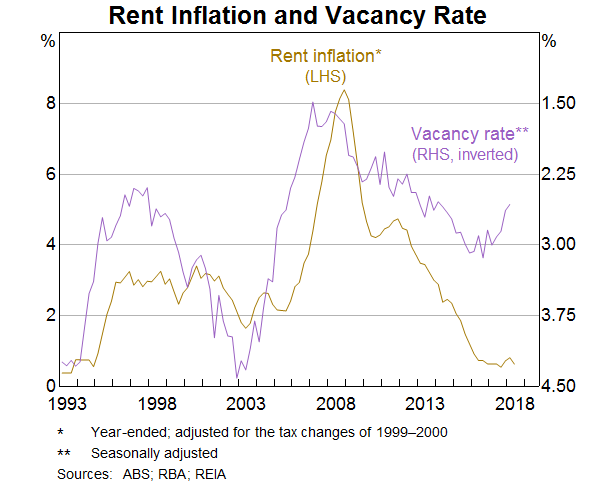
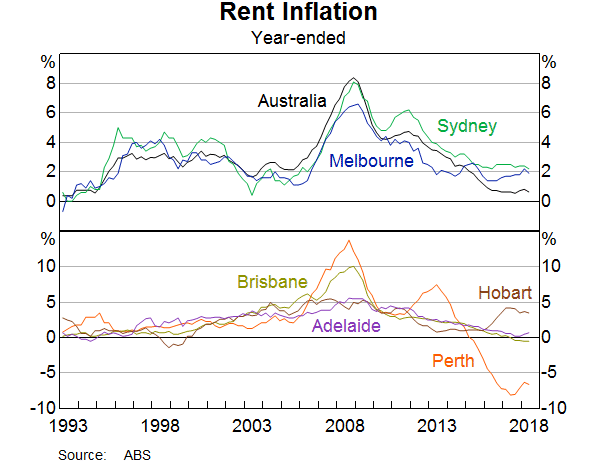
The pace of rent inflation has been falling since 2008, and year-ended rent inflation is around its lowest level since the mid 1990s. This has been a considerable drag on inflation: rental inflation was nearly 3 percentage points lower per annum in the past three years than in the previous twenty, which has reduced aggregate inflation by nearly 0.2 percentage points per annum in recent years.
The decline in rent inflation can be attributed to a mix of supply and demand side developments. As mentioned, housing construction activity has grown strongly in recent years, which has increased the supply of rental properties. Growth in the housing stock has outstripped population growth since 2014, which put downward pressure on rents.[7] Furthermore, rents are changed relatively infrequently and can be indexed to CPI inflation, so there is a self-reinforcing dynamic to this too.
The national rent inflation series masks considerable variation across capital cities. Rent inflation has been much lower in Perth than in other capital cities in recent years, indeed rents have been falling in Perth at quite a rapid rate for a number of years. The vacancy rate in Perth – that is, the share of properties that are vacant and available to rent – has more than doubled since 2008.
But slower growth in rents is not just a Perth story. Rent inflation in Sydney and Melbourne has slowed considerably in recent years reflecting the substantial additions to the dwelling stock in these cities, and notwithstanding the faster population growth, particularly in Melbourne. Rents are flat in Brisbane and Adelaide. Only in Hobart are rents growing at a high rate.
We expect the pace of rent inflation to increase gradually over the next couple of years. The vacancy rate has declined over the last year, and newly advertised rent growth has increased. However, it will take some time for the flow of new rents to materially affect the stock of rents captured in the CPI.
Service Inflation
Services make up over one-third of the CPI basket and can be split into two broad categories. The first is what can be described as market services. These are services for which pricing tends to be market-based. This includes household services such as hairdressing, financial services, and meals out & takeaway. The prices of market services are generally driven by domestic factors such as wages, commercial rents and utility prices. There is little or no competition from imports and they are not affected by movements in the exchange rate.
The second category is administered prices. These are the services for which prices are at least partly regulated, or for which the public sector is a significant provider. This includes services such as health, education and child care. It also includes utilities, which I will talk about separately.
Market services
Labour costs comprise about 40 per cent of final market services prices, which means that wages growth is a key determinant of the pace of market services inflation. Market services inflation and wages growth were both growing strongly in the run-up to the terms of trade peak in 2011 (Graph 12). More recently, wages growth has been subdued, and this has been a significant factor contributing to the slower pace of market services inflation.

There have also been a number of idiosyncratic developments that have weighed on market services inflation in recent quarters. This includes the removal of some ATM withdrawal fees in September 2017, the introduction of a CTP green slip refund scheme in New South Wales in December 2017, and the introduction of the Active Kids sports participation program in New South Wales in January 2018.
Notwithstanding these one-off developments, the outlook for market services inflation is intrinsically related to the outlook for wages. The Bank's forecast is that, as the labour market continues to tighten, wages growth should gradually pick up, and along with that we would expect market services inflation to also increase. However, as we have noted on a number of occasions, there is considerable uncertainty about the extent of unutilised capacity in the labour market and how quickly a reduction in spare capacity would translate into higher wage and price inflation. It is possible that the unemployment rate could fall faster than expected and wages growth could pick up more strongly as a result. Alternatively, it is possible that the flow of new workers into the labour force could continue to be stronger than usual, so that unemployment declines more slowly than we expect and wage pressures could take longer to emerge.
Administered prices
Administered prices have generally risen at a faster rate than other prices for the past couple of decades. One reason is that demand for administered items has grown particularly strongly over time, and is relatively insensitive to the business cycle (Graph 13; Graph 14). For example, demand for health services has increased as the population has aged and as we have become wealthier. The share of children in formal child care has also increased markedly. Another reason is that growth in unit labour costs has been a little higher in administered services than in other industries.


While administered services inflation continues to exceed the rate of inflation in other items, it has slowed since 2012. This has been broad based across the various administered components.
Education inflation is noticeably below its inflation-targeting average. In recent years, several state government initiatives have been introduced that have weighed on education inflation. These include initiatives to freeze TAFE fees and lower the cost of preschool education. Annual increases in school and tertiary education fees have been lower than usual, since some fees are indexed to wages growth and CPI inflation, both of which are subdued.
Health inflation has also been lower in recent years, although it is still one of the categories with the highest rates of inflation (Graph 15). At around 4 per cent, the most recent increase in health insurance premiums was the lowest average increase in more than 15 years.

The pace of child care inflation has also declined in recent years. On a quarter-to-quarter basis, child care inflation tends to be affected by changes in the fees that are charged by child care centres. However, many families also receive child care benefits from the government, and changes in the level of these payments are factored into the measurement of child care inflation. The last time that the child care payment system changed noticeably was in the September quarter 2008, when the child care rebate was increased to cover 50 per cent of out-of-pocket costs. It had previously only covered 30 per cent of costs. The net effect of this change was measured deflation in child care prices of over 20 per cent in that quarter.
Looking ahead, as we discussed in the recent Statement on Monetary Policy, there are a number of developments in some of these prices, which have resulted in the Bank lowering its forecast for inflation in the current (September) quarter. The education component is expected to be lower over the next few quarters because of initiatives in a couple of states to make vocational education more affordable. The recent changes to the child care benefits system that came into force on 1 July lead us to expect that the cost of child care will fall in the September quarter. However, there is considerable uncertainty around what the magnitude of this decline will be. There is also uncertainty around whether the changes will affect measured inflation in subsequent quarters. For example, child care inflation has historically increased in the March quarter since this is when families have typically reached the caps on their benefit payments. Under the new system, many families will no longer be limited by these caps, which means that child care prices could also fall in the March quarter next year.
These identifiable prices changes are likely to result in a lower inflation outcome in the September quarter, although it is possible that there are other offsetting movements in other prices that are not as apparent at this stage. We expect these price changes to be mostly confined to the September quarter but there might be further declines in administered prices in subsequent quarters because of other government initiatives to reduce cost-of-living pressures. At the same time, it is worth bearing in mind that such price changes do also boost household purchasing power. This will boost spending on other goods and services potentially leading to higher prices elsewhere.
Utilities
Utility prices have risen at a faster rate than other prices for the past couple of decades, including large rises in electricity and gas prices in 2017 (Graph 16).

The recent Australian Competition and Consumer Commission (ACCC) report into retail energy pricing outlined the factors contributing to this outcome.[8] The ACCC highlighted significant over-investment in state-owned networks in some states and that networks have recouped the cost of this over-investment from customers. Meanwhile, the supply and demand balance within the wholesale market has tightened following the retirement of some coal-fired generation capacity. High prices have also led households to increasingly make use of solar panels and energy efficient appliances, which has reduced demand for energy from the National Electricity Market. Gas generation has become an increasingly important source of energy, but the cost of this gas has increased dramatically alongside an increase in exports and domestic restrictions on further exploration. The ACCC also identified some elements of the energy market's structure that have contributed to higher bills for customers. High and rising prices are usually a signal to market participants to invest in additional supply. However, the payoff period for new energy generation assets is long, and uncertainty around energy policy has contributed to significant underinvestment in new supply.
As a result of these factors, wholesale energy prices increased markedly over the course of 2016 and 2017. Higher wholesale prices led to an increase in electricity and gas inflation, since wholesale market costs account for around 30 to 40 per cent of consumers' electricity bills.
However, these dynamics have changed quite markedly. Wholesale electricity prices have declined from their recent peak and the large volume of new renewable energy generation expected to come on line may put further downward pressure on wholesale prices (Graph 17). The recent decline in wholesale prices and an increase in competition amongst energy retailers has seen a decline in market offer prices in many states. Furthermore, many energy retailers have indicated that they will not be changing their standing offer prices in the September quarter, while others have indicated that they will be lowering their prices. As a result, we expect utility prices to decline in the coming quarters. How this plays out over the period ahead is another significant uncertainty for the Bank's inflation forecast.

Tobacco
Finally, I will briefly touch on the contribution of tobacco prices to inflation. Unlike most of the other components of the CPI I have talked about, tobacco prices have been rising at an historically fast pace.
Rising tobacco prices have been the single largest contributor to headline inflation for some time now (Graph 18). In fact, higher tobacco prices contributed 0.6 percentage points to headline inflation over the year to June 2018. The high rate of tobacco inflation reflects the introduction of a new indexation regime in December 2013, which was to see the tobacco excise increase by 12.5 per cent per year above average earnings. This regime, which was originally legislated for four years, was subsequently extended out to 2020.

Conclusion
In conclusion, I have discussed some of the dynamics that have contributed to the lower inflation outcomes in recent years. These include increased competition in the retail sector, historically low rental growth, the slow pace of wages growth and developments in some administered prices. Utilities prices have been boosting inflation for a number of years but are now expected to reduce it in the period ahead.
Our current forecast for inflation is broadly unchanged from earlier forecasts. We did revise down our expectation for inflation in the current quarter for reasons I have just discussed. Beyond the September quarter, we continue to expect inflation to be around 2¼ per cent over the next couple of years as above-trend GDP growth reduces spare capacity in the labour market and there is an associated pick-up in wages growth. We expect most of these other forces that have contributed to the recent low rate of inflation to abate but there is uncertainty about how much longer they will persist. We would like to be more confident that inflation will be sustained at a rate consistent with the target.
That said, the Australian economy remains on the path it has been for at least the past year and a half. Although inflation is likely to be a bit lower in the near term, this is expected to be temporary. Further gradual progress on both lowering unemployment and bringing inflation closer to the midpoint of the target is expected over coming years. The current accommodative stance of monetary policy will assist this outcome.
Endnotes
Thanks to Natasha Cassidy, Jonathan Hambur and Mike Read for their assistance. [*]
The Consumer Price Index (CPI) captures changes in the prices of the basket of goods and services that are consumed by households. Each individual item is categorised into one of around 90 expenditure classes. In deciding what goods and services to include in the CPI basket and what their weights should be, the ABS uses information about how much – and on what – households in Australia spend their income. These expenditure weights will now be updated on an annual basis. For more information, see RBA (Reserve Bank of Australia) (2017), ‘Box D: Updated Weights for the Consumer Price Index’, Statement on Monetary Policy, November, pp 60–63. [1]
Over the longer term, in principle, the inflation rate should be determined by macroeconomic forces and shouldn't be affected by relative price movements. But over shorter horizons, individual price movements can have a large impact. A fall in the price of one good should boost household spending power and demand for other goods and services boosting their price, but this can take some time to play out. [2]
The results of these studies are based, in part, on ABR data supplied by the Registrar to the ABS under A New Tax System (Australian Business Number) Act 1999 and tax data supplied by the ATO to the ABS under the Taxation Administration Act 1953. https://www.rba.gov.au/disclaimer/blade-disclaimer.html [3]
See Jacobs D, D Perera and T Williams (2014), ‘Inflation and the Cost of Living’, RBA Bulletin, pp 33–46 for a discussion of these issues. [4]
RBA (2017), ‘Box D: Updated Weights for the Consumer Price Index’, Statement on Monetary Policy, November, pp 60–63. [5]
New dwelling cost inflation is measured as the cost of newly built owner-occupied housing, excluding the value of the land. The price of established dwellings has no direct influence on CPI inflation. [6]
Though this came after a period of time where the growth in the housing stock lagged that of the population, which likely boosted rents. [7]
ACCC (2018), ‘Restoring electricity affordability and Australia’s competitive advantage', Retail Electricity Pricing Inquiry – Final Report, June. [8]