Speech Low Inflation in a World of Monetary Stimulus

Philip Lowe[*]
Deputy Governor
Speech to the Goldman Sachs Annual Global Macro Economic
Conference
Sydney –
- Audio 16.65MB
- Q&A Transcript
I would like to thank Goldman Sachs for the invitation to speak today. It is a pleasure to be here and be part of your annual Macro Economic Conference.
It is perhaps stating the obvious to say that an important part of the macroeconomic environment is monetary policy. The actions of central banks have material effects on financial markets and can shape macroeconomic outcomes. Indeed, over recent decades it became widely accepted that monetary policy was the primary macroeconomic stabilisation tool and that monetary policy could effectively manage the business cycle.
From today's perspective, the picture looks a little different. In many ways, the current global monetary environment is quite extraordinary. There has been unprecedented money creation by the world's major central banks. Policy interest rates are negative across much of Europe. Long-term government bonds yields in most advanced economies are the lowest in recorded history. Lending rates for many private sector borrowers are the lowest ever. And some banks in Europe are now charging customers to accept deposits.
In earlier eras, one could have predicted with some confidence that this type of monetary stimulus would have created a boom in economic activity and subsequently a substantial lift in inflation. Yet, today, many parts of the world continue to operate with considerable spare capacity, inflation rates are low almost everywhere and inflation expectations have generally declined, not increased.
So this afternoon, I would like to talk a little about these very unusual times. I will begin by showing a few graphs that summarise the current global monetary environment. I would then like to explore some of the possible reasons why we are in this environment before addressing some of the implications of all this for Australia.
The Current Global Monetary Environment
So first, to the facts.
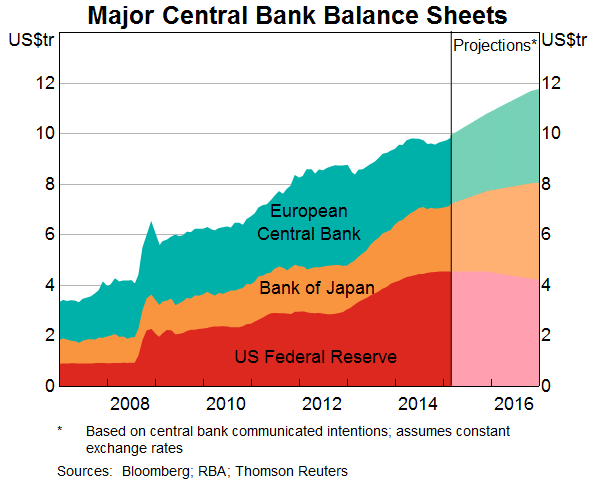
Since the global financial crisis, we have seen an extraordinary increase in the size of central bank balance sheets. This first graph shows the size of the combined balance sheet of the US Federal Reserve, the Bank of Japan and the European Central Bank (Graph 1). This combined balance sheet has increased from the equivalent of US$3½ trillion in early 2007 to almost US$10 trillion today, and a further substantial rise is in prospect. Once this further increase has occurred, the combined balance sheet will be equivalent to around 35 per cent of the relevant countries' collective GDP, up from just 10 per cent prior to the crisis. This increase has taken place primarily by the central banks creating money to purchase assets outright from the private sector.
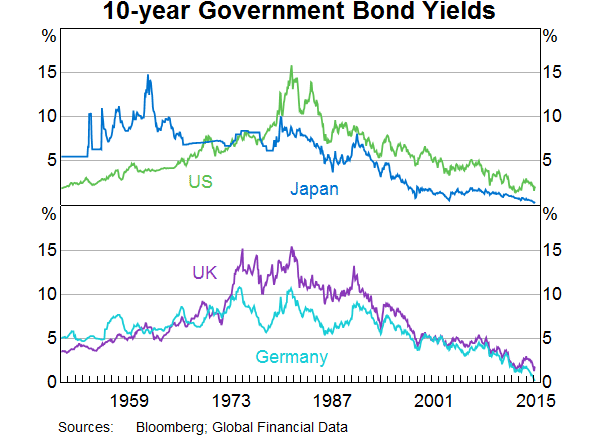
The next graph shows a long time-series of nominal 10-year government bond yields for a number of advanced economies (Graph 2). The striking thing is how low these rates are now. The German and Japanese Governments can borrow for 10 years at less than 0.4 of a percentage point, while the US and UK Governments pay 2 per cent or less. At shorter maturities, investors are prepared to actually pay governments to look after their money. And it is not just governments that can borrow at negative rates, with yields on the bonds issued by some highly rated corporations also turning negative recently.
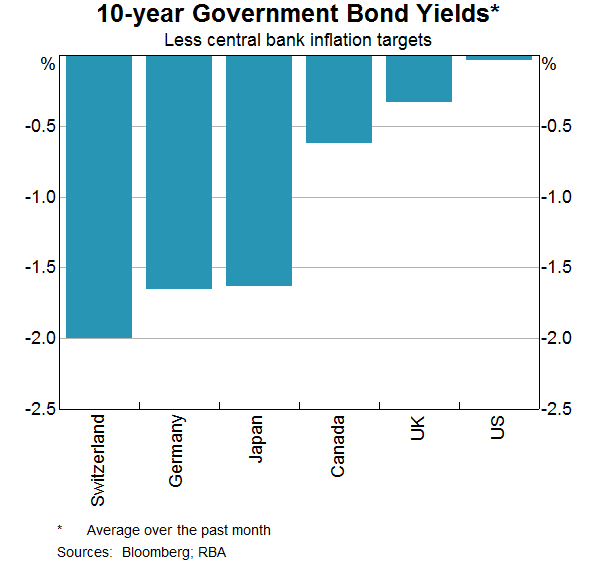
With nominal rates so low, real long-term government bond yields in much of the world are negative. One way of calculating these real rates is to subtract the central bank's inflation target from the nominal 10-year yield. The results of this are shown in this next graph (Graph 3). If the central banks do achieve their inflation targets (and there is some doubt that this will be the case), the current yields imply very large real losses for the holders of some sovereign bonds. For example, if the Bank of Japan was to achieve its inflation target over the next decade, then current holders of 10-year Japanese government bonds would lose around 15 per cent of their investment in real terms. The same is broadly true in Germany. And in the United States, the real return over the next 10 years would be zero.
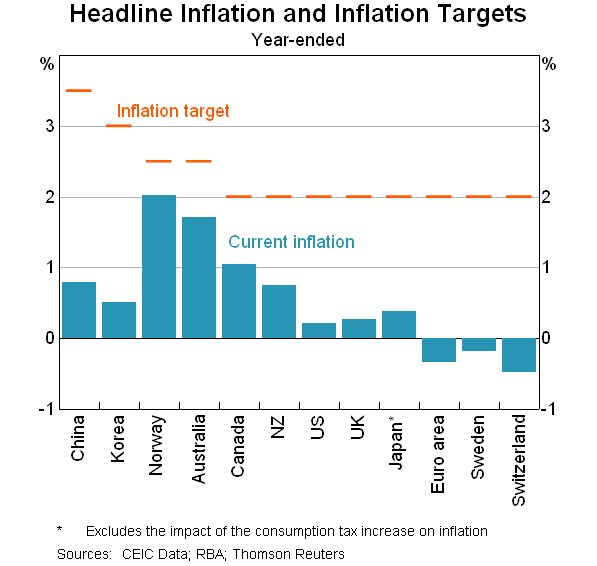
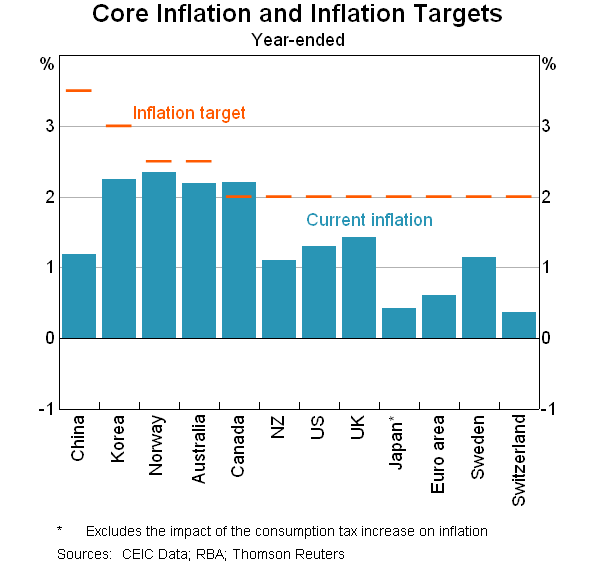
The next graph shows current headline inflation rates for a number of countries as well as the midpoint of the relevant inflation target or objective (Graph 4). In all advanced economies, inflation is currently below target and this is also true in quite a few emerging market economies. Of course, one reason for the low inflation rates is the recent large decline in oil prices. But even so, as is evident from the following graph (Graph 5), core or underlying rates of inflation are also below target almost everywhere.
So to summarise briefly, the current environment is one in which there has been a very large monetary stimulus, interest rates are very low and inflation is subdued. This is not exactly what the traditional textbooks would have predicted.
Why do we find ourselves here?
The obvious questions that arise here are why do we find ourselves in this situation and what does it say about the effectiveness of global monetary policy?
One answer is that the current environment simply reflects the extreme nature of the financial crisis and that monetary policy is working pretty much as it always has. In a number of dimensions the crisis was the biggest financial shock since the Great Depression in the 1930s. It led to major stresses in bank and government balance sheets and badly dented confidence. Monetary policy responded to this, with the size of the response commensurate with the size of the shock. According to this line of argument, what is unusual about the current environment is not the magnitude or the effectiveness of the monetary response, but rather the magnitude of the underlying problem to which monetary policy is responding.
An alternative answer is that the effects of monetary policy have been somewhat less, or slower to materialise, than in earlier times. Partly as a result of this, the monetary response has needed to be larger. This line of argument recognises the considerable damage caused by the financial crisis, but sees economic activity and inflation responding in only a relatively muted way to the monetary stimulus, with central banks having to do more to achieve their mandated goals.
There is probably an element of truth in both of these answers. The shock caused by the financial crisis was indeed a very large one and a very large monetary response was appropriate and helpful. At the same time, though, the transmission of the monetary stimulus does look to have been a little different through this episode. Economic activity does not appear to have responded to the stimulatory monetary conditions in the way that occurred in the past and inflation rates have been very low.
Perhaps the single most important factor explaining this is the very high levels of debt that exist in many advanced economies.
One of the channels through which monetary policy works is by encouraging people to bring forward future spending to today. This requires them to borrow or to reduce their rate of savings. In the years leading up to the crisis, a reduction in interest rates could be reliably predicted to encourage such a response. Credit was easily accessible, economic volatility in many economies was low and people were prepared to borrow.
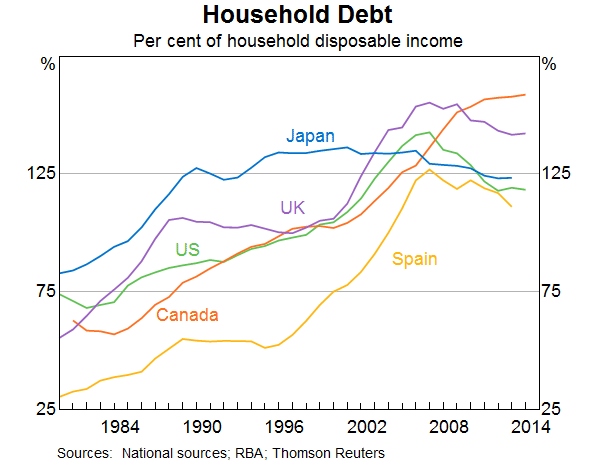
In today's world, things look quite different. After a steady increase in debt levels over the previous two decades, many people do not want more debt (Graph 6). They do not want to – or they do not have the confidence to – bring forward future spending to today. As a result, household indebtedness in many countries has declined even though interest rates are the lowest on record.
One area where low interest rates do appear to be having the broadly expected effect is on asset prices: global equity markets have been strong; property prices are again recording solid gains in some countries; and bond prices have increased substantially. However, for these increases in asset prices to boost the global economy, households and businesses need to respond by increasing their spending. While in the United States there are now some signs that this is happening, on the whole the response of private spending to higher asset prices has been muted.
Overall, looking at this experience, I find it difficult to escape the conclusion that changes in interest rates are not affecting decisions about spending and saving in the way they might once have done. Undoubtedly, low interest rates are helping to repair balance sheets by lowering debt-servicing costs and by pushing up asset prices. In so doing, they are helping lay the foundations for future growth in consumption and investment. But, while this repair process is taking place, consumption is weaker than it otherwise would be. In turn, subdued consumption growth is feeding through to a more subdued business climate and weaker investment.
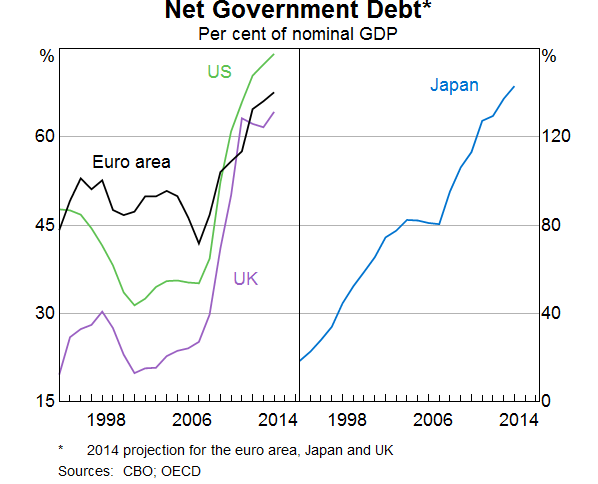
Arguably, a similar dynamic has been playing out in government finances in a number of countries. After the financial crisis, many governments found themselves with debt levels that were very high (Graph 7). Like many households, they have responded by tightening their belts. Given the high levels of debt and ongoing imbalances between recurrent revenue and expenditure, few governments have seen the very low interest rates as an opportunity to support long-term infrastructure investment at low cost. Rather, much as households have done, governments have taken advantage of the lower debt-servicing costs to help shore up their finances.
A second part of the monetary transmission mechanism that looks a little different is the flow-on from economic activity to inflation. While the evidence here is less clear cut, looking around the world it seems probable that both workers and firms perceive that their pricing power has declined. To the extent that this has occurred, it is likely to have come from a combination of the scarring experience of the financial crisis and of the increasing globalisation of many markets.
Over recent years, wage outcomes have been very subdued in many countries. This is true not just in those countries with high unemployment rates, but also in those with low unemployment rates. In Germany, the unemployment rate is the lowest in more than 30 years and in Japan it is the lowest in around two decades. Yet, in both countries, wage outcomes are subdued. More broadly, across a range of countries, wage increases have recently been slower than suggested by standard Phillips Curve relationships. This comes after a period in which the wage adjustments to very high unemployment rates were relatively small in a number of countries.
Time will tell if this simply reflects a change in the normal lags. But I suspect that there is something deeper going on. The experience of the financial crisis has left deep scars in many economies, including a heightened sense of job insecurity. This insecurity has been compounded by the increased competition that globalisation has brought as well as by changes in technology. It has led to many workers in advanced economies feeling less inclined to seek the wage increases that they might once have sought – they feel that they have less market power and that keeping a job is more important than seeking a large pay increase.
A similar dynamic is probably playing out in the pricing decisions of many businesses. Globalisation has brought new competition in many markets for goods and services and the financial crisis increased business uncertainty. In this environment, putting up prices can seem to be a more risky proposition than it did previously.
It is difficult to tell how persistent any of these perceived changes in market power are likely to be. It still seems highly probable that a period of strong growth in the global economy would eventually see a generalised increase in pricing power. In the meantime, though, the inflation pressures in the global economy are quite muted. The recent fall in oil prices has reinforced this and has contributed to a decline in inflation expectations in a number of countries.
In this environment, the limits of monetary policy are becoming more visible than perhaps they were in earlier years. High levels of debt and increased uncertainty look to have changed or, at least temporarily, altered the transmission mechanism. This is one of the reasons why the G20 and others have focused on the importance of structural reform and improving the climate for investment. At the global level, stronger and more effective policies in these areas would be helpful in encouraging both households and businesses to take advantage of the opportunities that low interest rates have provided. Monetary policy can help support the global economy, but ultimately it cannot be the fundamental driver of economic growth.
Implications for Australia
So what does all this mean for Australia?
There are three general points that I would like to make.
The first is that global monetary developments are having a significant effect on the configuration of Australian exchange rates and interest rates, and thus on our asset prices.
The monetary stimulus abroad has tended to put downward pressure on the value of the currencies concerned. Conversely, it has put upward pressure on the value of other currencies where the need for monetary stimulus has been less, including the Australian dollar. While movements in the value of our own currency remain heavily influenced by changes in commodity prices, the upward pressure on the Australian dollar from developments abroad has complicated the transition of the economy following the mining investment boom.
With our exchange rate higher than it otherwise would have been, domestic demand has been a bit weaker. The Reserve Bank Board has responded to a softer economic outlook by having interest rates lower than otherwise. The easier monetary policy in Australia has supported the domestic economy. It has done this partly by offsetting some of the upward pressure on our currency from developments abroad, although the scale of global monetary stimulus means that our exchange rate remains relatively high given the state of our overall economy. The end result here is that global developments have left us with a higher exchange rate and lower interest rates than would otherwise have been the case. We may not like this configuration, but developments abroad give us little choice.
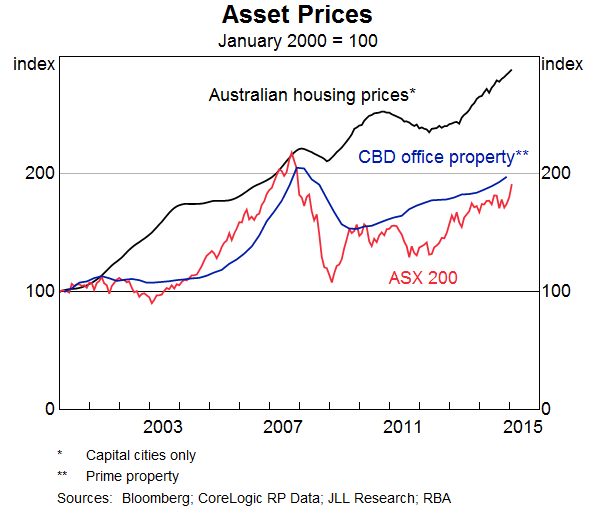
The lower interest rates have boosted domestic asset prices, with both property and equity prices recording strong gains recently (Graph 8). The low interest rates globally have also worked to push up Australian asset prices. Overseas investors, faced with very low returns, have looked elsewhere around the world for higher-yielding assets. Some of these assets are in Australia and so we have seen significant inflows into some types of investment. One example of this is commercial property, where foreign investors have been attracted by the historically high yields. The higher asset prices are helping to support the economy, although they need to be watched carefully, particularly where they are accompanied by higher borrowing.
The second general point that I would like to make is that the same factors that are affecting the transmission of monetary policy globally are also evident in Australia, although to a lesser extent.
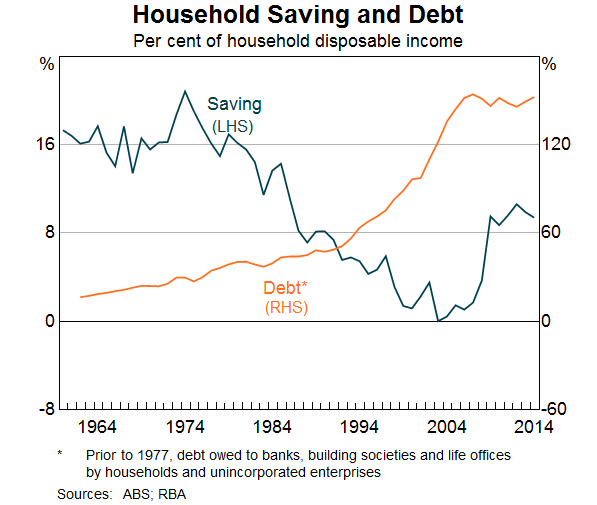
In common with households in a number of other countries, Australian households increased their borrowing over the decade or so to the mid 2000s as they adjusted to lower nominal interest rates and greater access to finance. During this period, the saving rate fell and indebtedness increased (Graph 9). But this adjustment is now complete. Over recent years many more households have focused on paying down their debts, rather than borrowing more, and the saving rate has increased. In the earlier period, the level of interest rates that we have today would have caused a large boom in borrowing, but this has not occurred.
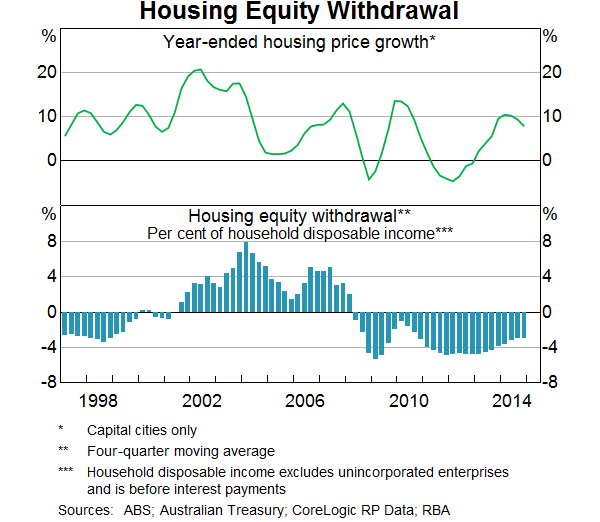
One area where this change in behaviour is apparent is in the household sector's injection of equity into the housing stock (Graph 10). In the early 2000s when property prices were increasing strongly, many households used their newfound wealth to withdraw equity and enjoy higher levels of consumption. Again, this is not occurring on this occasion and this is changing the way that monetary policy affects the economy.
A related part of the transmission mechanism that may be changing is the so-called cash-flow channel. One of the ways that lower interest rates help boost spending is by improving the overall cash flow of the household sector. Since household borrowing exceeds household deposits, a cut in interest rates puts more money in the aggregate household budget. However, there are large differences across households. When interest rates go down borrowers pay less interest and so are better off. But savers receive less interest income and so are worse off. How these two different groups respond determines how powerful this cash-flow channel is.
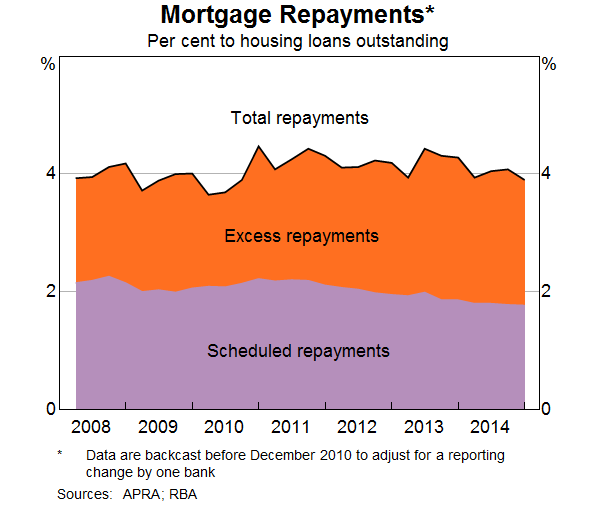
While it is not possible to be definitive, there are reasonable grounds to believe that the behaviour of both borrowers and savers might have changed a little. Many borrowers have responded to the lower interest rates of recent years by paying off their loan a little faster, rather than increasing their spending. This is evident in the data on total mortgage repayments and scheduled repayments (Graph 11). Conversely, it seems likely that those relying on interest income have reduced their spending by more than would previously have been the case. Certainly, the many letters we have been receiving at the Bank recently would suggest this. Unfortunately, one of the consequences of a world in which many more people want to save than to invest is that the return to saving falls, particularly on savings held in low-risk assets such as bank deposits.
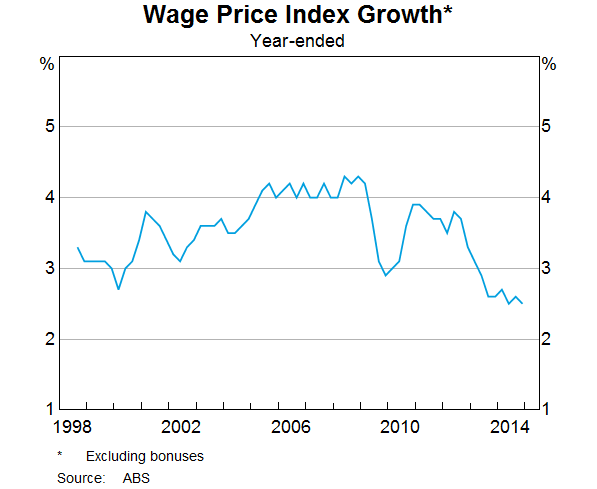
One other change to the global monetary transmission mechanism that has echoes in Australia is the behaviour of wages. As in many other countries, wage growth in Australia has been quite subdued and lower than would be suggested by most of our standard models. The latest reading of the wage price index shows an annual increase of 2½ per cent and the earnings per hour measure from the national accounts is lower still (Graph 12). This low level of wage growth is contributing to quite low rates of inflation in a range of service industries. Increased job uncertainty is likely to be one of the factors here, with consumer surveys showing high levels of concern about future unemployment.
The third general point is that despite the transmission mechanism looking somewhat different, monetary policy in Australia is still working and it is helping to support the Australian economy.
The area where this is most obvious is in housing construction, where there has been a substantial lift. This part of the transmission mechanism appears to be operating pretty much as normal, with the increase in activity over the past 1½ years being in line with our internal forecasts made in the second half of 2013 when the cash rate was first set at 2½ per cent. This increased activity is boosting employment in the sector and having flow-through effects to spending on homewares and related items.
The exchange rate channel of monetary policy is also working. There are some signs that the depreciation of the Australian dollar is boosting domestic activity, with net exports of services increasing strongly. Also, in our liaison program a number of businesses have reported that they see the lower exchange rate as opening up new opportunities. In time, we should see the effect of this on domestic production and spending.
Monetary policy is, of course, also working through the other channels that I discussed earlier, even if the effects are somewhat different from those in the past.
So, overall, monetary policy is continuing to play an important role in supporting demand in the Australian economy. At its February meeting, the Reserve Bank Board decided that it was appropriate to provide some additional support. This was not because things had turned for the worse, but rather because of the lack of compelling signs that economic growth was picking up as was earlier expected. No doubt, the factors that I have talked about today go some way to explaining why this has turned out to be the case. At its meeting on Tuesday this week, the Board maintained the cash rate at 2 per cent, but noted that further easing may be appropriate over the period ahead.
Finally, stepping back from the short term, the low interest rates we are seeing globally and in Australia are a direct consequence of an elevated appetite for saving and a muted appetite for real investment in many economies. Monetary policy globally has responded to this reality in a way that a decade or so ago would have hardly seemed imaginable. In doing so it has helped the global economy through a very difficult period. But, at the end of the day, the solution to the problems caused by the disconnect between the desire to save and the desire to invest cannot lie with monetary policy. Instead, it lies in measures to improve the investment environment so that once again there is strong productive demand for the use of our societies' savings.
Thank you and I would be happy to answer any questions you might have.
Endnote
I would like to thank Marion Kohler for excellent assistance in the preparation of these remarks. [*]