Speech The Financial Situation Three Years On

It is now a little over three years since the onset of the financial crisis in August 2007. Since that time, financial markets have varied substantially in terms of pricing, volumes and functioning. Conditions in global markets now are markedly improved from their dire position in the last quarter of 2008. Markets have not returned to their pre-2007 state, but that is generally a good thing as those conditions were not sustainable (as indeed they proved not to be).
Notwithstanding this, conditions in some markets remain somewhat fragile, reflected in still elevated volatility. In part, I think this is because the events of 2008 are a recent memory and practitioners now know how to retreat rapidly, instead of this process taking over a year as occurred between August 2007 and September 2008. We saw some evidence of this back in May this year.
What I intend to do today is talk about the state of play in financial markets, focussing primarily on the foreign exchange market and the domestic bond market. I will focus on structure and functioning and how these have changed over the past three years. Throughout the period, Australian financial markets have generally operated with less dislocation than those in other parts of the world and that remains true today.
Foreign Exchange
The foreign exchange market has been amongst the most resilient of markets throughout the financial crisis. Indeed, its resilience and the increasing attractiveness of foreign exchange as an asset class have seen many financial institutions expand their staffing in this area, even while they have been shrinking elsewhere.
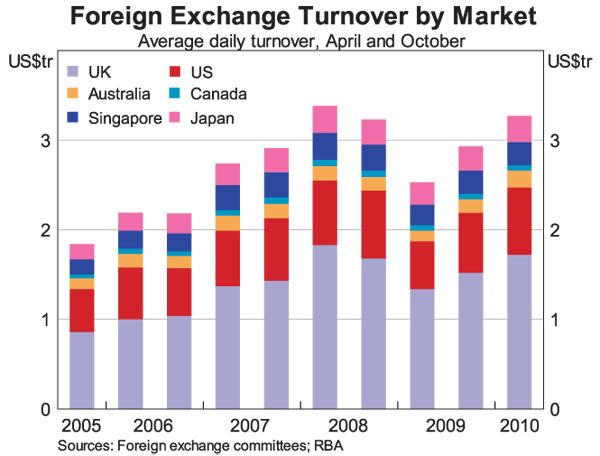
The most recent data published by the foreign exchange committees in the major markets confirm this view. Turnover in these markets has increased by 30 per cent from the lows of early 2009, to be above its pre-crisis levels (Graph 1). The same picture can be gleaned from the just-released BIS Triennial Survey which shows global turnover averaged US$4 trillion a day in April 2010, 20 per cent higher than in April 2007.
By market, this growth has been broad-based. The UK, which is the largest market, experienced slightly above-average growth while market share declined in the rest of Europe. The Australian market's relative position was little changed, remaining the seventh largest market.
There was more variation in growth rates by currency. Among the major currencies, the Canadian dollar and the Australian dollar experienced the fastest growth, with turnover increasing 50 per cent and 40 per cent respectively. The Australian dollar became the fifth most traded currency, overtaking the Swiss franc in which growth was subdued. The AUD/USD remains the fourth most traded currency pair. Turnover involving the US dollar grew slightly less than the average. However, it still maintains its dominant role in foreign exchange markets, being involved in 85 per cent of all transactions.
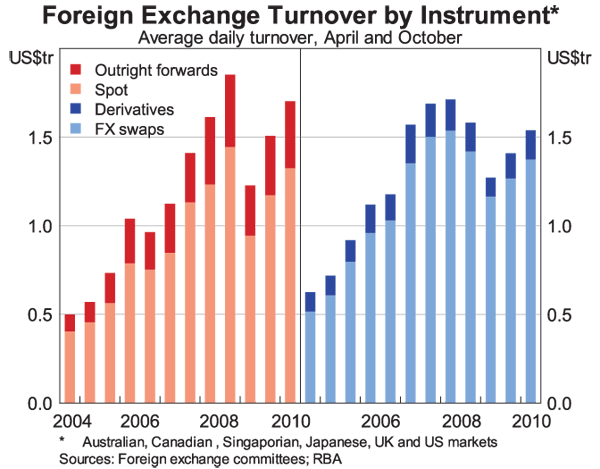
While turnover in all instruments has grown over the past year, growth has been faster in spot and forward instruments than foreign exchange swaps (Graph 2). Spot and forwards turnover has rebounded by 40 per cent since early 2009 and volumes are now above those seen in 2007. In contrast, turnover in swaps has grown by around 20 per cent over the past year and remains about 10 per cent below its peak.
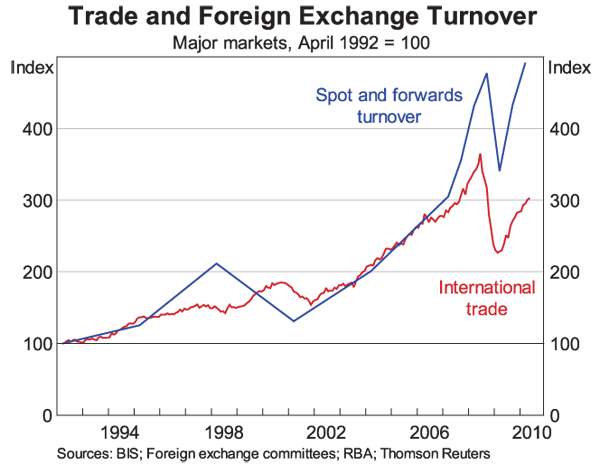
This difference reflects the varied uses of these instruments. There is a strong correlation between growth in spot and forwards turnover and international trade. In these markets, trade has increased by more than 30 per cent since its trough in March 2009, driving the rebound in spot and forwards turnover (Graph 3).
The recovery in cross-border capital flows has also contributed to the pick-up in spot and forwards turnover. Foreign banking flows, foreign direct investment and portfolio investment all contracted earlier and faster than international trade during the crisis. These capital flows have recovered of late, supporting spot and forwards turnover in 2010. However, the recovery in cross-border capital flows has been more muted than that in trade; capital flows in G3 countries remain at much lower levels than seen prior to the crisis. These lower flows are likely to be part of the explanation for the slower growth in swaps turnover, which are more dependent on financial activity than are spot and forwards.
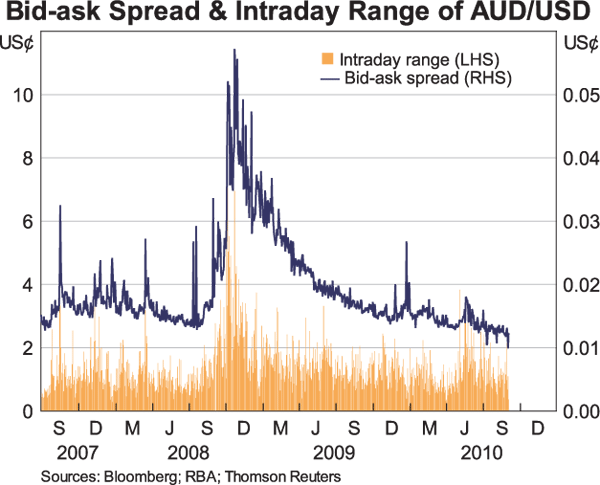
Along with the rebound in turnover, liquidity in the foreign exchange market has also improved. As I noted when I last addressed this forum,[2] liquidity and turnover, while related, are not necessarily the same thing. The bid-ask spread is one potential measure of liquidity and it shows the steady improvement in market conditions (Graph 4). The bid-ask spread widened appreciably in May of this year but the deterioration in conditions was short-lived and significantly less than in late 2008.
While turnover has recovered, the pricing of foreign exchange swaps has been affected by the events of the financial crisis in a more long-lasting way. Historically, the implicit cost of borrowing US dollars through the swap market was the same as borrowing directly in the US dollar money market, that is, US dollar LIBOR. Covered interest parity held and there was no implicit basis in the foreign exchange swap market. However, during the crisis the basis in the swap market widened considerably implying a large premium for borrowing US dollars under swap (Graph 5): the pricing indicated it was considerably cheaper to borrow US dollars directly in the interbank market than under swap. This basis has narrowed significantly from its peak in late 2008, but remains positive at around 50 basis points.
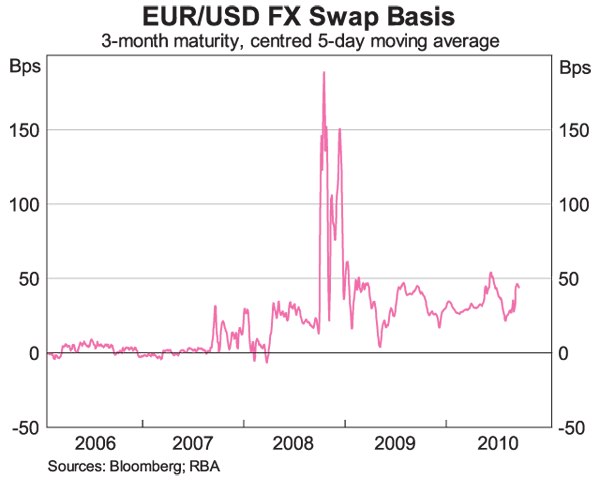
The origin of this positive basis is the dislocation in money markets that emerged through 2007 and 2008.[3] Prior to the crisis, banks outside the United States – mostly in Europe – built up large US dollar asset positions which were funded in part by rolling short-term US dollar borrowing. There was a large maturity mismatch between their short-term funding and their long-term asset positions. In the second half of 2007, the supply of US dollars in the money markets tightened considerably and these banks found it increasingly difficult to borrow the US dollars they needed directly. Nor could they sell the assets because of their illiquidity.
Following the collapse of Lehman Brothers the situation worsened as general counterparty concerns saw the supply of US dollars in the unsecured money market largely disappear. In response, non-US banks increasingly sought to obtain US dollars via the foreign exchange swap market, but supply of US dollars here was also tight. This saw the basis spike sharply higher in October 2008.
Under normal conditions, market forces would ensure any price discrepancy would be arbitraged away. However, there were a number of constraints on the ability to arbitrage over this period. Increased risk aversion, counterparty concerns and balance sheet losses restricted potential arbitrage activity. Further, US institutions with access to US dollar borrowing tended to hold additional precautionary balances to ensure their own liquidity rather than lending in the market.
Counterparty concerns generated significant credit tiering in the market for US dollars. In late 2008 and early 2009, few banks were actually able to access unsecured funding at LIBOR. The eurodollar rate, which is a broader measure of US dollar borrowing costs, indicates that for many banks, funding costs were considerably higher than US dollar LIBOR. When we account for credit tiering by calculating the basis using the eurodollar rate, the apparent deviation from covered interest parity through 2008 is smaller.[4]
Action by policymakers, in particular the central bank swap lines set up with the US Federal Reserve, acted to ease supply constraints in the market. However, the basis has not returned to zero and remains sensitive to counterparty concerns. This was highlighted earlier this year in May, when concerns about European sovereign debt saw the basis increase again. Unlike the earlier episode, it appears that credit tiering in May was isolated to a smaller group of European banks. While the swap lines were reactivated by the major central banks, their usage has been extremely small this time around.
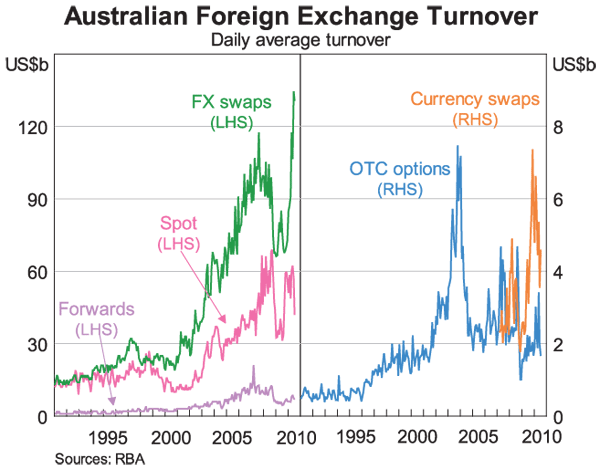
Turning to the Australian foreign exchange market, turnover has rebounded from its lows of early 2009 by 60 per cent (Graph 6), a much greater increase than in other major markets. Somewhat in contrast to other markets, swaps turnover in Australia has outpaced growth in other instruments and turnover is now higher than prior to the crisis, while spot and forwards turnover was unchanged from October 2009.
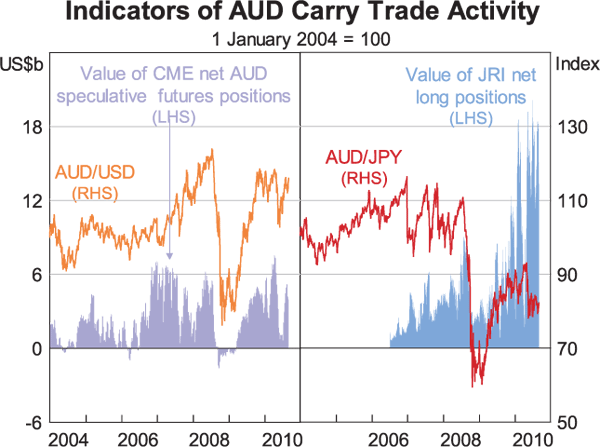
The growth in foreign exchange swaps is likely to be related to the improvement in risk appetite and appreciation of the Australian dollar over the past year. As in the pre-crisis period, market yields remain high in Australia relative to the rest of the world and as markets have stabilised there has been renewed interest in the Australian dollar carry trade. One way for the investor to generate a carry return is to hold an open forward position in the Australian dollar. These positions are typically short-term and rolled frequently using foreign exchange swaps. Data on CME investors' and Japanese retail investors' net positions show high levels of net long Australian dollar positions (Graph 7). In fact, Japanese retail investors' net long positions are even larger than prior to the crisis. The pick-up in options turnover seen in the previous graph would also be consistent with a pick up in carry trade activity, as options are used to limit the potential losses on the trade.
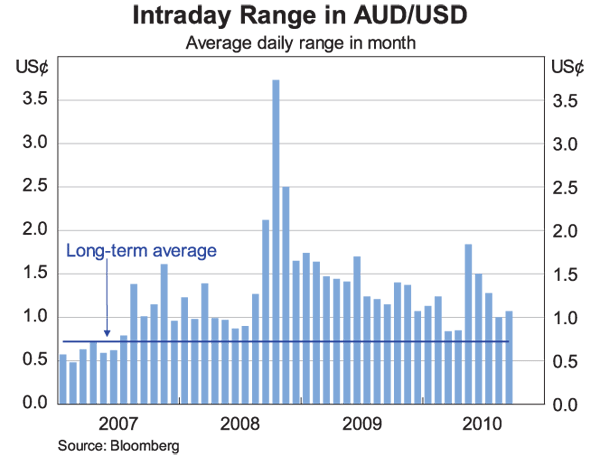
I talked about the improvement in liquidity in the local foreign exchange market earlier. Volatility in the Australian dollar has also declined significantly from its peak in October 2008 but remains well above its pre-crisis level (Graph 8). The spike in volatility in May is evident.
The Australian cross-currency swap market has also experienced strong growth with turnover now close to its previous peak. The market is particularly important in Australia as Australian banks make use of cross-currency swaps to hedge the exchange rate risk associated with their foreign currency bond issuance. Australia has a large share of the cross-currency swap market and this share has grown over the past three years, from 5 per cent in 2007 to 11 per cent in 2010. The increasing share reflects the fact that Australian institutions accounted for a larger share of global foreign currency bond issuance in 2009. The increased share resulted as much from the very low issuance globally as it from the fact that the Australian banks maintained their access to bond markets due to their strong balance sheets, high credit rating and, for a period, the government guarantee (see below).
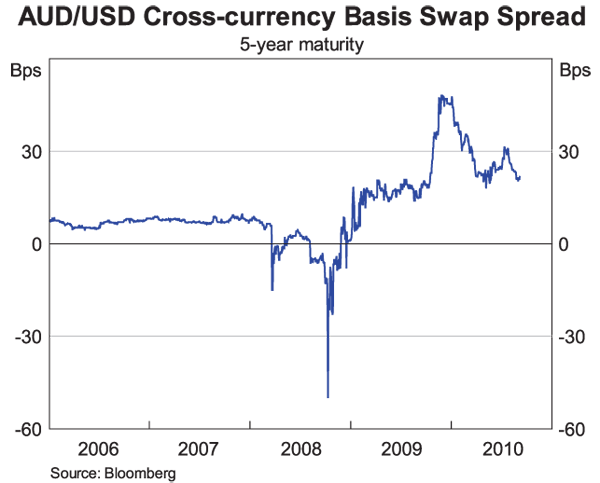
The premium to obtain Australian dollars under swap has risen compared to the pre-crisis period. Historically, Australian institutions paid a small premium to swap foreign currency into Australian dollars. The premium arises because domestic issuers tend to issue a greater value of foreign currency bonds than foreigners issue of Kangaroo and other Australian dollar bonds. The crisis saw this balance shift even further toward Australian issuers as Kangaroo issuance slowed to a halt, resulting in a higher basis (Graph 9). Kangaroo issuers have since begun responding to the favourable pricing, with $8 billion of Kangaroo issuance over the past three months. As a result, the basis has moderated from its peak but remains higher than in the pre-crisis period.
The Australian Non-government Bond Market[5]
Turning to the local bond market, one important point to emphasise is that holders of Australian bonds have seen relatively little deterioration in asset quality. Nevertheless, heightened global risk aversion significantly affected pricing, and while spreads have narrowed over the past year, relative pricing has changed, and consequently so has the structure of the market.
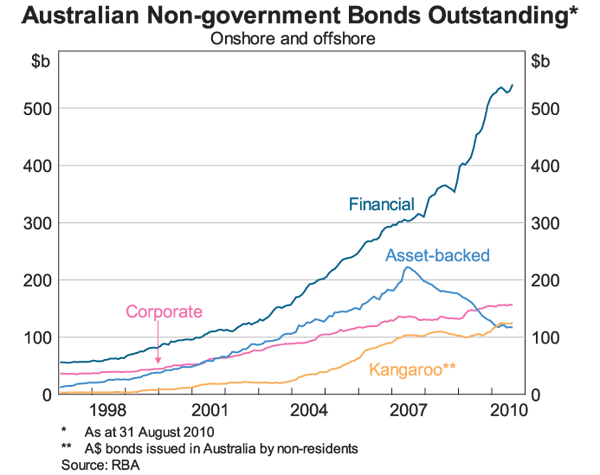
The Australian non-government bond market had grown significantly over the decade prior to 2007, as unsecured issuance by financials and corporates expanded (Graph 10). There was particularly rapid growth in asset-backed issuance in the form of RMBS such that by mid-2007, RMBS accounted for around 40 per cent of issuance in the non-government bond market.
The onset of the financial crisis in mid 2007 altered these issuance patterns (Graph 11). There was large selling of existing RMBS by foreign investors, particularly SIVs. The selling occurred because the SIVs were forced to liquidate portfolios, not because of any issue with the security itself. The resultant overhang of supply in the secondary market generated a large increase in RMBS spreads such that issuance was not economic for most lenders. As a result, issuance in 2008 and 2009 was only a fraction of the issuance prior to the crisis.
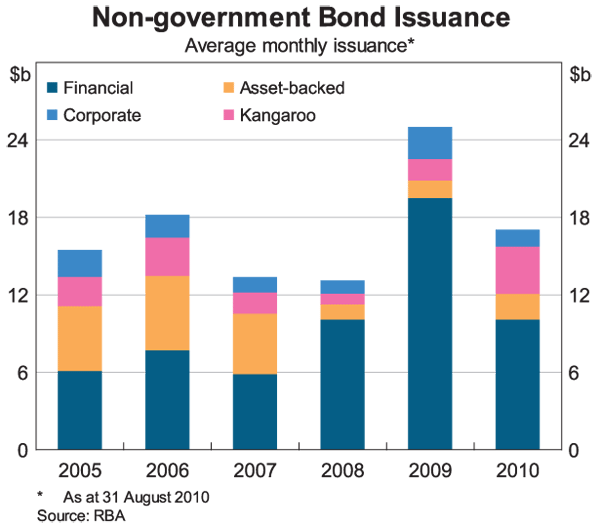
At the same time, the rise in risk aversion also saw many corporates turn to the banks for funding. The reintermediation on both the housing and business side saw banks' balance sheets grow. The banks retained access to the bond market and, supported by their strong balance sheets (reflected in the major banks retaining their AA ratings) and, for a time, the Government Guarantee Scheme, were able to issue significantly more in 2009 than in previous years. While the pace of new issuance by banks in 2010 has slowed compared with last year, issuance this year has been almost entirely in their own name, with the banks making very little use of the guarantee in the run up to the termination of the scheme in April.
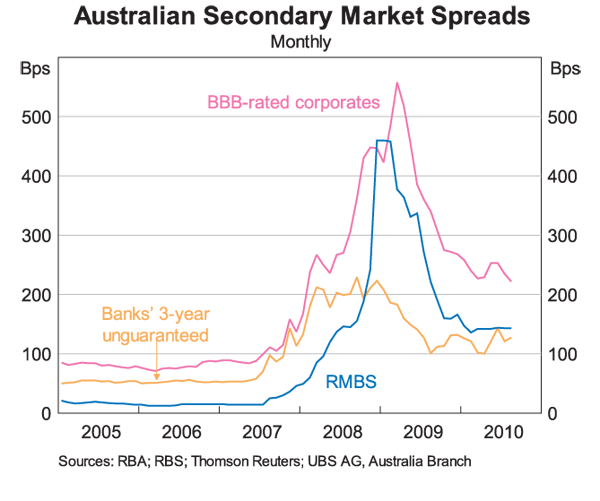
Despite all these classes continuing to perform well from a credit perspective, spreads widened during the financial crisis to historical highs and, as noted above, most dramatically for RMBS (Graph 12). As investor risk aversion has eased, spreads have narrowed from these highs, but still remain well above pre-crisis levels. Perhaps more importantly for the structure of the market, relative pricing has changed significantly compared with early 2007: the relative cost of bond market funding has declined for the higher rated banks compared with RMBS issuers and corporates.
In the RMBS market, primary and secondary market spreads have broadly converged, with AOFM supporting new issuance at tighter spreads. Although RMBS spreads remain high by historical standards, recent issues, including those without AOFM support, have been cost effective for the issuers. Nevertheless, the shift in relative pricing noted earlier suggests that the asset-backed segment is, and is likely to remain, a smaller share of the market than it was prior to the crisis. The decline in AAA asset-backed issuance has only had a modest effect on the credit composition of the market, being offset by strong AAA Kangaroo issuance.
Conclusion
Conditions in financial markets have fluctuated through a wide range over the past three years. Recently, conditions have been somewhat fragile but considerably improved from late 2008 and early 2009. The foreign exchange market has been one of the most resilient markets and has expanded rapidly over the past year. In that market, unlike a number of others, conditions have generally returned to those before 2007. In other markets, it is unlikely that the pre-crisis conditions will prevail again anytime soon.
Throughout the past three years, Australian financial markets have been less affected than other markets. However, there has been a marked effect on the structure and pricing of the Australian bond market. An increase in paper issued by financial institutions has offset the decline in asset-backed issuance. Risk margins across all asset classes have tightened over the past year but remain noticeably higher than in 2007.
Endnotes
Thanks to Patrick D'Arcy, Megan Garner, Crystal Ossolinski and Andrew Zurawski for their help. [1]
See ‘The Australian Foreign Exchange Market in the Recovery’, address to Westpac Forum, 10 December 2009. [2]
For more analysis of this, see CGFS (Committee on the Global Financial System) (2010), ‘The Functioning and Resilience of Cross-border Funding Markets’, CGFS Publication No. 37. [3]
For more detail, see Ossolinski C and A Zurawski (2010), ‘The Financial Crisis through the Lens of Foreign Exchange Swap Markets’, RBA Bulletin, June. [4]
This is discussed in detail in Black S, A Brassil and M Hack (2010), ‘The Impact of the Financial Crisis on the Bond Market’, RBA Bulletin, June. [5]