Speech Talk to CEDA Economic and Political Overview 2008

Malcolm Edey
Assistant Governor (Economic)
Committee for Economic Development of Australia (CEDA)
Economic and Political Overview 2008
Sydney –
Thanks to CEDA for the invitation to speak here today.
Since the last time I spoke at this event, the RBA has taken a number of steps to increase the amount of information it makes available to the public, both about its policy processes, and its thinking about the economy. We now issue a monthly statement after each Board meeting, setting out the reasons for the latest decision, whether or not the interest rate is being changed. Minutes of the Board meetings are now also published, and they give additional detail on the matters that were considered and the reasoning behind the decision. And those of you who follow these things closely would know that we've increased the level of detail in the economic forecasts set out in our quarterly Statement on Monetary Policy.
So there's a lot of material out there for financial markets and Reserve Bank watchers to get their teeth into. Today I won't be trying to add anything new to that, but rather, I'll base my presentation on our latest Statement, which was released last week.
The challenge in assessing the economic outlook at the moment is to weigh up the effects of contrasting domestic and international forces. Over the past few months the run of new information coming from abroad, at least in the major industrial economies, has been mostly bad. One important aspect of that is the deterioration in global equity markets, and the ongoing strains in credit markets. I'm not going to focus on those things today, but instead I'll focus on the evolving economic data.
Naturally, a lot of attention has focused on the United States (Graph 1). The fourth quarter national accounts confirmed a sharp slowdown in the US, and most expectations now are for a period of further weakness in the first half of this year. Some observers are saying the US is about to enter a recession, or is already in one.
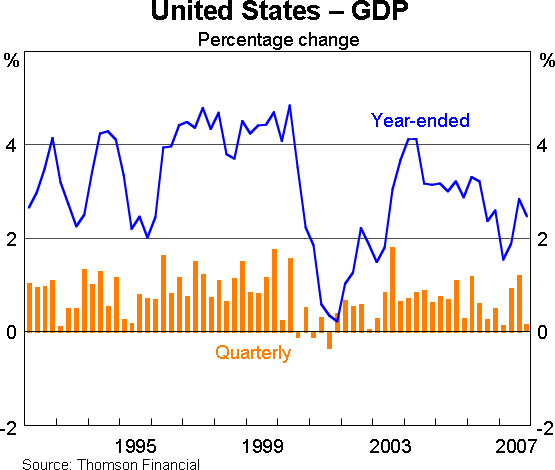
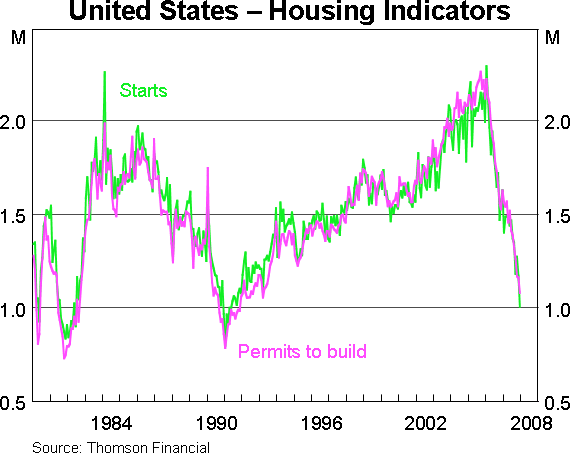
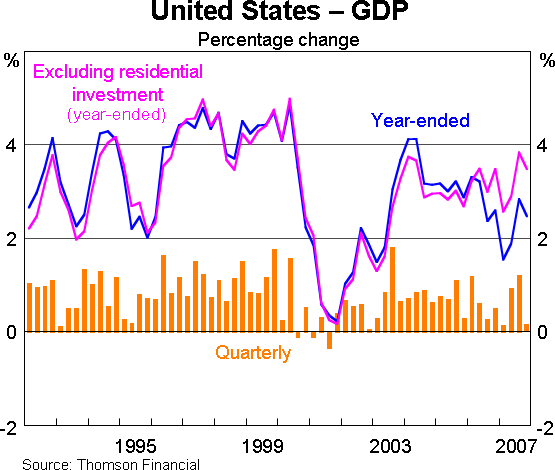
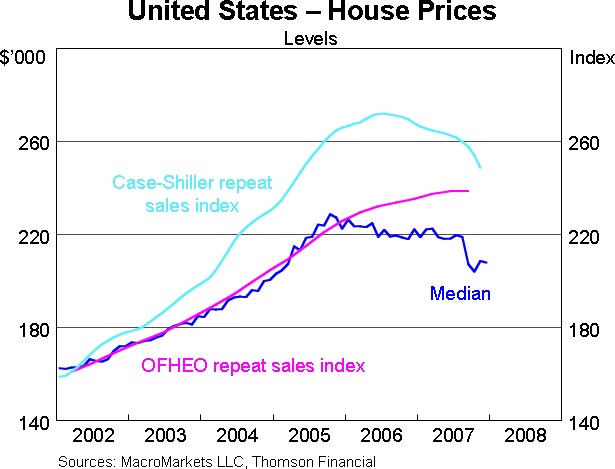
What's driving the weakness most significantly is the downturn in the housing market. Housing starts are down by more than 50 per cent from their peak two years ago (Graph 2). Even though housing is typically only about 5 per cent of the economy, falls of this magnitude are a significant drag on growth. It's interesting to note that expenditure on US GDP excluding housing construction was still growing at a rate of 3½ per cent through the latest year (Graph 3). The problem is that a divergence of this size between the housing sector and the rest of the economy can't persist indefinitely, because the housing slowdown feeds back into employment, incomes and other forms of spending. Adding to the contractionary impact is a downturn in established house prices which, according to one major index are down about 9 per cent from their peak, and still falling (Graph 4). These forces, and the ongoing fall-out from the sub-prime crisis, could continue to dampen the US economy for a while yet.
On the other hand, it's important to note that there are some forces supporting growth. The US export sector is getting the benefit of a lower dollar; there's a significant fiscal package in the pipeline, which will add more than 1 per cent of GDP to private spending power; and sharp cuts have been made in US official interest rates, with financial markets expecting more to come. So the overall course of the US economy will depend on the net impact of all these forces. Opinions still differ as to how severe the US slowdown will be.
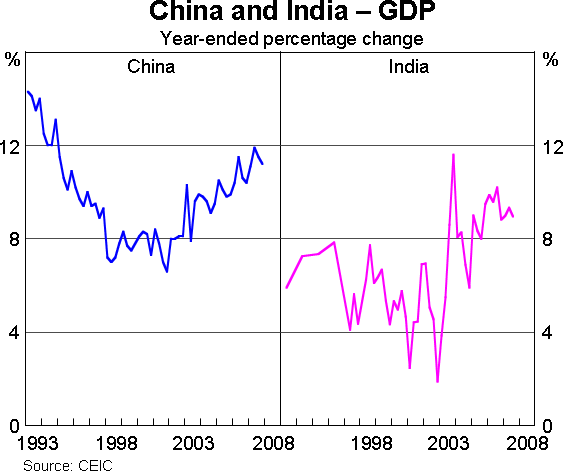
In varying degrees, the other major industrial economies are also experiencing a period of weakness. The important question is to what extent the weakness in the major industrial countries will affect China and the developing world. Up to now, the available indicators show the Chinese economy still growing strongly, at 11 per cent over the year to the December quarter (Graph 5). Chinese export growth did slow towards the end of last year, but only from around 30 to around 25 per cent, and, in any case, the bulk of China's growth is being driven by domestic demand. I note in passing that, on the latest data we have, the Indian economy is also growing well, though we don't yet have fourth quarter figures. And of course, both these strongly growing economies are now a bigger share of world and trading partner GDP than they were in previous business cycles.
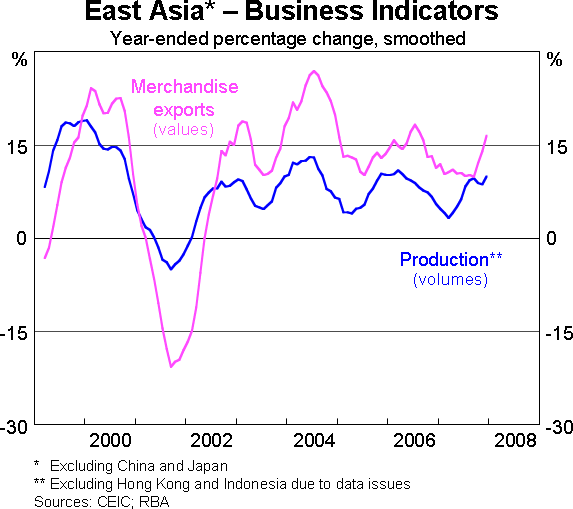
Elsewhere in east Asia, conditions seem to have remained firm through to the end of last year. Growth in industrial production picked up during the course of last year, as did export growth, probably a result of rising Chinese demand (Graph 6).
Despite these continuing signs of strength, it's still likely that a generalised slowdown in the major industrial countries will have some dampening effect on the Asian region, and on other parts of the developing world. The most obvious channel for this to happen is through trade linkages, but these effects are probably not large enough on their own to generate a sharp slowdown in the developing world. Bigger effects would be seen if there were direct spillovers from recent events into developing-countries' financial systems. But while there has been some spillover of equity market weakness, the difficulties in credit markets at this stage have been mainly confined to the industrial countries.
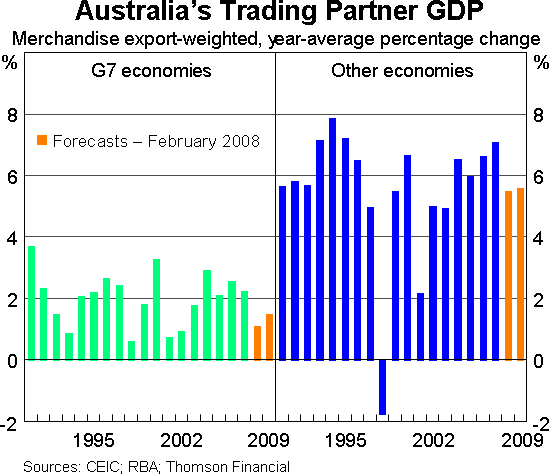
Drawing all of this together, the RBA is forecasting that growth in Australia's trading partners will slow to a below-trend rate this year and next (Graph 7). This incorporates very weak growth in the G7 economies, comparable to the rates seen in the early part of this decade. Growth in our other trading partners is also forecast to slow down from last year, but unlike in the G7 countries, we expect their growth rates to stay relatively strong. Overall, trading partner growth is forecast at just under 4 per cent for each of the next two years, which is down from the 5 per cent pace seen in 2007. This outlook is a little softer than the outlook published by the IMF in late January.
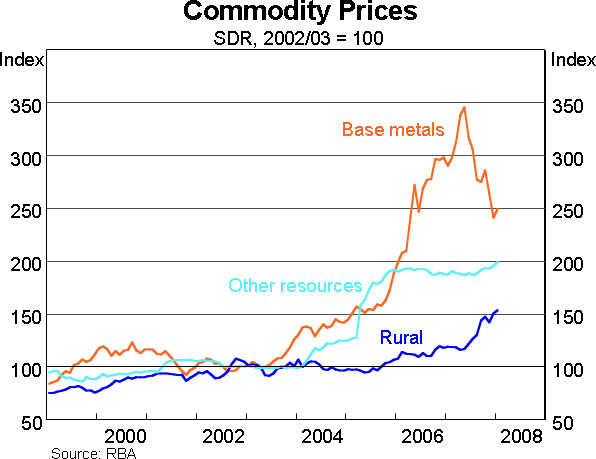
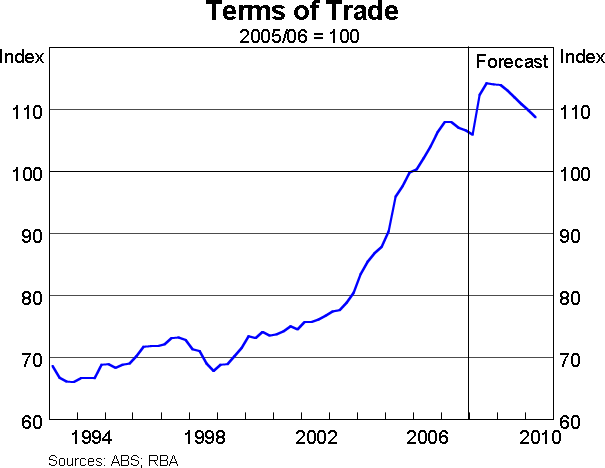
The other important aspect of the international environment is the outlook for commodity prices and Australia's terms of trade (Graph 8). For the last four years, our terms of trade have risen at a rate of about 8 per cent per annum. This is the largest cumulative run-up since the 1950s, and a big source of stimulus to domestic incomes and spending. Developments over the latest year have been more mixed. Base metals prices have come off their peaks, by an average of about 30 per cent, though they're still high compared to earlier history. On the other hand, markets for coal and iron ore have tightened further, and big rises in this year's contract prices are widely expected. Rural prices have also been rising. Based on these developments, we expect Australia's terms of trade to rise by another 5 per cent or so this year, but to fall gradually thereafter (Graph 9).
As I said at the outset, the striking thing about the current situation is the contrast between domestic and international conditions. The Australian economy to date has stayed robust, and the main domestic challenges are those of strong demand, tight capacity and inflationary pressures. I'll outline some of the main features of all that and then finish up with the RBA's domestic forecasts.
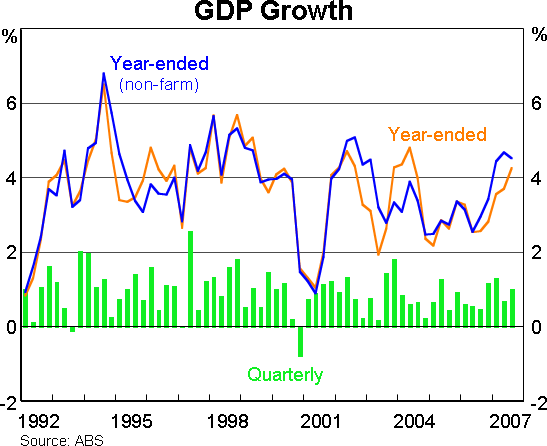
The latest national accounts are now a bit dated, but they show a high rate of growth, over the year to the September quarter, of just over 4 per cent (Graph 10). Growth of domestic spending was even higher, at 5½ per cent. It's often the case in reading economic data that we get conflicting signals that make it hard to judge the overall pace of the economy. We had a period like that a year or two ago, when GDP growth was estimated to be quite low but other indicators, like business survey results and employment growth, were pointing to stronger outcomes. But in the more recent period we're getting a fairly consistent picture of strong growth, at least up to the September quarter.
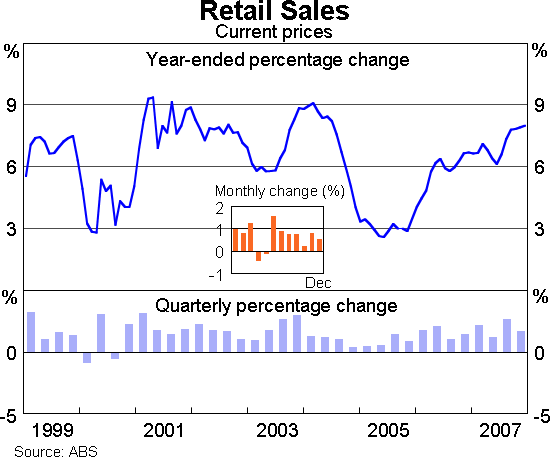
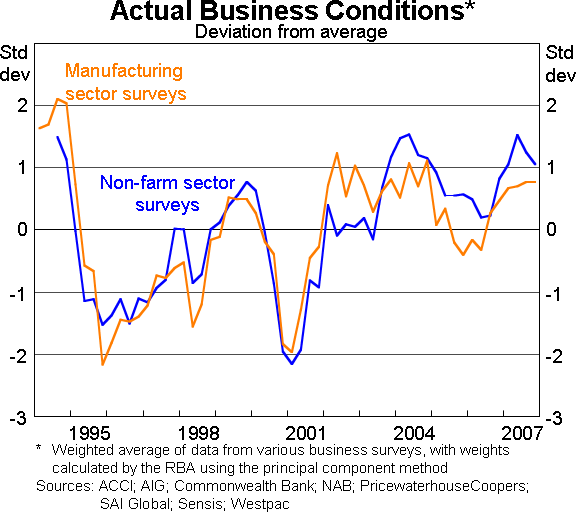
More recent indicators seem to point to further growth. Retail sales posted a big rise in the December quarter (Graph 11). The value of sales over the latest year was up by 8 per cent, which was the fastest rate since 2004. Employment growth in the past few months has continued at an above-average rate, and the job vacancy rate rose further. Spending on imports has picked up, which can be taken as a general sign of strong demand. And most of the business surveys reported good trading conditions in the December quarter. An average of the results from the major surveys shows conditions were moderating in the second half of last year, after a strong first half, but they were still at a high level at the end of the year (Graph 12).
On the other side of the ledger, there was a sharp fall in building approvals in December, although the number of approvals was still up in the quarter as a whole. Some very recent indicators of consumer and business confidence have also weakened. But overall, domestic demand and labour market conditions look to have remained strong in the period for which reliable data are available.
These conditions have been associated with a rise in Australia's inflation rate. The December quarter consumer price index showed a rise of 0.9 per cent in the quarter, for an annual figure of 3 per cent (Graph 13). However, the annual rate was still being held down by a fall in fruit prices at the beginning of last year. As the calculation rolls forward, it's likely that the annual figure could spike to something close to 4 per cent next quarter.
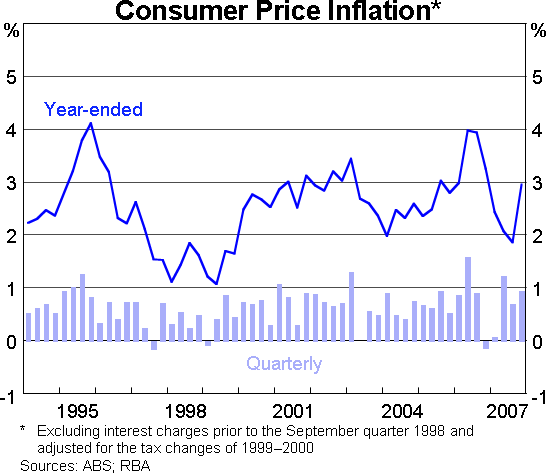
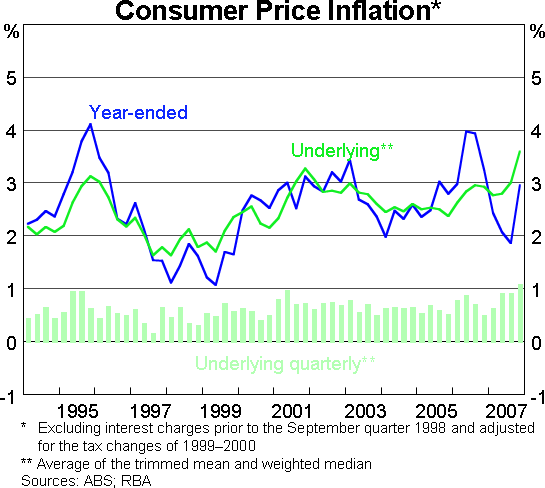
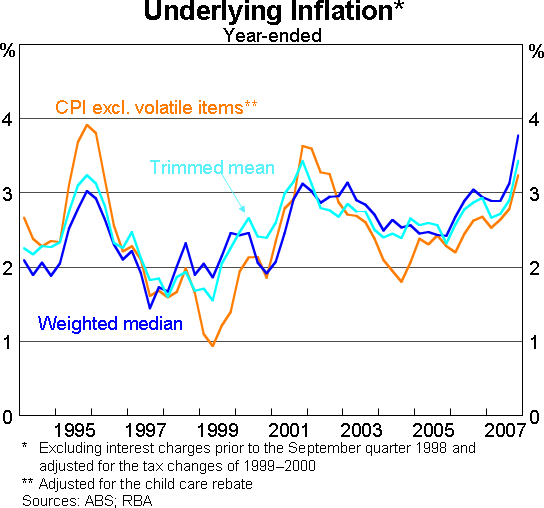
Looking through the spikes (both upward and downward) our estimate of the underlying trend is now around 3½ per cent, after a period when it seemed to be fairly stable around the 3 per cent mark (Graph 14). This estimate is the average of the two RBA statistical measures that are designed to reduce the influence of volatile price movements. For those who prefer simpler methods, a third measure, which just takes out volatile food items and petrol, and adjusts for the recent change to the child care rebate, shows essentially the same trend over the past couple of years, though at a slightly lower rate (Graph 15).
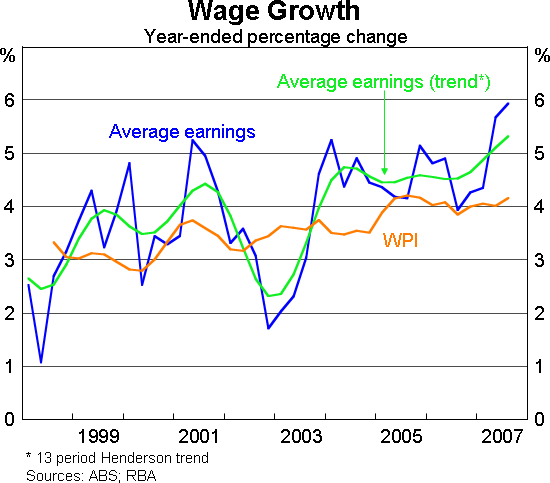
A number of factors seem to lie behind the rise in inflation. These include the general background of strong demand and tight capacity, as well as rises in global commodity prices that have added to business input costs. There is also some evidence very recently of higher wages growth. Although the wage price index has maintained a fairly stable pace of around 4 per cent growth, the broader average earnings measure from the national accounts has picked up (Graph 16). Given its volatility, we have to be careful in giving this too much weight, but the trend in this measure has picked up recently from a 4½ per cent pace to more than 5 per cent.
Against this background, the RBA indicated in its latest statement that domestic demand would have to moderate if inflation is to be brought back to a satisfactory rate over time. The statement recognises that there are a number of forces at work that should contribute to that. As I discussed earlier, prospects for global growth have weakened, and this will have an impact on the domestic economy. Tighter financial conditions are another factor. We've already seen some easing off in credit growth to the household sector, and this is part of the mechanism by which tighter financial conditions can be expected to restrain demand over time.
Taking into account these factors, the RBA forecast is that non-farm growth will slow to a pace of around 2¾ per cent over the next two years (Table 1). Excluding both the farm and the mining sectors, where output is essentially supply determined, growth of the rest of the economy is projected to be slightly lower, dipping to 2½ per cent this year.
| Sep 2007 | Dec 2007 | June 2008 | Dec 2008 | June 2009 | Dec 2009 | June 2010 | |
|---|---|---|---|---|---|---|---|
| GDP | 4.3 | 3½ | 3¼ | 3¼ | 3 | 3 | 3 |
| Non-farm GDP | 4.5 | 3¾ | 2¾ | 2¾ | 2¾ | 3 | 3 |
| Non-farm non-mining GDP | 4.9 | 4¼ | 3¼ | 2½ | 2¼ | 2½ | 2¾ |
| Consumer price index | 1.9 | 3.0 | 3½ | 3½ | 3¼ | 3¼ | 3 |
| Underlying inflation | 3.0 | 3.6 | 3¾ | 3½ | 3¼ | 3¼ | 3 |
|
(a) Actual GDP data to September 2007 and actual inflation data to December
2007. Underlying inflation refers to the average of trimmed mean and weighted
median inflation. For the forecast period, technical assumptions include
A$ at US$0.89, TWI at 69, cash rate at 7.0 per cent, and WTI crude oil
price at US$86 per barrel and Tapis crude oil price at US$90 per barrel.
Sources: ABS; RBA |
|||||||
Growth at that sort of pace should allow some lessening of domestic capacity pressures, and thereby generate a gradual decline in inflation. As a result, inflation by the end of the forecast period is projected to be around 3 per cent, though this is still at the top end of the RBA's target.
In looking at these forecasts, we need to be aware of the significant uncertainties that exist, in both directions. The global economic situation is one important source of uncertainty, as is the situation in world and domestic financial markets. Another is the risk that the recent rise in inflation feeds back into domestic wage and price expectations. All of these will be important areas to watch in the period ahead.
I won't attempt to make any comment on the monetary policy significance of the outlook I've just described, since that has been well covered in our Statement on Monetary Policy last week.
Thank you.