Speech Progress of the Australian Economy

In my previous two appearances at BZW's Australia Day Seminar, I have focussed on the news behind the economic recovery in Australia. I would like to do much the same in this update today.
Some qualifications are always necessary but, overall, the news continues to be positive: growth has slowed to a more sustainable rate; employment is growing strongly; inflation remains under control; productivity and competitiveness have improved; and industrial disputes have fallen to their lowest levels in decades. For the time being at least, financial markets also appear to be more settled.
I will expand on these trends – and their accompanying qualifications – in a moment. I will comment also on some on-going structural changes, particularly in relation to the labour market and competitiveness. These changes tend to be less newsworthy than more immediate developments and their significance is not always appreciated, even within Australia. Yet they represent fundamental changes in structures and attitudes which, unlike the news itself, will have a lasting impact on Australia's economic performance.
Economic Developments
I start with an overview of macroeconomic trends.
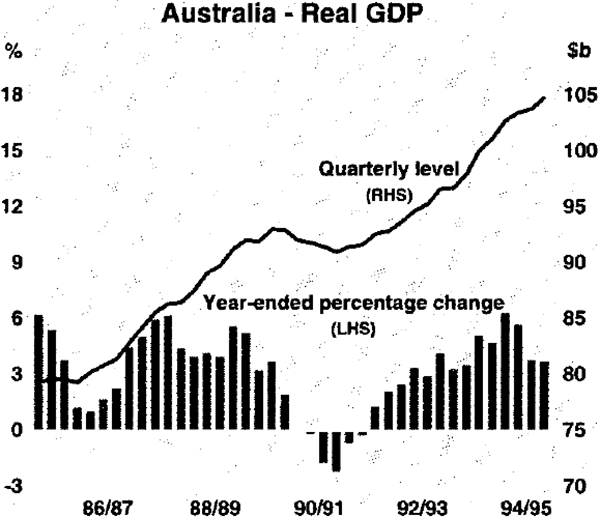
Australia is now into its fifth year of quite solid economic growth. Since the recovery commenced in mid 1991, real GDP has risen by 15 per cent. In the year to the recent June quarter, it rose by 3.7 per cent (Graph 1). This compares with the unsustainably rapid growth rate of 6 per cent recorded in calendar 1994. That growth was accommodated by spare capacity in many parts of the economy, but much of this had been wound back by the end of 1994. Over the coming year, we expect further growth in the 3 to 4 per cent range: this would represent a reasonable outcome, particularly given the proximity of inflation and current account pressures.
Consumer spending has been a major driver of growth in recent years, but so too has business investment. In the past year, real consumer spending rose by 5 per cent. Over the same period, business investment in plant and equipment rose by about 13 per cent, following an increase of 23 per cent in the previous year. Another solid increase in investment is in prospect in the current year, underpinned by generally good prospects for sales and corporate profits, and by a healthy banking system. The recent weakness in the housing sector, after several years of rapid growth, is likely to continue for some time yet, but the decline in non-residential construction appears to be coming to an end.
So far, the slowing in GDP growth in the first half of 1995 has not carried through to employment. Over the 12 months to July, employment grew by 4 per cent, and unemployment declined by 12 per cent. Nearly half of the fall in unemployment was in respect of people who had been unemployed for more than a year. The unemployment rate has fallen from a peak of 11.2 per cent in December 1992 to 8.2 per cent in July 1995, an exceptionally rapid rate of decline. Further, but less rapid, increases in employment and reductions in unemployment are expected over the year ahead.
Not surprisingly, the surge in growth in 1994 and the associated strength of the labour market has led to an increase in wage pressures. Different wage series tell somewhat different stories, but all show a pick-up in wage growth. Our reading of the data suggests that overall wage costs are currently increasing at an annual rate of between 4 and 5 per cent, and probably towards the top end of that range. Executive salaries appear to be rising a little faster.
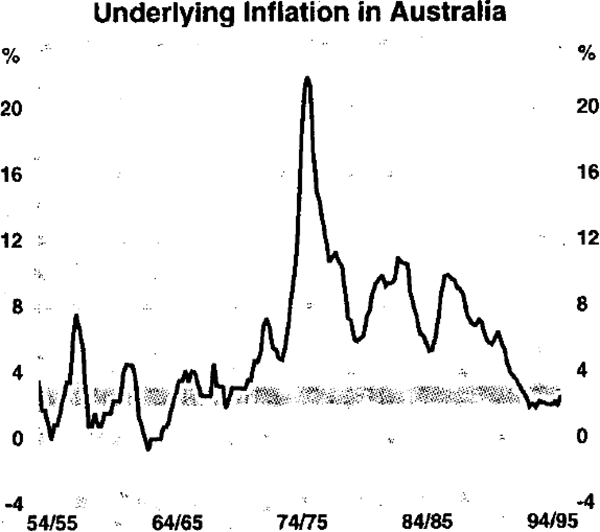
These higher wage costs, combined with higher material costs and higher import costs consequent upon the fall in the exchange rate in the first half of 1995, are generating upward pressure on prices. As a result, underlying inflation increased by 2½ per cent over the past year, after three years of rises of around 2 per cent (Graph 2).
Despite this pick-up, Australia's recent inflation performance remains its best in more than 20 years, and one of the best among OECD countries. It marks a threshold change in the inflationary expectations which have pervaded the community for so long: the perception that Australia is a high-inflation country is now well and truly outdated.
The major task for policy makers at this time is to sustain reasonable economic growth in a low-inflation environment. As you know, many central banks have adopted inflation objectives of one kind or another to help them to deliver low inflation. In Australia, we too have a clear inflation goal, namely to maintain underlying inflation at an average rate of 2 to 3 per cent over the course of the business cycle.
Given the sometimes large and unpredictable effects of cyclical and seasonal factors on consumer prices, we prefer to express our inflation objective in these terms, rather than in terms of a lower, narrow band to be maintained at all times. For much of the 1950s and 1960s – often considered the golden age of low inflation in Australia – the rate of inflation averaged 2½ per cent a year, but it was subject to substantial volatility (Graph 2).
Our objective might sound a little modest compared with some other countries, but its attainment would render inflation a relatively unimportant factor in economic decision making. It is also the kind of result which only a handful of ‘low-inflation’ countries has been able to sustain. Over the past decade, for example, inflation has averaged 1.4 per cent a year in Japan, 2.4 per cent in Germany, 2.9 per cent in Switzerland, and 3.6 per cent in the United States.
I am naturally pleased that both government and trade union leaders support the Reserve Bank's inflation objective. I believe they do so because they appreciate the need for a small trading country like Australia to keep inflation under control in what has become a low-inflation world. And they know that, once lost, it is difficult and costly to restore low inflation.
Given the pressures already in the pipeline, we expect underlying inflation to go above 3 per cent during the coming year. As I have indicated, it is not our objective to fine-tune policy to try to keep inflation within 2 to 3 per cent at all times. But we are committed to seeing that any increase in underlying inflation above 3 per cent is only temporary.
It was with this commitment in mind that monetary policy was tightened quite decisively in late 1994. That tightening has helped to return the economy to a more sustainable growth path, and to check inflation expectations. The slower pace of growth will work against any further upward drift in the rate of cost increases, particularly labour costs. The Accord between the government and the trade unions to keep wage increases consistent with the 2 to 3 per cent inflation objective is another reason for expecting the present wave to peak and pass through the system in a reasonable period.
Policy makers are committed to non-inflationary growth, and prospective wage and other developments in the economy are being assessed in the light of that commitment. For the time being, policy is broadly on track. The best way to stay on track is to stick consistently to policies focussed on this medium-term objective, and to accept the reality that economic growth is an uneven process. To pursue the alternative of frequent fine-tuning of monetary policy in response to particular economic indicators and financial market developments is to go the destabilisation route.
Financial Market Developments
I should mention briefly some recent financial market developments.
As in other countries, these have been decidedly uncomfortable at times. They have reflected both external disturbances, such as the Mexican crisis and the sharp yen appreciation earlier in the year, as well as home-grown concerns – most prominently, the rise in the current account deficit, which I will say more about later.
In line with the general point about policy consistency noted a moment ago, our approach during periods of market turbulence has been to look through the short-term volatility to the longer-term trends. This approach is not always endorsed by financial market participants or economic commentators, but it is the only sensible approach for policy makers to follow. Over the past couple of months, the markets have begun to move more favourably for Australia.
Last year when I spoke at this forum we had not begun the process of tightening monetary policy. That process was initiated by a rise of ¾ of a percentage point in the cash rate in mid August 1994, followed by 1 percentage point rises in both October and December. These rises took the cash rate to 7.5 per cent, where it still stands (Graph 3).
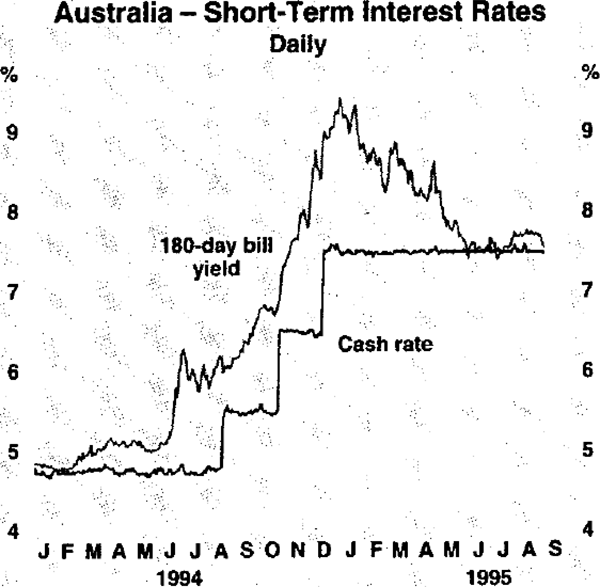
Each of these adjustments had been anticipated in the market place; short-term yields had risen in the months preceding each tightening, and immediately afterwards. Following the last tightening in December, the market priced in further increases, as reflected in the yields on 180-day bills. This expectation gradually faded, however, in the light of evidence that the economy was slowing and that inflation was being contained. The general expectation in financial markets at this time is for the cash rate to remain at its current rate over the months ahead.
Further along the yield curve, developments continue to be dominated by movements in the United States. Speaking at this forum last year, I noted that bond yields in Australia had under-performed those in the United States in the period following the Fed's move to tighten policy in February 1994. This pattern persisted in the second half of 1994. The rally in 1995 also took longer to emerge but, once it arrived, the fall in bond yields in Australia was comparable with that in the United States – measured from their respective peaks (Graph 4). The rally in Australia was supported by lower than expected inflation in the March quarter and by the tightening of fiscal policy in the May Budget.
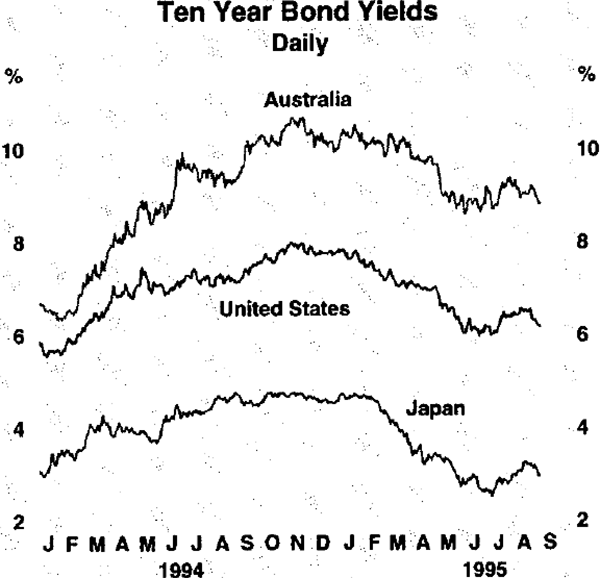
Over the past couple of months, Australia has performed a little better than the United States (and some other countries), causing spreads to narrow somewhat. These spreads are likely to narrow further – that is, the premium on our bond yields will diminish – as more investors come to accept that Australia is no longer an inflation-prone country.
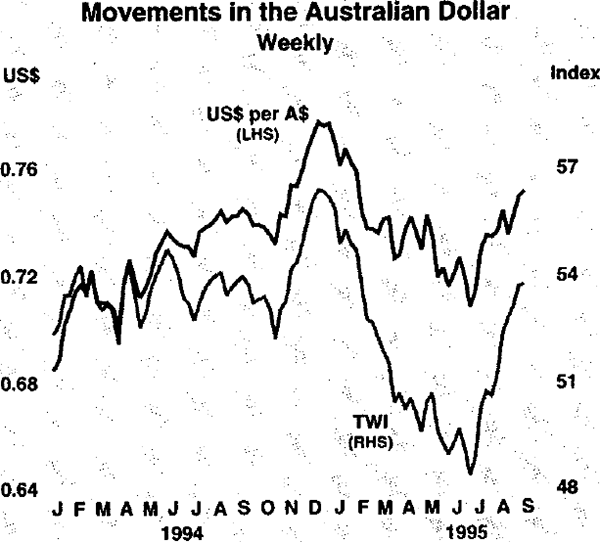
The exchange rate too has witnessed marked swings in sentiment over the past year (Graph 5). It strengthened in the second half of 1994 as interest rates in Australia were raised and the surge in the US economy aroused expectations of higher commodity prices. Sentiment turned negative early in 1995 when the US economy began to slow, and Australia's forecast current account deficit was revised sharply upwards. Over the first half of 1995, the exchange rate declined by 14 per cent in TWI terms, by 9 per cent against the US dollar, and by 23 per cent against the yen. The rebound since the end of June, however, has seen the bulk of those falls reversed. In trade-weighted index terms, the exchange rate today is much the same as when I spoke to you last July. It is up by about 2 per cent against both the US dollar and the yen since that time.
The recovery in recent months appears to reflect a number of influences, including the stronger US dollar and signs that Australia's current account deficit may have peaked. The more benign international economic climate – with the US economy seemingly set to maintain moderate growth, and conditions in Japan perhaps moving a little closer to turning the corner – has also helped.
I draw several observations from these developments:
- first, an open economy like Australia will always be subject to some buffeting when turbulence breaks out somewhere in today's increasingly global financial markets. The best course in such conditions is to try to block out the short-term noise and concentrate on the underlying trends;
- second, policy makers in particular must keep a steady hand on the policy rudder, and at least one eye on the horizon; and
- third, financial markets currently appear to be displaying greater confidence about the Australian economy than has been evident for some time, in part reflecting the prospects for further low-inflation growth in the period ahead.
Labour Market Reforms
I turn now to a couple of areas of microeconomic reform.
Although not universally acknowledged, wage setting and work practices have undergone profound changes over the past decade. These changes deserve greater recognition when evaluating future prospects and investment opportunities in Australia. I want to mention three aspects, namely union attitudes towards inflation; strike activity; and linkages between productivity and enterprise wage bargaining.
Monetary policy obviously plays a major role in helping to achieve low inflation, but it does not operate in a vacuum. In particular, it can be helped, or hindered, by wage outcomes. Australia is almost unique these days in having an incomes policy, which takes the form of an Accord – or understanding – between the government and the trade unions.
I have said many times that I believe the Accord process is a helpful one. It recognises, for example, that planned and gradual tariff reductions make good economic sense, and that wage increases should be linked to productivity improvements. In the latest Accord, which was agreed in June this year, the trade union movement formally committed itself to pursuing wage increases which were consistent with the Reserve Bank's 2 to 3 per cent inflation objective. This commitment will be tested over the year ahead, but the union movement does have a good record in delivering on its commitments in previous Accords.
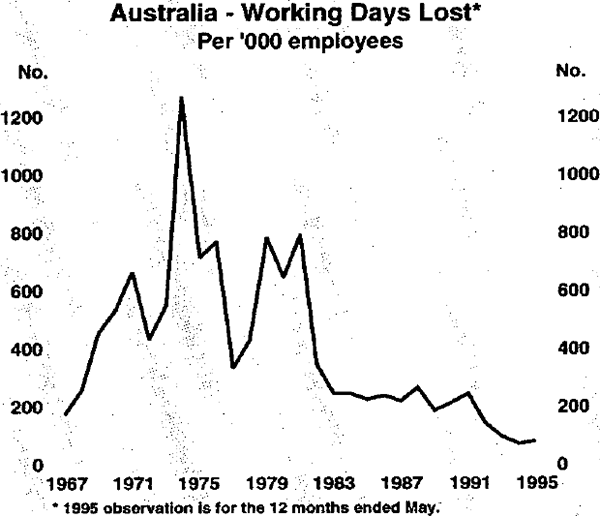
The second change is the sharply lower incidence of industrial disputation. For much of this century, Australian industrial relations have been adversarial and conflict ridden, with dispute levels well above most other OECD countries. In some quarters, perhaps because conflict makes more news than consensus, this still seems to be the popular perception. But this perception is wrong. The recent story on industrial disputation is one of profound change, and runs counter to popular stereotypes about Australia.
You have to go back many decades to find a lower rate of industrial conflict than we have had over the past year, when around 83 working days per thousand employees were lost through strike activity. This compares with an average of around 650 days – around eight times higher – through the 1970s (Graph 6). Australia now ranks reasonably well among OECD countries in terms of working days lost, and no longer deserves to be singled out as a strike-prone country. Unfortunately, changing old mindsets is sometimes harder than changing old work practices.
The third change is the move away from centralised wage bargaining towards enterprise-based arrangements. Approximately 40 per cent of the workforce is now covered by formal enterprise agreements and the proportion is growing. This shift reflects the commonsense notion that giving employees and employers more control over wages, conditions and work practices in their own workplaces is good for productivity growth. Properly pursued, enterprise bargaining is as much about developing co-operative working arrangements as it is about haggling over pay and other conditions.
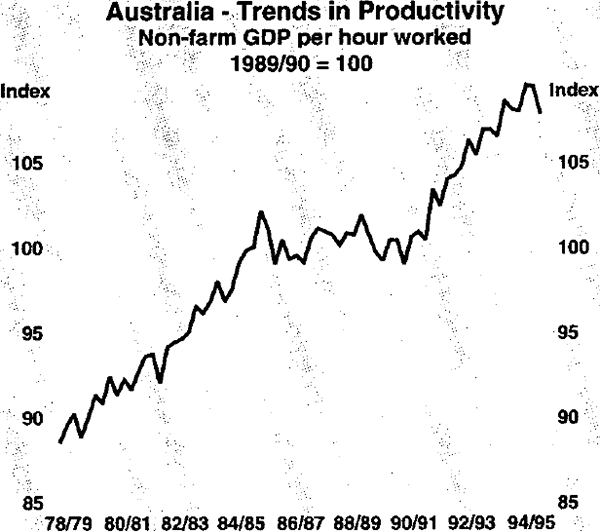
These days, boosting productivity is increasingly seen as the real path to higher living standards. There is fairly broad agreement also that for wage increases to be sustained they must be backed up with productivity gains. This has been happening. Labour productivity growth has averaged more than 2 per cent a year over the past four years, compared with around 1 per cent a year in the 1980s (Graph 7). Some cyclical slowing from the recent rate of productivity growth is now occurring, but we expect to continue to do better than in the 1980s.
Internal and External Competitiveness
Making the economy more competitive – both internationally and domestically – is another area where a good story can be told.
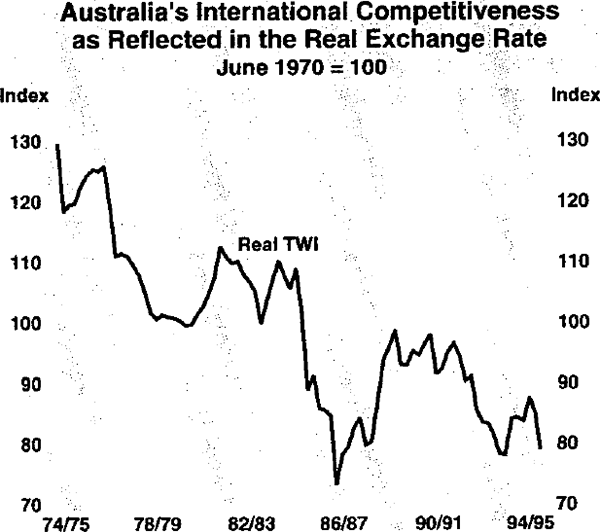
One of the simplest indicators of international competitiveness which is often cited is the real exchange rate. (This measures the comparative cost to foreigners of a basket of goods denominated in domestic currency; because a real depreciation implies that domestic goods are relatively cheaper for foreigners to buy, it is commonly interpreted as an increase in competitiveness.)
For Australia, the real exchange rate (trade weighted index) is currently around 25 per cent lower than in the early 1980s, and 10 per cent lower than in 1990 (Graph 8). This has contributed to many Australian industries becoming more competitive in world markets, as is evident in their continuing strong export performances – notwithstanding that Japan, our largest trading partner, has had little growth for about four years.
On-going real depreciations, however, are not a long-term route to sustained increases in competitiveness and living standards. As I said earlier, that route lies in raising domestic productivity and efficiency. One of the most powerful driving forces in this process is competition. Here, the Government has pursued a two-pronged approach: to lower tariffs and to foster greater internal competition.
The average effective rate of tariff assistance to manufacturing has fallen from 22 per cent in 1984 to around 10 per cent today, and is projected to decline to 5 per cent by 2000. In response, both imports and exports have risen strongly. Australia is now developing a strong export culture, with a keen awareness of the opportunities emerging in the fast growing Asian economies. Today, almost 70 per cent of our merchandise exports go to Japan and other Asian countries, compared with 50 per cent a decade ago.
To the surprise of some people, the tariff reductions have not killed off manufacturing in Australia. In fact, the challenge has revitalised the manufacturing sector. Lower tariffs have changed the mindset of many manufacturers, sharpening their focus on the productivity improvements necessary to compete successfully in world markets. Exports of manufactured goods have grown at an average rate of 17 per cent a year over the past decade and now represent 23 per cent of total merchandise exports. Service exports, particularly tourism, have grown on average by around 9 per cent a year over the same period, and make up more than 20 per cent of total exports. The popular notion of Australia as just another quarry is clearly outdated.
Many of the (mainly) non-traded sectors – including electricity generation, telecommunications, airlines, railways, shipping, and banking – are also being exposed to greater competition through deregulation, privatisation and other measures. Some large gains in productivity are resulting, along with improved services, new products and lower prices. The adoption of a national competition policy last April (the so-called Hilmer reforms) means that State and Federal government businesses will be under increasing pressure to perform.
These are real and substantial reforms, even though the process still has a long way to go. Put in different words, Australia is still a long way from exhausting this potentially rich lode of productivity benefits.
Another major source of such benefits is higher business investment. At the corresponding seminar last year, I observed that the pre-conditions for a strong surge in business investment were in place, including rising sales, lower corporate gearing, buoyant company profits and strong cash flows. That investment has now materialised, and the estimates for earlier years have been revised upwards by substantial margins. Since its trough in September 1992, real investment in plant and equipment has grown at an average annual rate of around 14 per cent. A further strong rise is expected in 1995/96.
National Saving and Debt
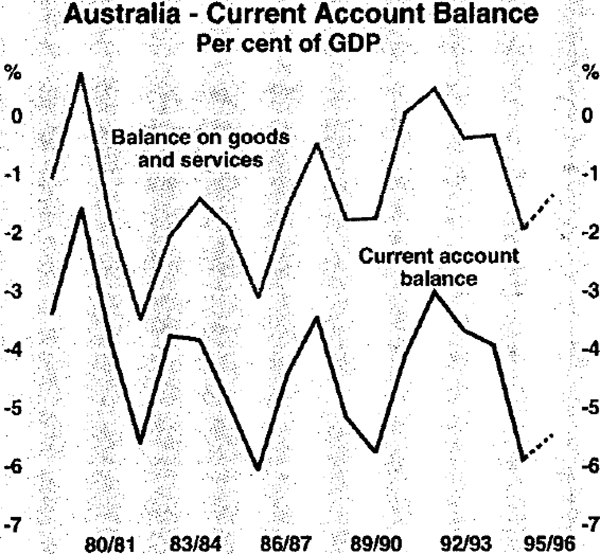
In the absence of a lift in domestic saving, higher investment spending tends ultimately to translate into higher current account deficits. Australia has always run a significant current account deficit – that being, in effect, the channel through which we have drawn on foreign saving to help finance our investment. Recently, however, the current account deficit has widened to around 6 per cent of GDP (Graph 9) and while deficits of a similar size were recorded on three occasions in the 1980s, those kinds of numbers do raise concerns, both at home and abroad.
On-going current account deficits have to be financed by borrowing abroad or by selling assets abroad. Many people see large deficits as a major constraint on sustained, robust growth, while their implications for the exchange rate give them a particular prominence in the minds of foreign investors.
The large current account deficit in 1994/95 was, in part, a consequence of the recent cyclical strength of consumer and, especially, business investment spending, which has a high import content. We expect the growth in imports to slow as the economy slows. Indeed, there are signs that the volume of imports has levelled out in recent months. (Imports of capital goods continue to grow solidly, consistent with strong investment growth, but imports of consumption goods and services appear to have slowed.) The deficit should also decline as the farm sector recovers from the severe drought, which last year cut into the production and exports of cereals and some other agricultural commodities.
Having made those qualifications, however, the fact remains that, in a structural sense, the current account deficit is too high. Over the past decade it has averaged the equivalent of about 4½ per cent of GDP. A lower average figure (say, 3 per cent or less) would undoubtedly ease the current account constraint on growth, as well as our vulnerability to episodes of negative sentiment towards Australia in international financial markets.
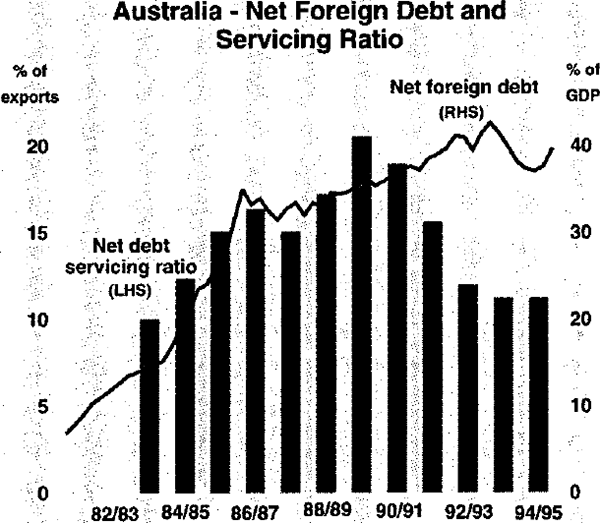
A major focus of this concern is Australia's relatively high level of net foreign debt, which has fluctuated around 40 per cent of GDP in the first half of the 1990s (Graph 10). About 60 per cent of this debt is held by private sector borrowers. To date at least, servicing these debt obligations has not posed any major problems; in fact, debt service payments are currently equivalent to about 12 per cent of total export earnings, well down on the peak of 21 per cent in the late 1980s.
The current account deficit represents an excess of spending over what we produce. We need, therefore, not only to produce more, but also to save more if we are to narrow the gap between spending and production. This has been recognised by the government which has taken several substantial steps to raise national saving. These include measures to boost private saving through increased compulsory pension contributions by employers and employees, and the redirection of some planned tax cuts to pension contributions for low- and middle-income earners. As a result of these measures, the equivalent of up to 15 per cent of employee earnings will be going towards their pension savings by 2002. This translates into an additional contribution to national saving of about 1½ percentage points of GDP by the early years of next century.
Public savings, which are especially important in a country with low private saving, are also set to increase as budget deficits are replaced by surpluses. Excluding the proceeds of asset sales (as we should for national saving purposes), the ‘underlying’ budget deficit is projected to decline from about 3 per cent of GDP last year to about 1½ per cent in 1995/96. It is projected to be in virtual balance in 1996/97, and to be in surplus in later years. On these projections, we can expect a relatively quick and substantial turnaround in the public sector's contribution to national saving.
I mentioned earlier that the bulk of Australia's foreign debt has been incurred by the private sector. In fact, Australia's total general government debt – that is, debt held by both domestic and foreign holders – is very much at the low end of the spectrum for OECD countries (Table 1). Moreover, and in stark contrast to some other countries, Australia's government debt ratio is projected to decline over the second half of the 1990s. In other words, reflecting our relatively good fiscal performance in the past (including four successive federal budget surpluses in the second half of the 1980s) and in prospect, Australia is well on the way to containing a problem which most countries have still to face up to.
| 1995 % | 2000 % | |
|---|---|---|
| Australia | 36 | 31 |
| United States | 63 | 65 |
| Japan | 89 | 102 |
| Germany | 63 | 61 |
| France | 60 | 62 |
| Italy | 122 | 108 |
| United Kingdom | 53 | 47 |
| Canada | 95 | 84 |
| Average for G7 | 73 | 74 |
| Average for OECD | 73 | 73 |
| * OECD Secretariat projections of gross debt of general government sector (excludes public enterprises), expressed as a proportion of nominal GDP. | ||
Conclusion
The Australian economy today is more flexible, more open and more competitive than ever before. This is showing up, for example, in our better export performance over the past decade, and augurs well for sustained, strong growth. Australians generally understand that today's increasingly global markets put a premium on maintaining international competitiveness. That is why a broad consensus exists in favour of on-going structural change. They appreciate the value of the changes made to date and, furthermore, recognise that the clock cannot be turned back.
Good progress has been made but, as always, more needs to be done. Barring major shocks in the world economy, we expect to see further growth in activity and employment in Australia over the year ahead, albeit at a slower – but still respectable – pace. Inflation will also kick up above 3 per cent, but there are reasons to expect this to be temporary. Over the longer term, I believe that policy is moving in the right direction, boosting national saving and creating an economic environment which promises to lift living standards and to offer a lot to national and overseas investors alike.