Speech The Australian Foreign Exchange Market in the Recovery

Guy Debelle
[1]
Assistant Governor (Financial Markets)
Westpac Research and Strategy Forum
Sydney –
- Audio 17.6MB
- PDF version 38KB
It has been an interesting time in foreign exchange markets over the past two years, although maybe not quite as interesting a time as it was in other markets. The foreign exchange market has generally functioned better than most other markets throughout, notwithstanding some periods of extreme volatility.
In this speech I will describe how the foreign exchange market has operated through the recovery in financial markets we have seen over the past nine months and discuss some of the movements in the Australian dollar, which has traversed a range of almost 40 cents against the US dollar over the past year. In recent months, intra-day volatility in the market has declined, liquidity in the spot market has improved and the use of central bank swap lines has diminished considerably (in the case of the RBA, the swap line has been completely unwound). Despite these improvements, some traces of the crisis remain. For example, foreign exchange turnover remains well below its pre-crisis levels.
Developments in Foreign Exchange Turnover
The global financial crisis resulted in a reversal of the rapid growth in global foreign exchange turnover seen since the start of the decade. Turnover data, collected by foreign exchange committees in six financial centres semi-annually, show that turnover fell by nearly 25 per cent from its peak to be around US$2.3 trillion per day in April 2009, a level of turnover last seen in 2006 (Graph 1).
The fall in foreign exchange turnover has been broad-based. Turnover has fallen in all six foreign exchange centres, reflecting the global nature of the crisis. Unsurprisingly, the largest falls in turnover were in the US and UK, reflecting their role as the dominant financial centres. Turnover in Australia fell by almost 25 per cent between April 2008 and 2009.
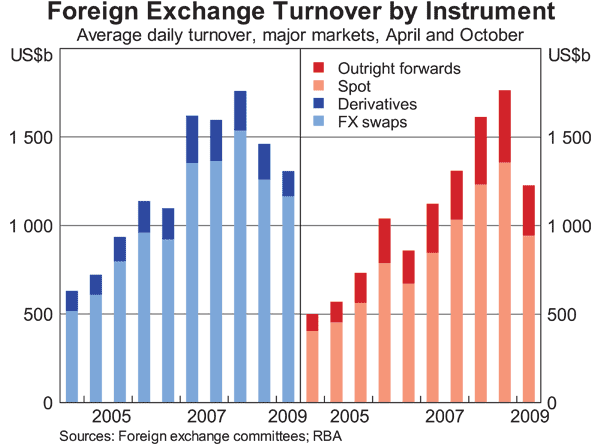
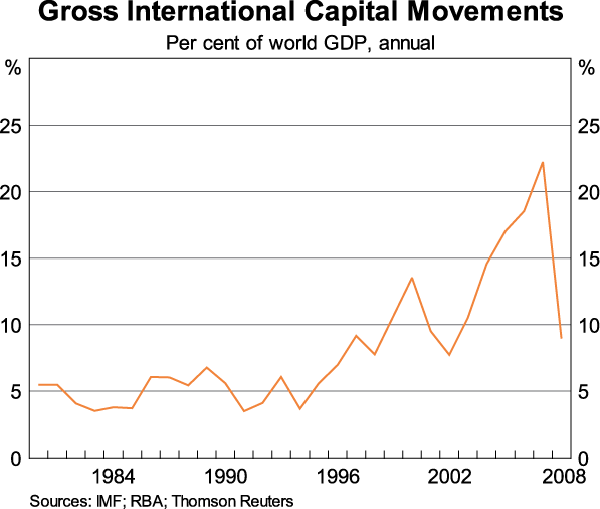
Turnover has also fallen across all types of foreign exchange instruments. However, turnover in the swap and more exotic derivative markets declined earlier than the spot and forward markets. This difference may be explained in terms of the uses, risks and complexity of the different types of instruments. The decline in foreign exchange swap turnover coincided with the sharp decrease in cross-border investment flows, which fell from more than 20 per cent of world GDP in 2007 to less than 10 per cent of GDP in 2008 (Graph 2), as well as heightened concern over counterparty risk. Two key users of foreign exchange swaps are banks and hedge funds. By October 2008, deleveraging by hedge funds was well underway, reducing their need to use swaps and with heightened counterparty risk, non-US banks were having increasing difficulties using swaps to fund US dollar positions.
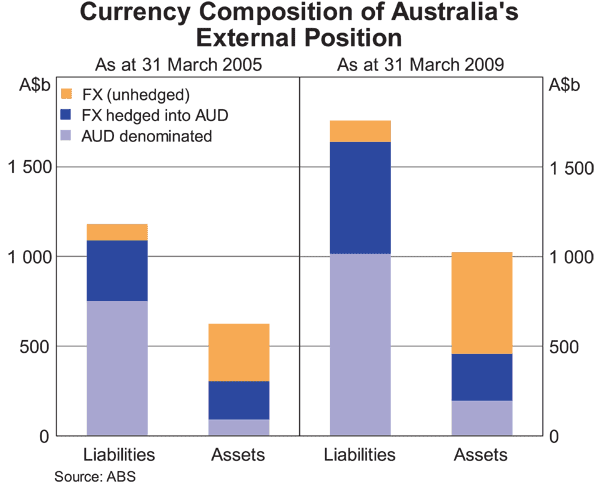
Turnover in derivatives, such as cross-currency interest rate swaps, has also fallen since April 2008. This market is of particular interest in Australia because of the role that foreign currency debt raisings play in Australian bank funding and the use of cross-currency swaps to translate the foreign currency raised into Australian dollars. The 2009 hedging survey conducted by the ABS, with RBA sponsorship, showed that banks hedge almost all of their foreign currency debt liabilities, with cross-currency interest rate swaps – the primary derivative instrument used to do this (Graph 3).[2] In contrast, Australian residents' holdings of foreign assets are partially hedged. As a result of this, despite foreign currency liabilities exceeding foreign currency assets, once hedging is taken into account, Australian residents in aggregate have a net foreign currency asset position.
In contrast to many other markets, turnover in the spot market actually increased between April and October 2008. This is probably largely explained by an increase in demand as customers sought to adjust positions in response to the flood of news and events surrounding the collapse of Lehman Brothers and the associated increase in volatility.
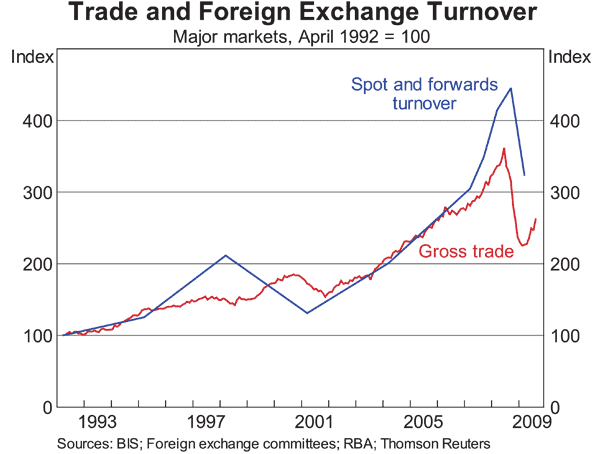
The subsequent fall in spot turnover since October 2008 is therefore due, in part, to the reduction in volatility and slower rate of news flow. However, an additional driver behind the slowdown is the fall in gross trade flows in response to the economic slowdown. Spot and forward turnover have moved broadly together with gross trade over the past two decades (Graph 4). Trade flows generate spot demand because trades are frequently invoiced in non-local currencies. For example, a 2007 ABS survey found that almost 80 per cent of Australian exports are invoiced in foreign currency, predominantly the US dollar.
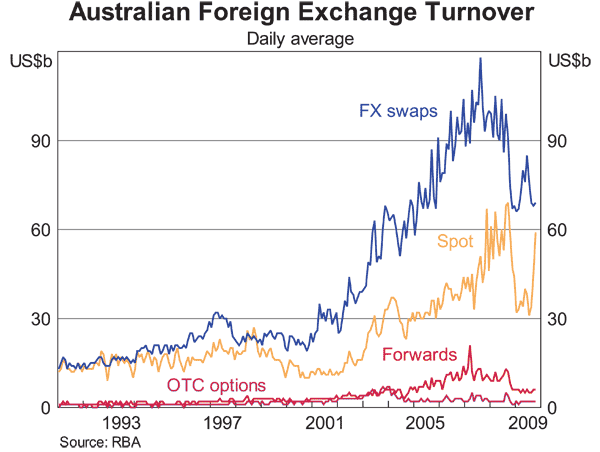
Looking forward, one positive sign for spot turnover is that gross trade has been picking up since April. More timely turnover data for the Australian foreign exchange market also indicate a pick-up in spot turnover (Graph 5). Spot turnover in Australia has increased sharply in recent months to be close to its pre-crisis peak.
Lower turnover in the foreign exchange market does not appear to be linked to any problems with market function. Indeed, throughout the financial crisis, the foreign exchange market has tended to function better than most other markets. Liquidity has improved in the spot market over recent months, with the bid-ask spread currently approaching pre-crisis levels (Graph 6), although market participants report the market remains prone to episodes of reduced liquidity.
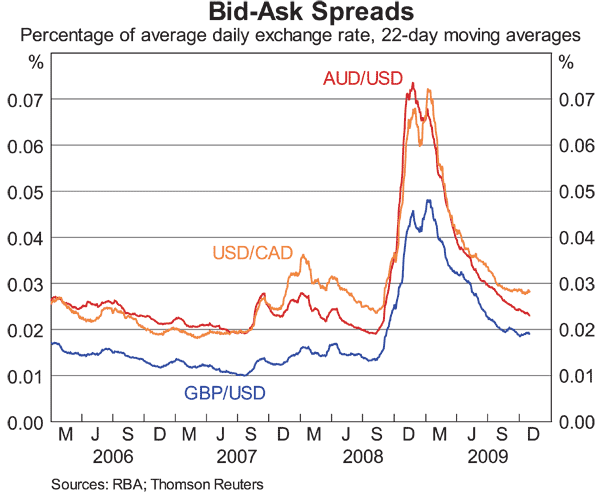
This is in stark contrast to October and November last year, when at times the daily average of the bid-ask spread widened to as much as US0.07 cents, relative to a pre-crisis level of US0.02 cents. At that time, risk retrenchment and the unwinding of leveraged position were generating one-sided markets. As an example, one group of participants reportedly contributing to one-sided markets were fund managers adjusting the foreign currency hedges on their foreign equity investments. The 2009 hedging survey found that Australian investors hedge around 50 per cent of the currency risk on their foreign portfolio equity investments. As global equity markets fell sharply late last year, the size of these hedges became too large relative to the value of the equity portfolio. In order to correct the hedge, fund managers needed to sell Australian dollars either in the spot or forward markets. Although this sort of hedge adjustment is occurring all the time, the extent of the falls in equity markets meant these flows were much larger than usual, and the trades were being executed in much thinner markets.
In this environment the Bank entered the market to support liquidity and reduce the size of ‘gaps’ in the exchange rate that occurred as the large Australian dollar flows were digested by the interdealer market. The Bank's interventions were not designed to target any particular level of the exchange rate, but rather to enhance the functioning of the market. Net sales of foreign exchange by the RBA in the market totalled just under A$3½ billion in October and November. Because of the nature of the transactions which were going through the market, the size of the Bank's individual transactions were generally very small, in contrast to our intervention in the market in 2001.
As I'll go on to discuss, since its trough in March, the Australian dollar has appreciated to be well above its long-run average on both a trade-weighted basis and against the US dollar. With market conditions normalising, the Bank has therefore taken the opportunity to replenish the foreign reserves that were deployed during this episode.
Australian Dollar in the Recovery
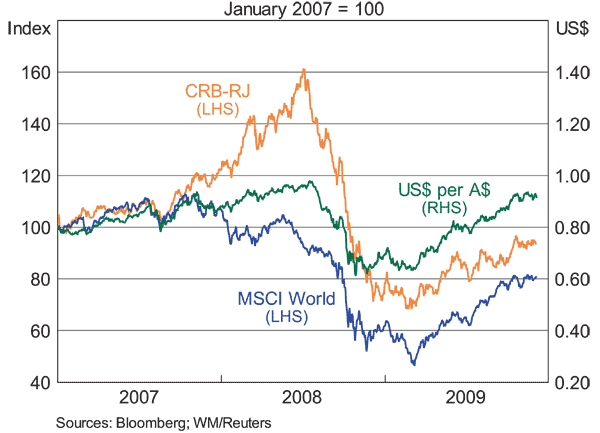
As I said earlier, the Australian dollar has traded through a very wide range over the past year or so. The forces that were behind last year's sharp depreciation have retreated in the face of the co-ordinated global response to the financial crisis, and many of them are now working in reverse. On a trade-weighted basis the Australian dollar is now only around 5 per cent below the peak seen in July 2008. The rebound in the Australian dollar has been particularly rapid when compared to the recovery in other markets that have benefited from the improved outlook (Graph 7).
In broad terms, the behaviour of the Australian dollar over the past 18 months can be explained by the large swings we've seen in risk aversion and expectations about economic fundamentals.
The Australian dollar is often described as a ‘commodity currency’, meaning there has been a historically strong relationship between the Australian dollar and the terms of trade and commodity prices. As a result, the Australian dollar has been particularly sensitive to the large and rapid changes in expectations for world growth that have occurred over the past 18 months. One way to demonstrate these swings in expectations is to look at the evolution of IMF forecasts for world growth since 2008. Prior to the collapse of Lehman Brothers, world growth forecasts were around 4 per cent for 2009. However, by April this year expectations for 2009 had been revised down below zero. April proved to be the nadir for global growth forecasts. The latest IMF forecasts put average growth in 2010 at around 3 per cent, a significant improvement on six months ago.
The other key factor behind the fall and subsequent rise of the Australian dollar has been fluctuations in risk aversion. Risk aversion took on a special importance for financial markets late last year, with the VIX, often used as an indicator of risk aversion, reaching 20-year highs. Heightened risk aversion contributed to the depreciation of the Australian dollar last year. Investors worldwide were repatriating their holdings of foreign assets as their risk aversion increased, that is, there was a marked increase in their home bias. Given that American and Japanese investors have the largest (by volume) offshore investments, this saw the US dollar and yen appreciate. As that home bias has abated and investors have rebuilt their offshore portfolios, the US dollar, in particular, has depreciated.
For Australia, this implied a slower rate of investment by foreigners and the balance of payments data show there was an outflow of foreign private capital in the December quarter 2008. There was also a sizeable repatriation of foreign portfolio investments by Australians through late 2008 and into early 2009, but at only half the size it did not completely offset the outflow and there was temporarily a slower rate on net of capital inflow into Australia.
Moreover, highly leveraged investors mostly located overseas, such as hedge funds, were forced to liquidate portfolios that often included Australian dollar investments as losses mounted in other parts of their portfolios. This pressure was exacerbated by the need for these funds to reduce their leverage.
Furthermore, the hedging transactions I described above, added to the downward pressure on the currency. The more the currency depreciated, the more this type of transaction occurred, which added to the downward pressure given the thinness of the market. As the currency has subsequently appreciated and equity prices have increased, the reverse dynamic has occurred.
The Australian dollar was, at times, also used as a proxy for trading in other currencies. Because the Australian dollar is traded in all time zones in a relatively liquid market, traders were able to adjust positions in other less liquid (or non-globally traded) currencies. For example, the Australian dollar was reportedly used as a proxy for trades in the Korean won during New York trading hours when the won is not traded, and as a proxy for the Brazilian real during Asian time when the real is not traded.
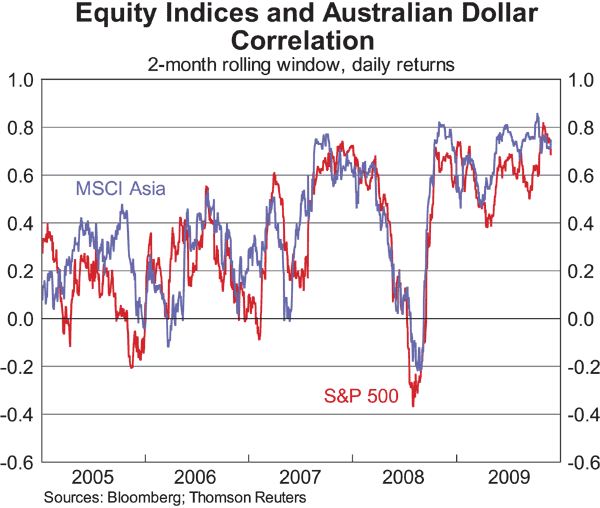
The link between the Australian dollar and the global investors' fluctuating attitude toward risk is reflected in the strong increase in the correlation between the AUD/USD exchange rate and equity indices from the middle of last year (Graph 8). What is interesting is that this correlation has remained so high since the start of the year, even as market conditions have improved. This suggests that the perceived reduction in risk has been an important force in driving the appreciation of the Australian dollar since March. Looking at the balance of payments data again, there have been large net inflows of foreign capital into Australia since the start of the year as the home bias of global investors has eased.
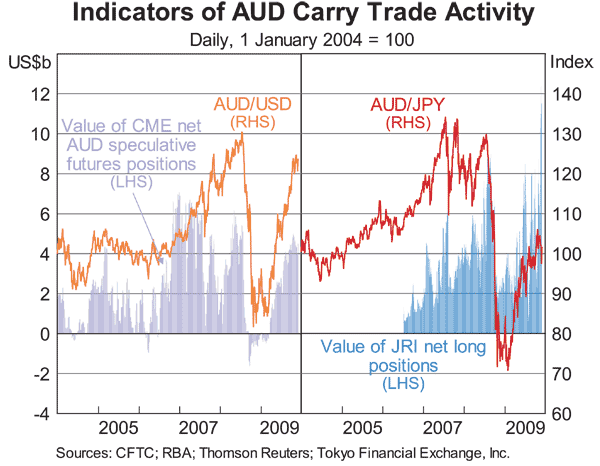
The Australian dollar carry trade now again appears to be back in vogue.[3] It is difficult to find concrete data on the absolute size of carry trade positions, but two sources of data we can use as indicators of potential carry trade activity are the net positions of speculative futures traders at the Chicago Mercantile Exchange and the net positions of Japanese retail investors. As you can see, both these groups of traders have been increasing the size of their net long positions in the Australian dollar since the start of the year (Graph 9). The Australian interest rate differential remains relatively high compared to most other major currency pairs, and the recent appreciation of the Australian dollar has seen AUD-YEN simple carry trade returns (ignoring transaction costs) of almost 30 per cent since the start of the year.
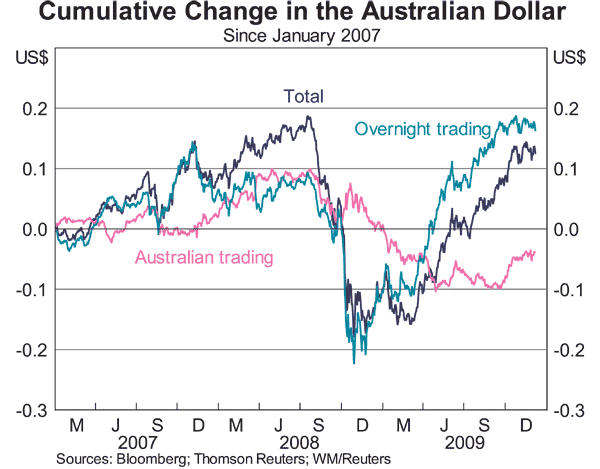
Given the roles that world growth expectations and risk aversion have played in driving movements in the Australian dollar recently, it is not surprising that a large part of the depreciation and subsequent appreciation that has occurred over the past 18 months has been happening during the overnight session (Graph 10). In fact, the Australian dollar has actually been trading broadly sideways during the local session since the start of the year.
Conclusion
The past two years have seen major disruptions to many financial markets. By and large, the foreign exchange market has tended to function better than most other markets. Turnover in many foreign exchange instruments has declined to be well below previous peaks, although more recently, we have seen turnover increasing again.
The Australian dollar has moved through a wide range, in part reflecting large portfolio adjustments by global investors. However, the movement in the exchange rate has once again proven to be an important means of assisting the Australian economy adjust to changes in the global economic environment. As on earlier occasions, the economy has proven to be resilient to these swings.
Endnotes
I thank Emily Poole for her assistance with this talk. [1]
D'Arcy, P, M. Shah Idil and T. Davis, ‘Foreign Currency Exposure and Hedging in Australia’, RBA Bulletin December 2009. [2]
What is meant by carry trade seems to vary commentator by commentator. Often commentators are defining carry trades as one where an investor places their funds in a yielding investment, which I would call simply sensible investing. I am referring to carry trades as leveraged cross-border investment. [3]