
Bulletin – May 2026 Financial Stability Insights From New Data on Australian Housing Investors
Transcript
Our recent Bulletin article insights from new data on Australian housing investors provides a richer view of housing investors in Australia than was previously possible. It uses newly available and highly granular Australian Bureau of Statistics data. This dataset includes anonymised personal level data which covers a full population of housing investors in Australia. It shows that about 3.3 million people in Australia have an investment property, which equates to roughly 10 per cent of the working age population.
From this work, we now have a much clearer, system-wide view of investor behaviour.
There are a few reasons why the RBA is interested in housing investors, but is ultimately because we need to work with other agencies to safeguard the stability of the financial system. Individual housing investments are an important part of our financial system and more so than in many other countries. So we need to understand whether they pose risks and, if so, what the biggest risks are.
To answer these questions, we need to know about the characteristics of housing investors.
The data shows that, generally speaking, investor characteristics have been broadly stable over the past three decades. Housing investors have tended to be higher income earners. Nearly 40 per cent of investors have come from the top 20 per cent of income earners in Australia. Around 70 per cent of investors own a single property, but the remaining 30 per cent with multiple properties hold about half of all investment properties in Australia.
Owning multiple properties has become a little more common over the past two decades. The share of housing investors with an outstanding loan has remained relatively stable over the past two decades, and the share of housing investors who are negatively geared has shifted over time. Although this has largely reflected changes in interest rates.
In looking at investor debt and financial risk, we find that investors generally carry higher debt relative to their income than owner occupiers. In 2021, about 1 in 5 had outstanding debts greater than six times their income, which is considered higher risk. And over a third of all investors hold debt on both their home and investment property. Even though investors carry more debt, they've historically defaulted less on their loans.
This is partly because they tend to have higher incomes and more financial buffers than owner-occupier borrowers.
We found two key structural trends that stand out in our research. First, we can say that the investor base is ageing, with more than a quarter now over 60. This could reduce financial resilience in a downturn, if these older investors are more reliant on rental income than other borrowers. However, older investors may also have greater accumulated wealth or supplementary sources of income, such as pensions they could draw on.
As well, we found that portfolios are gradually diversifying geographically, meaning more investors with multiple property holdings are locating these investments in different areas. That said, holdings are still quite concentrated. Around 80 per cent of multi property investors still invest within a single state, meaning they could be vulnerable to fluctuations in local housing markets.
Overall, the evidence points to a resilient investor population, but there are areas of vulnerability that we would need to keep watching and more work to be done on how investors might respond to economic shocks.
Abstract
This article provides a materially richer view of housing investors than previously possible, enabled by newly available data from the Australian Bureau of Statistics’ Person Level Integrated Data Asset (PLIDA). These administrative data provide coverage of the full population of housing investors in Australia and allow a more granular assessment of housing investor characteristics over time. The analysis shows that investor characteristics have remained broadly stable over the past 20 years, a period over which investors have tended to default on their loans at a lower rate than owner-occupiers. Investors are typically higher income earners, supporting their creditworthiness, and most own only one investment property. One demographic shift has been the increase in the share of the investor population comprising older cohorts. The share of investors with an outstanding loan has not materially changed over time, although investors have tended to borrow with higher property-related debt-to-income ratios than owner-occupiers; around one-fifth of investors had high levels of housing debt relative to their incomes in 2021. To date, this has not translated into higher default rates, though Australia has not experienced a severe housing downturn over this period that might have otherwise tested these investors’ capacity to service debt.
Introduction
Housing investors differ from owner-occupiers in both their incentives and behaviour. Their housing purchase decisions are primarily driven by expected financial or capital returns rather than finding a place of residence, and tax incentives such as deductibility of interest expenses further shape their behaviour. Unlike in many countries, households in Australia comprise a significant share of the investor base in the residential property market; this is one factor contributing to Australia’s relatively high level of household debt. While investors have historically recorded lower default rates than owner-occupiers, and account for a smaller share of overall housing credit, they have tended to exert a greater influence on housing market cycles.
The RBA has previously noted that housing investors, on average, have higher incomes, greater wealth, and larger liquid asset buffers than owner-occupiers (RBA 2014; RBA 2022a; RBA 2022b; RBA 2023a). However, several structural characteristics of investor lending can heighten vulnerabilities in select segments of the investor population. Investors are more likely to use interest-only loans, may hold multiple properties, and an increasing share are older (RBA 2014; RBA 2017).
More recently, the RBA has highlighted the relatively pro-cyclical nature of investor borrowing: compared with owner-occupier borrowing, it tends to pick up more when interest rates fall, is more sensitive to expected price changes, and is more likely to amplify market swings through entry during periods of rapid price appreciation and exit during downturns (RBA 2025a; RBA 2025b). For these reasons, the RBA has noted for some time that heightened investor activity could lead to a build-up in financial vulnerabilities if this behaviour significantly amplified the housing credit and price cycle, including by contributing to owner-occupiers taking on more debt than otherwise (RBA 2025a; RBA 2025b; RBA 2026).
This article uses newly available micro-level data to deepen our understanding of housing investor characteristics and leverage positions. By moving beyond previously available semi-aggregate and survey measures, this comprehensive administrative dataset provide new insights into the implications of investor activity for financial stability. Investors are important for financial stability because, if their activity were to drive unsustainable increases in housing prices, leverage or weaker lending standards, the economy would become more vulnerable to macroeconomic shocks.
Data
This article uses person-level data from the Australian Bureau of Statistics’ (ABS) Person Level Integrated Data Asset (PLIDA), which has been enhanced by the recent Wealth and Housing Assets Module (WHAM) project. PLIDA-WHAM is a linked administrative dataset containing de-identified information on the Australian population (Bradshaw et al 2025). The key input for this analysis is newly available rental property schedule data, which cover individuals who lodge a tax return reporting rental property-related income and expenses. As such, the dataset captures the whole population of tax-complying individual housing investors in Australia.1 These data maintain strong privacy and confidentiality protections. The ABS de-identifies all data prior to the RBA accessing the data and thus we cannot identify any specific individual.
The rental property schedule data are linked to several complementary administrative sources, including residential address histories, annual income from tax records from the Australian Taxation Office (ATO), core demographic characteristics, and household-level owner-occupier mortgage payments from the 2021 Census.
The analysis in this article covers the period from financial years 1999/2000 to 2022/23. Data covering the most recent two financial years – a period of strong investor credit growth – are not yet available. However, lending quality throughout this most recent period did not show a material change, suggesting trends over the last three years might be somewhat similar, although rising house prices may have contributed to some change in borrower characteristics.2 Annual data updates will allow us to track how the characteristics analysed in this article continue to evolve.
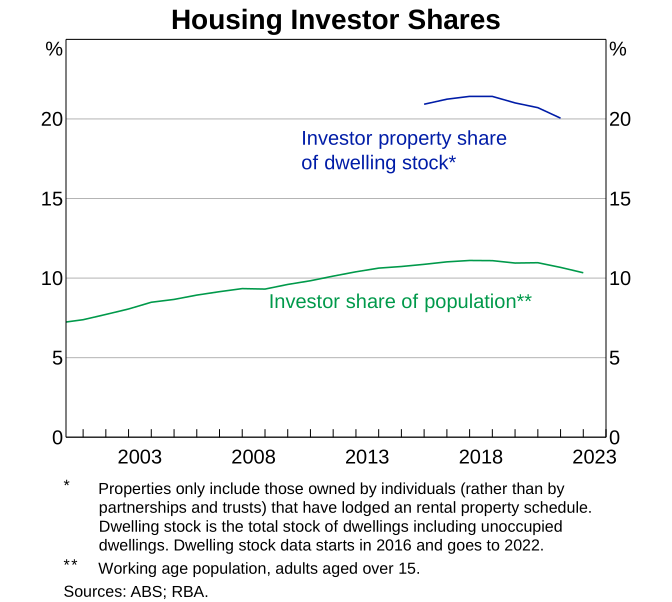
As at 2022/23, there were 2.3 million individual housing investors, equivalent to roughly 10 per cent of the working-age population. This number is consistent with previous work using semi-aggregate ATO taxation statistics (RBA 2017). Investment properties accounted for around 20 per cent of the dwelling stock.3 The share of investors relative to the working-age population rose steadily over the 2000s and 2010s, but has been broadly stable, more recently (Graph 1).
Individual investor characteristics
Most housing investors own a single investment property
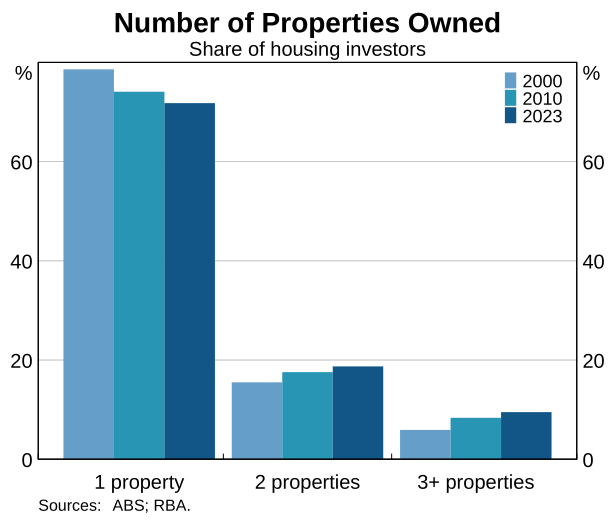
As at 2022/23, around 70 per cent of housing investors owned just one investment property. The remaining 30 per cent owned multiple properties, though those with multiple investment properties owned around half of all investment properties. The share of investors owning more than one property has increased by 7 percentage points over the past two decades (Graph 2).
The financial stability issues associated with housing investors holding multiple properties are nuanced. Owning multiple properties can provide benefits during a negative economic shock, from diversifying income streams and asset values. However, investors holding multiple properties tend to carry more debt. Resilience could be undermined if the portfolio of properties is highly leveraged (with little equity cushion). In a negative shock, synchronised sales of highly leveraged investment properties could depress the value of all properties (given prices are set at the margin) and thus amplify the housing price cycle in a downturn. Any diversification benefits from holding multiple investment properties could also be foregone if these holdings were geographically concentrated or similar in type.
Owners of multiple properties tend to own investment properties in a single state
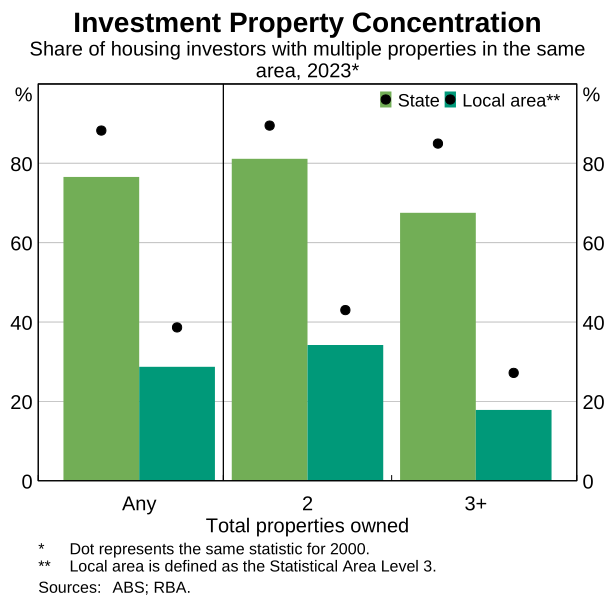
Around 80 per cent of housing investors who own multiple properties hold them in the same state or territory (Graph 3).4 In addition, a more granular view of concentration risk shows around 30 per cent of multiple property owners hold all their investment properties within the same local housing market.5 Translated to the overall stock of investors, 8 per cent own multiple properties that are located in the same local housing market. Both the state and local housing market concentration measures suggest substantial geographic concentration in investment property portfolios, although investors who own more properties tend to be a bit more geographically diversified. Relative to 1999/2000, investors have steadily become less geographically concentrated in their property holdings. This could reflect lower frictions to out-of-area purchases as buyer agents and cross-state property management have become more prevalent, and property listings have become more available online.
The more geographically diverse a housing investor’s holdings are, the less vulnerable they are to localised economic downturns, natural disasters, or state-specific regulatory changes. In line with this, regions close to each other tend to experience similar cycles of listing activity, vacancy rates, rental yields, and housing prices. On the other hand, investing across state borders could be riskier if investors have less knowledge of distant property markets.
Housing investors tend to be older and higher income earners
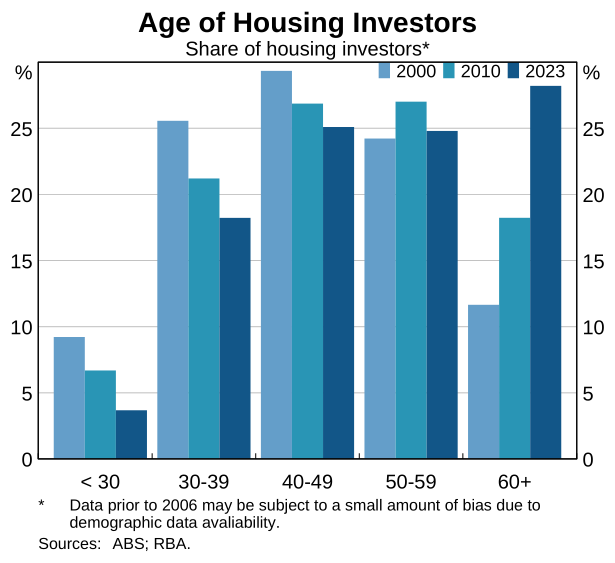
The median age of housing investors increased from 45 to 51 years between 1999/2000 and 2022/23. Over this period, the share of housing investors aged over 60 years has risen from 12 to 28 per cent (Graph 4). This shift reflects both broader population ageing and an increasing incidence of property ownership among older cohorts, with around 40 per cent of the change attributed to broader population ageing.
There has been a notable increase in the share of housing investors aged over 60 with a mortgage over recent decades. However, only around half of investors in these older cohorts had a mortgage against their investment property in 2022/23 (materially below the figure for younger cohorts). In addition, the average retirement age has risen over time, and so older investors are more likely to still be working (even if they are working fewer hours and earning less labour income). Older investors may also have greater accumulated wealth or supplementary sources of income, including from superannuation portfolios, other financial assets held outside the superannuation system, and pensions. That said, a large decline in the value of asset portfolios (from which income streams are drawn) could reduce the financial resilience of some older investors in the event of an economic downturn.6
Alongside the increasing age profile of housing investors, as a group they tend to be higher income earners.7 Higher income earners are much more likely to own investment properties than those on lower incomes. In 2022/23, the highest income quintile accounted for nearly 40 per cent of all housing investors in Australia. Over the past decade, investor participation has become marginally more skewed towards higher income households away from the middle of the distribution (Graph 5).8
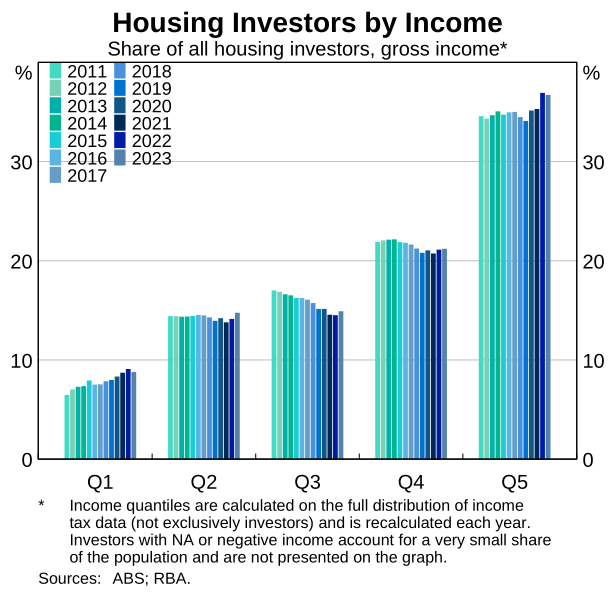
Several factors explain the large share of high-income housing investors. Higher income investors have greater borrowing capacity and have benefited more from tax concessions such as negative gearing and capital gain discounts. Rising property prices have lifted entry costs, making housing purchases harder for lower and middle-income households over time. For stability of the Australian financial system as a whole, the prevalence of high-income investors is a source of resilience. Higher income households also spend a smaller share of their income on essential expenses, giving them greater capacity to absorb shocks, and they have historically been less likely to become unemployed (RBA 2023b; RBA 2024).
Negative gearing and using leverage are common among housing investors
The share of housing investors with at least one negatively geared property rose in the period prior to the global financial crisis, declined over the subsequent decade, before increasing again more recently (Graph 6). Movements in the share of negatively geared investors have largely reflected changes in interest rates. Lower rates reduce interest expenses and therefore shift some investors from being negatively to positively geared. Given the substantial rise in interest rates since 2021/22, this trend has started to reverse and the share of negatively geared investors is likely to have increased further over recent years.9
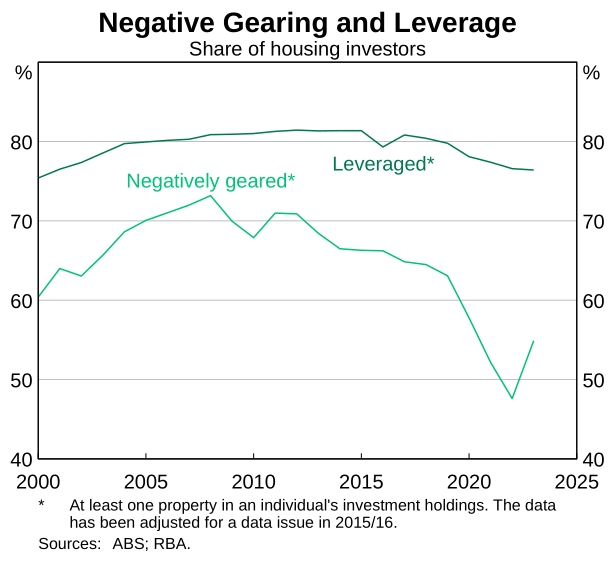
Many housing investors negatively gear their properties to avail of tax deductions on interest and other property-related expenses, with the expectation that long-term capital gains will outweigh short-term losses. However, this reliance on future price growth can leave investors exposed to changes in interest rates, housing demand, and broader macroeconomic conditions. In a downturn, rental income could also be disrupted. This reliance on capital gains alongside negative cash flows may make investors more likely to sell during a downturn or when expectations of future price growth are reassessed. However, negative gearing is more prevalent among higher income investors and less common in older cohorts, which somewhat offsets this channel as a source of potential vulnerability. These investors are likely to have greater capacity to absorb shocks.
The share of housing investors with at least one leveraged property – that is, a property with an outstanding loan balance – has remained relatively stable and is high at around 80 per cent of investors. A slight decline in more recent years likely reflects an increasing share of older investors, who may have already paid off their housing debt and therefore have lower need and capacity to borrow from banks. The absence of a material change in this share is consistent with broadly stable investor credit profiles. A significant increase over a number of years, if it were to occur, could potentially point to rising indebtedness within the investor segment or a shift towards riskier borrowing behaviour. While the share of investors who are leveraged has remained broadly stable, the share of highly leveraged investors may have shifted over time, potentially affecting overall risk. While possible to examine, this is beyond the scope of this article.
Over one-third of investor households have an outstanding loan on both their investment property and primary residence
As discussed above, the aggregate share of housing investors who are leveraged has been relatively stable. For the years in which Census data are available (e.g. 2021, 2016), we can examine a snapshot of the distribution of leverage across both investment properties and owner-occupier dwellings. These data are not directly available in PLIDA-WHAM and are therefore estimated. For investor loans, estimates use reported interest expenses from rental property schedules, while for owner-occupier loans they use reported mortgage repayments from the Census. In both cases, estimates rely on an assumed interest rate path and a few assumptions (see Appendix A for details).
At the household level, most investor households have a leveraged investment property and around one-third have leverage on both their investment and owner-occupier properties (Graph 7).10 For households with investor leverage, around one-quarter have more than one investment property.
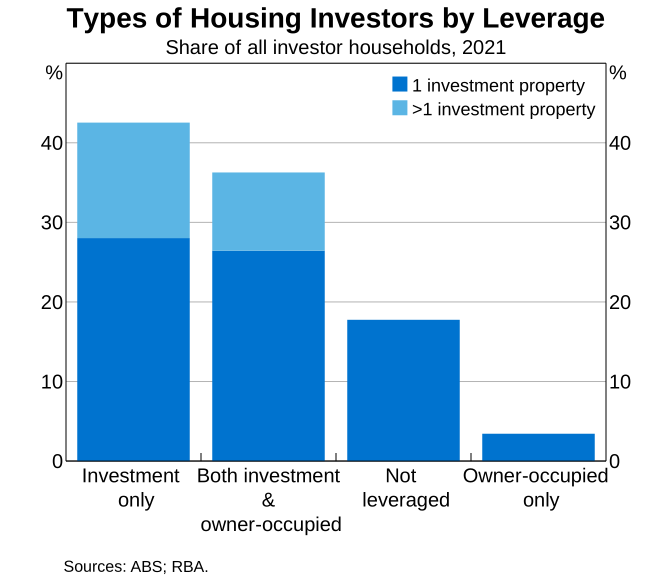
Housing investors with multiple loans must service them concurrently. If these investors are more indebted overall, this would make them more sensitive to shocks due to higher repayment obligations. However, there is some important nuance here. It is possible that an investor household with debt allocated across only investment properties could be more resilient than a household with a similar amount of debt used to purchase an owner-occupied dwelling because the former earns rental income on their investment properties. Leveraged investors could also service a loan with a higher overall debt-to-income (DTI) ratio compared with other borrowers because interest deductibility can be factored into their loan serviceability assessment. It is also possible that an investor selling their investment property to extinguish their debt could be less disruptive to them (although their tenants could be disrupted) than an owner-occupier selling and moving out of their primary residence. Further, all investors would be subject to serviceability tests as each loan commences, based on the combined loan servicing costs from all of their loans.
Housing investors tend to have higher amounts of leverage than other types of borrowers
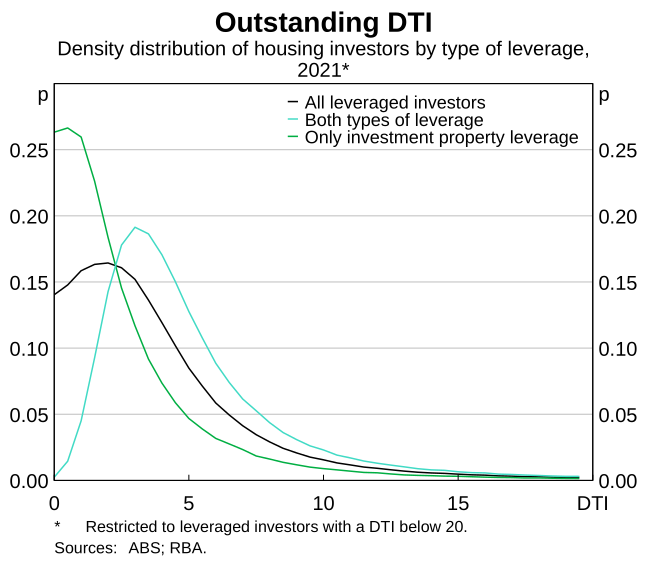
Based on data as of 2021, around 20 per cent of leveraged housing investors had a housing DTI ratio above 6 when considering their outstanding debts on all their investment properties as well as their owner-occupied dwelling. This corresponds to a time when the flow of new high DTI lending for investors had been strong for some time (Graph 8). Flows of high DTI lending have since decreased, suggesting investor leverage may have declined since then. The RBA and the Australian Prudential Regulation Authority (APRA) consider a DTI above 6 to be of higher risk (APRA 2025).
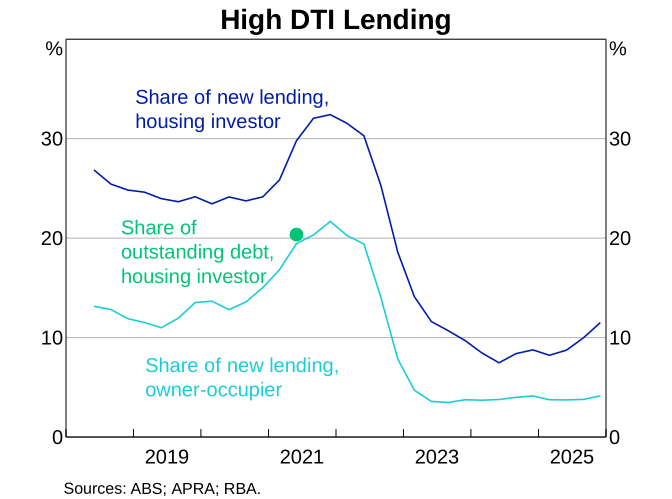
The share of housing investors with high outstanding DTI in 2021 suggests investors not only choose to take on high leverage initially but also tend to amortise their loans more slowly than owner-occupiers. This is consistent with investors more frequently using interest-only mortgage terms and presumably reflects tax incentives.11 More broadly, borrowers with higher levels of outstanding debt relative to their income tend to be more vulnerable to shocks. At the same time, investors tend to have other features that offset this vulnerability such as higher incomes, rental income, and characteristics that make them a lower risk of becoming unemployed (RBA 2024).
Investor households with owner-occupier debt tend to be more indebted
Households with both investment property and owner-occupier debt are more likely than households with only investor property debt to have high levels of debt relative to their income (Graph 9). Households with both investor and owner-occupier loans tend to have higher DTI ratios, such that these borrowers account for around 70 per cent of the investor households with outstanding debt to income ratios above 6.
Households with a single leveraged investment property tend to hold the smallest amount of debt, around $220,000 for the median household (Table 1). The highest levels of debt tend to be held by households with multiple investment properties and a leveraged owner-occupied dwelling. This group accounts for only 10 per cent of investor households but hold a median of $1 million in outstanding debt. Notably, housing investors with at least two investment properties and no owner-occupied debt hold less debt, on average, than investors with one investment property and a leveraged owner-occupied dwelling, despite the former group owning at least as many properties, if not more. Households with investor and owner-occupier debt are also more indebted relative to their income, compared with households with only investment property debt.
|
Outstanding total Median, rounded to nearest thousand |
Outstanding DTI Median, rounded to one decimal place |
|
|---|---|---|
| Single investment property | ||
| – No owner-occupier loan | $224,000 | 1.6 |
| – Owner-occupier loan | $655,000 | 4.1 |
| Multiple investment properties | ||
| – No owner-occupier loan | $498,000 | 3.2 |
| – Owner-occupier loan | $1,054,000 | 5.9 |
|
Sources: ABS; RBA. |
||
The results indicate that outstanding debt increases with not only the number of leveraged properties but also depends on which property type the debt is associated with. It could be the case that a housing investor’s owner-occupier dwelling is more likely to be higher value and hence have larger associated debt than their investment property. For example, a household’s investment property could be an apartment with a higher rental yield but lower value than their owner-occupied stand-alone house. However, debt recycling, where households deploy some of the equity in their owner-occupier loan for investment purposes, may blur the distinctions between the two property types an investor could hold. Depending on how households are responding to the Census question on mortgage expenses for their own home, this may lead to upward bias on our estimates of outstanding debt (see Appendix A for details).12
Debt levels increase with income while DTI decreases
The highest income quintile holds median outstanding debt of around $720,000, compared with around $300,000 for the lowest income quintile (Graph 10). This reflects a greater capacity of the higher income quintile to service larger loans. However, increases in loan size across the income distribution are not proportional to increases in income.
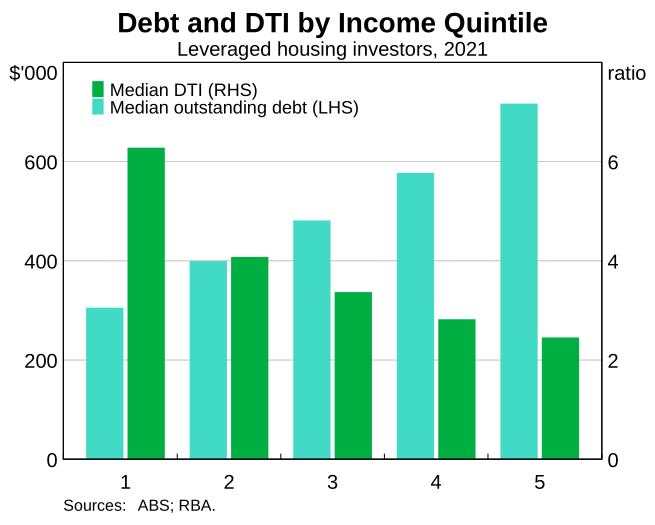
The income quintiles are constructed using the investor household population, who typically have higher incomes than the broader population. As a result, the lowest income quintile does not correspond to a typical low-income non-investor household.13 Nevertheless, the data indicate that lower income investors tend to be the most indebted relative to their income. While this group may represent a segment of vulnerability to monitor, it does not necessarily constitute a source of systemic risk.
Conclusion
Newly released data from ABS PLIDA-WHAM provides the most comprehensive view to date of housing investors in Australia. The dataset covers the full population of housing investors and allows a more granular assessment of investor heterogeneity and how key characteristics have evolved over time. This materially richer evidence base strengthens the RBA’s understanding of investor behaviour and associated financial stability risks.
Overall, housing investor characteristics have remained broadly stable over the past 20 years, a period in which housing investors have defaulted at lower rates than owner-occupiers. Investors continue, on average, to have higher incomes, and appear well placed to service their loans, supporting assessments of ongoing investor creditworthiness. These characteristics have historically underpinned investor resilience, even if investor activity can potentially contribute to an increase in housing-related vulnerabilities by amplifying housing and credit cycles.
At the same time, these data highlight areas of potential vulnerability that warrant monitoring in the period ahead. The housing investor population is ageing, which could reduce resilience in a downturn due to the extent that some of these investors may be relatively more reliant on rental income. In addition, around 20 per cent of investors had high DTI ratios in 2021, suggesting there are pockets of elevated leverage that could be more sensitive to adverse income, interest rate or housing price shocks. At the same time, high DTI investors could be more resilient to shocks compared with other high DTI borrowers given their relatively higher incomes, diversified collateral, and the ability to sell their property with less disruption to extinguish their debt.
This article presents a large body of descriptive analysis on investor households in Australia, highlighting a range of investor characteristics, some of which point to potential sources of vulnerability while others underscore why loan arrears have remained relatively low for many years. While the facts presented have offsetting implications for financial stability, on balance the evidence points to a resilient housing investor population. Future work will examine how these data can be used in applications of dynamic modelling, including to test how investor households would cope with an adverse macroeconomic shock involving shocks to incomes, asset prices and interest rates. This analysis is part of a program of work aimed at deepening the RBA’s understanding of the changing nature of vulnerabilities in the Australian financial system.
Appendix A: Further detail on leverage estimation
Estimating investment property portfolio leverage
For each investment property, a housing investor reports claimed interest expenses on the rental property schedule of their tax return. These interest expenses are a function of the outstanding loan balance and the applicable interest rate. From this fact, an investor’s outstanding loan balance is estimated using the following relationship:
This provides a reasonable estimate of debt on average, conditional on the assumed interest rate being representative of rates faced by investors.
There are, however, important caveats. Actual interest rates vary across borrowers, with some investors facing rates above or below the average. For example, due to differences between fixed and variable rates or discounted loan products.
Estimating private dwelling leverage
Households report monthly mortgage repayments for their primary residence in the Census. These reported repayments are used to estimate outstanding mortgage debt, applying an approach based on a Credit-Foncier-style loan structure. This assumes fixed, regular repayments that cover both principal and interest, with the loan fully amortised over its term.
Under this structure, repayments follow an amortising schedule: each payment services the interest due and reduces the outstanding principal. Over the life of the loan, the interest component of repayment declines while the principal component increases, although the total repayment remains constant.
The estimation takes place in two stages.
Stage 1 involves estimates of the initial loan amount given a reported monthly repayment and an assumed interest rate path. The method applies a reverse amortisation approach, starting from the end of the loan term (where the outstanding balance is zero) and working backwards month by month to the loan origination date. In each iteration, the opening balance for a given month is set equal to the closing balance from the preceding month, after which the applicable interest rate for that month is applied.
For each month, this method:
- Computes interest paid in the month:
- Computes the principal component in the month:
- Updates the previous balance:
This process continues until the starting month is reached, giving an estimate of the initial loan balance.
Stage 2 involves projections of the loan balance forward from the origination date using the initial loan amount estimated in Stage 1. For each month, the applicable interest rate is applied to the outstanding balance to determine the interest component and the remaining as the principal payment. The balance is then updated. This process is repeated sequentially for each month until the specified point in time is reached. The calculation mirrors the structure of Stage 1 but is implemented in the forward direction.
For each month, this method:
- Computes interest paid in the month:
- Computes the principal component in the month:
- Updates the next balance:
Assumptions
Several assumptions are required to implement the owner-occupier estimation:
- Loan term: The term is assumed to be 30 years for all loans, consistent with standard practice in Australia.
- Loan start date: The date is set to the earliest year household members recorded an address as their residence. To accurately assess the date, only residence periods commencing after 1 January 2006 are considered due to the availability of location data.
- Interest rate: All loans are assumed to follow the same interest rate path for a given loan period. Beyond the last observed value, rates are assumed to remain flat.
- Mortgage repayments: Census data provide monthly repayments, which are assumed to remain fixed over the loan term (this implies that households do not make additional repayments to lower their loan balance).
Interest rate
The choice of interest rate is critical to estimating both owner-occupier and investment housing debt. The most representative measure of the interest rate faced by borrowers is the average of actual rates on outstanding loans, published in RBA Statistical Table F6 (RBA n.d.). However, this series is only available from July 2019. To extend the history, we use advertised rates from RBA Statistical Table F5 (RBA n.d.). Using outstanding loan rates from the securitisation dataset as a benchmark, data from Table F5 are spliced back to extend the average outstanding rates series back to 1959. For simplicity, we assume constant fixed-rate loan share of 17 per cent (the observed average based on securitisation data), which is used to create a weighted average of the fixed and variable discounted interest rates. Separate interest rate paths are constructed for owner-occupiers and housing investors using the same approach.
Debt recycling
In Australia, tax deductibility is determined by the purpose of the borrowed money, not the property the loan is secured against. For a household that owns both an owner-occupied property and an investment property, debt recycling means they aim to turn part of their non-deductible home loan debt (owner-occupier leverage) into tax-deductible investment debt.
A household that has accumulated equity in their non-deductable owner-occupier loan (by paying down their loan balance and/or experiencing growth in the value of their collateral) can take some of this accumulated equity secured against their primary residence to invest in an income-generating asset, such as an investment property. The interest expenses for the portion of the loan used for this purpose are tax deductable and would appear on an individual taxpayer’s rental schedule.
It is possible that when responding to the Census question on monthly mortgage payments on their primary residence, respondents are reporting their entire mortgage expense, even if a portion of this has been used to purchase an investment property and is also claimed as deductible interest on a rental schedule. This could lead to some double counting in our estimation.
Household unit
An investor household is one where at least one household member has completed a rental schedule to indicate that they have an ownership interest in an investment property. Leverage is calculated at a constructed household level and incorporates both investment property and principal place of residence debt. Household income is taken from the 2021 Census to be consistent with household size and owner-occupier mortgage repayments.
The household construction shows 60 per cent of investor households comprise only one individual with an interest in an investment property. This may reflect sole investment activity, ownership acquired prior to household formation, or alternative ownership arrangements driven by tax or other considerations. As the analysis relies on aggregated household-level liabilities and income, the resulting estimates may differ from borrower-level measures produced by banks, depending on how debts are distributed across individuals. Consequently, the derived DTI ratios are definitionally different from the APRA measure. Nevertheless, a household-level view of debts and income may be more relevant in a stress-testing context, where resources are typically shared within households.
Endnotes
* The author is from Financial Stability Department. The author would like to thank Richard Evans, Tomas Cokis and James Bishop for helpful discussions and feedback on this work.
1 Individuals with interest in a rental property are required to submit these forms. Parternships and Trusts with interest in investment properties are also required to submit these forms, however, analysis in this article focuses only on rental schedules associated with properties owned by individuals. These data do not cover investors in Australia that have interest in a foreign rental property as income from such a property is treated as foreign income, not rental income. However, foreign investors who have interest in a property in Australia are included in the data.
2 Over the past two financial years, riskier forms of lending were contained. As a share of banks’ new lending, interest-only lending and high loan-to-value ratio lending to investors were stable, while the share with high DTI ratios declined.
3 The dwelling stock estimate in Graph 1 includes unoccupied dwellings and those with missing tenure information on the Census, while previous estimates of the share of properties that are rented excluded this (e.g. Graph 1 in Agarwal, Gao and Garner 2023). In addition, not all rented dwellings in the Census generate a rental property schedule (e.g. public housing, employer-provided housing and dwellings in caravan parks). The data in this article covers individuals only, excluding partnerships and trusts.
4 If investors randomly selected their property from the national housing stock, we would expect this number to be around 20 per cent. Our results therefore indicate strong within-state concentration beyond what the property stock distribution alone explains.
5 ‘Local area’ is defined as Statistical Area Level 3 (SA3), which is a geographic unit used by the ABS for analysing regional data. There are 359 SA3s covering the whole of Australia without gaps or overlaps. SA3s represent regions with populations typically between 30,000 and 130,000 people. Examples include Sydney Inner City, Parramatta, and Pittwater.
6 The effect of an ageing investor population on financial stability is currently unclear. Older investors may rely more on fixed incomes, but they are also less exposed to unemployment shocks and typically carry lower leverage, having paid down much of their debt.
7 The ‘income’ definition used in this article is a measure of gross income before deductions from tax and interest. It accounts for all income from investments, other sources, own incorporated business income, superannuation, annuity amount, and employment income.
8 The income data used in this article is available from financial years 2010/11 to 2022/23. There is a complementary source available for the earlier period back to financial year 1999/2000. The income distribution across these earlier years shows a very similar trend over time and the shares are similar. The largest difference is in the lowest income quintile where the share is closer to 10 per cent across the period.
9 The share of negatively geared investors is likely to increase more in subsequent data updates. First, the 2022/23 data point captures the period where rates were increasing, so the average rate over the period is lower than the terminal rate. Second, there would have been some fixed-rate investors who had not yet seen their interest expenses increase.
10 60 per cent of investor households have just one person with interest in an investment property. This may reflect individuals genuinely investing alone (including single-person households), owning property before forming a household, or for other optimal ownership considerations. Among households with multiple investors, most share leverage equally, measured as each investor’s interest payments relative to the household total. Unequal leverage typically arises when ownership shares differ or when one investor owns additional properties.
11 Since 2018, around 40 per cent of new investor lending was interest-only, compared with just 8–12 per cent for owner-occupiers.
12 If a household responds to the Census and says their mortgage payment for the owner-occupied dwelling is $X, but they have recycled $Y to purchase an investment property, we will double-count $Y as it will also be reported on the rental property schedule.
13 The thresholds for the quintiles of household income are (rounded to the nearest 1,000): Q1 < $78,000; Q2 < 130,000; Q3 < 156,000; Q4 < 234,000; Q5> 234,000. These thresholds are more than double the population-wide estimates at the individual level, suggesting incomes are higher even if you were to account for household size.
References
Agarwal N, R Gao and M Garner (2023), ‘Renters, Rent Inflation and Renter Stress’, RBA Bulletin, March.
Bradshaw N, J Hambur, M McCarthy, S Nash (2025), ‘Overview and Early Analysis of the New Wealth and Housing Asset Module (WHAM)’, ABS/RBA Conference, June.
APRA (Australian Prudential Regulation Authority) (2025), ‘Activating Debt-to-income Limits as a Macroprudential Policy Tool’, Information Paper, November.
RBA (Reserve Bank of Australia) (2014), ‘Box C: Households’ Investment Property Exposures: Evidence from Tax and Survey Data’, Financial Stability Review, September.
RBA (2017), ‘Box B: Households’ Investment Property Exposures: Insights from Tax Data’, Financial Stability Review, October.
RBA (2022a), ‘Chapter 2: Household and Business Finances’, Financial Stability Review, April.
RBA (2022b), ‘Chapter 2: Household and Business Finances in Australia’, Financial Stability Review, October.
RBA (2023a), ‘Chapter 3: Household and Business Finances in Australia’, Financial Stability Review, April.
RBA (2023b), ‘Chapter 2: Resilience of Australian Households and Businesses’, Financial Stability Review, October.
RBA (2024), ‘Box: Few Borrowers Would be at Risk of Default Owing to a Substantial Deterioration in Labour Market Conditions’, Financial Stability Review, September.
RBA (2025a), ‘Chapter 2: Resilience of Australian Households and Businesses’, Financial Stability Review, April.
RBA (2025b), ‘Chapter 2: Resilience of Australian Households and Businesses’, Financial Stability Review, October.
RBA (2026), ‘Chapter 2: Resilience of Australian Households and Businesses’, Financial Stability Review, March.
RBA (n.d.), ‘Statistical Tables’, Webpage.
Underlying data
This file contains all underlying data that are available for public release. Underlying data